Azure Monitor
An Azure service that is used to collect, analyze, and act on telemetry data from Azure and on-premises environments.
This browser is no longer supported.
Upgrade to Microsoft Edge to take advantage of the latest features, security updates, and technical support.
' cx='32' cy='32' r='32' /%3E%3Ctext x='50%25' y='55%25' dominant-baseline='middle' text-anchor='middle' fill='%23FFF' %3ER%3C/text%3E%3C/svg%3E)
Hello Expert,
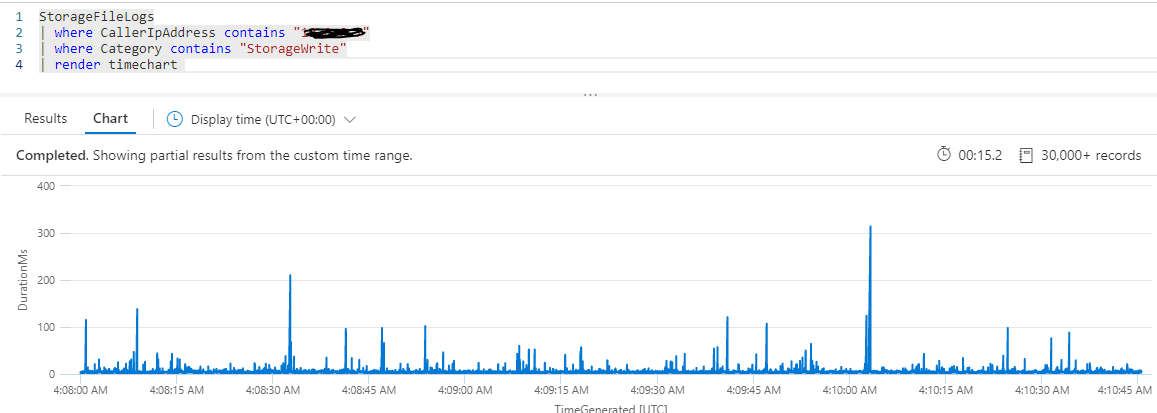
I have ran the query and generated the graph now, is this possible to export the same below graph chart like in pdf and excel as report and how.
' cx='32' cy='32' r='32' /%3E%3Ctext x='50%25' y='55%25' dominant-baseline='middle' text-anchor='middle' fill='%23FFF' %3ESM%3C/text%3E%3C/svg%3E)
@Richkm As of now, you can only upload/download Azure dashboards in JSON format to programmatically create dashboards, or you can create a dashboard and publish/ share your dashboard(s).
As you are interested in exporting the chart in excel or pdf. I would suggest you to export the log analytics data to excel by following steps mentioned in this document and then creating a chart from it.
References for creating chart :
I also would recommend you to navigate here and share your feedback or suggestions directly with the responsible Azure feature team and clicking the vote button of your suggestion to raise visibility and priority on it.