Note
Access to this page requires authorization. You can try signing in or changing directories.
Access to this page requires authorization. You can try changing directories.
This article describes:
- The types of monitoring data you can collect for this service.
- Ways to analyze that data.
Note
If you're already familiar with this service and/or Azure Monitor and just want to know how to analyze monitoring data, see the Analyze section near the end of this article.
When you have critical applications and business processes that rely on Azure resources, you need to monitor and get alerts for your system. The Azure Monitor service collects and aggregates metrics and logs from every component of your system. Azure Monitor provides you with a view of availability, performance, and resilience, and notifies you of issues. You can use the Azure portal, PowerShell, Azure CLI, REST API, or client libraries to set up and view monitoring data.
- For more information on Azure Monitor, see the Azure Monitor overview.
- For more information on how to monitor Azure resources in general, see Monitor Azure resources with Azure Monitor.
Insights
Some services in Azure have a built-in monitoring dashboard in the Azure portal that provides a starting point for monitoring your service. These dashboards are called insights, and you can find them in the Insights Hub of Azure Monitor in the Azure portal.
Insights for Azure Cache for Redis deliver the following experience:
- At scale perspective of your Azure Cache for Redis resources across subscriptions. You can selectively scope to only the subscriptions and resources you want to evaluate.
- Drill-down analysis of an Azure Cache for Redis resource. To diagnose problems, you can see detailed analysis of utilization, failures, capacity, and operations, or see an in-depth view of relevant information.
- Customization built on Azure Monitor workbook templates. You can change what metrics are displayed and modify or set thresholds that align with your limits. You can save the changes in a custom workbook and then pin workbook charts to Azure dashboards.
Insights for Azure Cache for Redis don't require you to enable or configure anything. Azure Cache for Redis information is collected by default, and there's no extra charge to access insights.
To learn how to view, configure, and customize insights for Azure Cache for Redis, see [Azure Monitor insights for Azure Cache for Redis]/azure-cache-for-redis/cache-insights-overview.md).
Resource types
Azure uses the concept of resource types and IDs to identify everything in a subscription. Resource types are also part of the resource IDs for every resource running in Azure. For example, one resource type for a virtual machine is Microsoft.Compute/virtualMachines. For a list of services and their associated resource types, see Resource providers.
Azure Monitor similarly organizes core monitoring data into metrics and logs based on resource types, also called namespaces. Different metrics and logs are available for different resource types. Your service might be associated with more than one resource type.
For more information about the resource types for Azure Cache for Redis, see Azure Cache for Redis monitoring data reference.
Data storage
For Azure Monitor:
- Metrics data is stored in the Azure Monitor metrics database.
- Log data is stored in the Azure Monitor logs store. Log Analytics is a tool in the Azure portal that can query this store.
- The Azure activity log is a separate store with its own interface in the Azure portal.
You can optionally route metric and activity log data to the Azure Monitor logs store. You can then use Log Analytics to query the data and correlate it with other log data.
Many services can use diagnostic settings to send metric and log data to other storage locations outside Azure Monitor. Examples include Azure Storage, hosted partner systems, and non-Azure partner systems, by using Event Hubs.
For detailed information on how Azure Monitor stores data, see Azure Monitor data platform.
Azure Monitor platform metrics
Azure Monitor provides platform metrics for most services. These metrics are:
- Individually defined for each namespace.
- Stored in the Azure Monitor time-series metrics database.
- Lightweight and capable of supporting near real-time alerting.
- Used to track the performance of a resource over time.
Collection: Azure Monitor collects platform metrics automatically. No configuration is required.
Routing: You can also route some platform metrics to Azure Monitor Logs / Log Analytics so you can query them with other log data. Check the DS export setting for each metric to see if you can use a diagnostic setting to route the metric to Azure Monitor Logs / Log Analytics.
- For more information, see the Metrics diagnostic setting.
- To configure diagnostic settings for a service, see Create diagnostic settings in Azure Monitor.
For a list of all metrics it's possible to gather for all resources in Azure Monitor, see Supported metrics in Azure Monitor.
For a list of available metrics for Azure Cache for Redis, see Azure Cache for Redis monitoring data reference.
Azure Monitor resource logs
Resource logs provide insight into operations that were done by an Azure resource. Logs are generated automatically, but you must route them to Azure Monitor logs to save or query them. Logs are organized in categories. A given namespace might have multiple resource log categories.
Collection: Resource logs aren't collected and stored until you create a diagnostic setting and route the logs to one or more locations. When you create a diagnostic setting, you specify which categories of logs to collect. There are multiple ways to create and maintain diagnostic settings, including the Azure portal, programmatically, and though Azure Policy.
Routing: The suggested default is to route resource logs to Azure Monitor Logs so you can query them with other log data. Other locations such as Azure Storage, Azure Event Hubs, and certain Microsoft monitoring partners are also available. For more information, see Azure resource logs and Resource log destinations.
For detailed information about collecting, storing, and routing resource logs, see Diagnostic settings in Azure Monitor.
For a list of all available resource log categories in Azure Monitor, see Supported resource logs in Azure Monitor.
All resource logs in Azure Monitor have the same header fields, followed by service-specific fields. The common schema is outlined in Azure Monitor resource log schema.
For the available resource log categories, their associated Log Analytics tables, and the logs schemas for Azure Cache for Redis, see Azure Cache for Redis monitoring data reference.
Azure Cache for Redis resource logs
In Azure Cache for Redis, two options are available to log:
- Cache Metrics ("AllMetrics") logs metrics from Azure Monitor
- Connection Logs logs connections to the cache for security and diagnostic purposes.
Cache metrics
Azure Cache for Redis emits many metrics such as Server Load and Connections per Second that are useful to log. Selecting the AllMetrics option allows these and other cache metrics to be logged. You can configure how long to retain the metrics.
Connection logs
Azure Cache for Redis uses Azure diagnostic settings to log information on client connections to your cache. Logging and analyzing this diagnostic setting helps you understand who is connecting to your caches and the timestamp of those connections. The log data could be used to identify the scope of a security breach and for security auditing purposes.
The connection logs have slightly different implementations, contents, and setup procedures for the different Azure Cache for Redis tiers. For details, see [Azure Monitor diagnostic settings]/azure-cache-for-redis/cache-monitor-diagnostic-settings.md).
Azure activity log
The activity log contains subscription-level events that track operations for each Azure resource as seen from outside that resource; for example, creating a new resource or starting a virtual machine.
Collection: Activity log events are automatically generated and collected in a separate store for viewing in the Azure portal.
Routing: You can send activity log data to Azure Monitor Logs so you can analyze it alongside other log data. Other locations such as Azure Storage, Azure Event Hubs, and certain Microsoft monitoring partners are also available. For more information on how to route the activity log, see Overview of the Azure activity log.
Analyze monitoring data
There are many tools for analyzing monitoring data.
Azure Monitor tools
Azure Monitor supports the following basic tools:
Metrics explorer, a tool in the Azure portal that allows you to view and analyze metrics for Azure resources. For more information, see Analyze metrics with Azure Monitor metrics explorer.
Log Analytics, a tool in the Azure portal that allows you to query and analyze log data by using the Kusto query language (KQL). For more information, see Get started with log queries in Azure Monitor.
The activity log, which has a user interface in the Azure portal for viewing and basic searches. To do more in-depth analysis, you have to route the data to Azure Monitor logs and run more complex queries in Log Analytics.
Tools that allow more complex visualization include:
- Dashboards that let you combine different kinds of data into a single pane in the Azure portal.
- Workbooks, customizable reports that you can create in the Azure portal. Workbooks can include text, metrics, and log queries.
- Grafana, an open platform tool that excels in operational dashboards. You can use Grafana to create dashboards that include data from multiple sources other than Azure Monitor.
- Power BI, a business analytics service that provides interactive visualizations across various data sources. You can configure Power BI to automatically import log data from Azure Monitor to take advantage of these visualizations.
Azure Monitor export tools
You can get data out of Azure Monitor into other tools by using the following methods:
Metrics: Use the REST API for metrics to extract metric data from the Azure Monitor metrics database. The API supports filter expressions to refine the data retrieved. For more information, see Azure Monitor REST API reference.
Logs: Use the REST API or the associated client libraries.
Another option is the workspace data export.
To get started with the REST API for Azure Monitor, see Azure monitoring REST API walkthrough.
Azure Cache for Redis metrics
Metrics for Azure Cache for Redis instances are collected using the Redis INFO command. Metrics are collected approximately two times per minute so they can be displayed in the metrics charts and evaluated by alert rules. To learn how long data is retained and how to configure a different retention policy, see Data retention and archive in Azure Monitor Logs.
The metrics are reported using several reporting intervals, including Past hour, Today, Past week, and Custom. Each metrics chart displays the average, minimum, and maximum values for each metric in the chart, and some metrics display a total for the reporting interval.
Each metric includes two versions: One metric measures performance for the entire cache, and for caches that use clustering. A second version of the metric, which includes (Shard 0-9) in the name, measures performance for a single shard in a cache. For example if a cache has four shards, Cache Hits is the total number of hits for the entire cache, and Cache Hits (Shard 3) measures just the hits for that shard of the cache.

View cache metrics
You can view Azure Monitor metrics for Azure Cache for Redis directly from an Azure Cache for Redis resource in the Azure portal.
Select your Azure Cache for Redis instance in the portal. The Overview page shows the predefined Memory Usage and Redis Server Load monitoring charts. These charts are useful summaries that allow you to take a quick look at the state of your cache.

For more in-depth information, you can monitor the following useful Azure Cache for Redis metrics from the Monitoring section of the Resource menu.
| Azure Cache for Redis metric | More information |
|---|---|
| Network bandwidth usage | Cache performance - available bandwidth |
| Connected clients | Default Redis server configuration - max clients |
| Server load | Redis Server Load |
| Memory usage | Cache performance - size |

Create your own metrics
You can create your own custom chart to track the metrics you want to see. Cache metrics are reported using several reporting intervals, including Past hour, Today, Past week, and Custom. On the left, select the Metric in the Monitoring section. Each metrics chart displays the average, minimum, and maximum values for each metric in the chart, and some metrics display a total for the reporting interval.
Each metric includes two versions: One metric measures performance for the entire cache, and for caches that use clustering. A second version of the metric, which includes (Shard 0-9) in the name, measures performance for a single shard in a cache. For example if a cache has four shards, Cache Hits is the total number of hits for the entire cache, and Cache Hits (Shard 3) measures just the hits for that shard of the cache.
In the Resource menu on the left, select Metrics under Monitoring. Here, you design your own chart for your cache, defining the metric type and aggregation type.
Aggregation types
For general information about aggregation types, see Configure aggregation.
Under normal cache conditions, Average and Max are similar because only the primary node emits these metrics. In a scenario where the number of connected clients changes rapidly, Max, Average, and Min show different values, which is also expected behavior.
The types Count and Sum can be misleading for certain metrics, such as connected clients. Instead, it's best to look at the Average metrics and not the Sum metrics.
Note
Even when the cache is idle with no connected active client applications, you might see some cache activity, such as connected clients, memory usage, and operations being performed. The activity is normal in the operation of the cache.
For nonclustered caches, it's best to use the metrics without the suffix Instance Based. For example, to check server load for your cache instance, use the metric Server Load.
In contrast, for clustered caches, use the metrics with the suffix Instance Based. Then, add a split or filter on ShardId. For example, to check the server load of shard 1, use the metric Server Load (Instance Based), then apply filter ShardId = 1.
Kusto queries
You can analyze monitoring data in the Azure Monitor Logs / Log Analytics store by using the Kusto query language (KQL).
Important
When you select Logs from the service's menu in the portal, Log Analytics opens with the query scope set to the current service. This scope means that log queries will only include data from that type of resource. If you want to run a query that includes data from other Azure services, select Logs from the Azure Monitor menu. See Log query scope and time range in Azure Monitor Log Analytics for details.
For a list of common queries for any service, see the Log Analytics queries interface.
Log Analytics queries
Note
For a tutorial on how to use Azure Log Analytics, see Overview of Log Analytics in Azure Monitor. Remember that it may take up to 90 minutes before logs show up in Log Analytics.
Here are some basic queries to use as models.
Alerts
Azure Monitor alerts proactively notify you when specific conditions are found in your monitoring data. Alerts allow you to identify and address issues in your system before your customers notice them. For more information, see Azure Monitor alerts.
There are many sources of common alerts for Azure resources. For examples of common alerts for Azure resources, see Sample log alert queries. The Azure Monitor Baseline Alerts (AMBA) site provides a semi-automated method of implementing important platform metric alerts, dashboards, and guidelines. The site applies to a continually expanding subset of Azure services, including all services that are part of the Azure Landing Zone (ALZ).
The common alert schema standardizes the consumption of Azure Monitor alert notifications. For more information, see Common alert schema.
Types of alerts
You can alert on any metric or log data source in the Azure Monitor data platform. There are many different types of alerts depending on the services you're monitoring and the monitoring data you're collecting. Different types of alerts have various benefits and drawbacks. For more information, see Choose the right monitoring alert type.
The following list describes the types of Azure Monitor alerts you can create:
- Metric alerts evaluate resource metrics at regular intervals. Metrics can be platform metrics, custom metrics, logs from Azure Monitor converted to metrics, or Application Insights metrics. Metric alerts can also apply multiple conditions and dynamic thresholds.
- Log alerts allow users to use a Log Analytics query to evaluate resource logs at a predefined frequency.
- Activity log alerts trigger when a new activity log event occurs that matches defined conditions. Resource Health alerts and Service Health alerts are activity log alerts that report on your service and resource health.
Some Azure services also support smart detection alerts, Prometheus alerts, or recommended alert rules.
For some services, you can monitor at scale by applying the same metric alert rule to multiple resources of the same type that exist in the same Azure region. Individual notifications are sent for each monitored resource. For supported Azure services and clouds, see Monitor multiple resources with one alert rule.
Create alerts
You can configure to receive alerts based on metrics and activity logs. Azure Monitor allows you to configure an alert to do the following when it triggers:
- Send an email notification
- Call a webhook
- Invoke an Azure Logic App
To configure alerts for your cache, select Alerts under Monitoring on the Resource menu.

Azure Cache for Redis common alert rules
The following table lists common and recommended alert rules for Azure Cache for Redis.
| Alert type | Condition | Description |
|---|---|---|
| Metric | 99th percentile latency | Alert on the worst-case latency of server-side commands in Azure Cache for Redis instances. Latency is measured by using PING commands and tracking response times. Track the health of your cache instance to see if long-running commands are compromising latency performance. |
| Metric | High Server Load usage or spikes |
High server load means the Redis server is unable to keep up with requests, leading to timeouts or slow responses. Create alerts on metrics on server load metrics to be notified early about potential impacts. |
| Metric | High network bandwidth usage | If the server exceeds the available bandwidth, then data isn't sent to the client as quickly. Client requests could time out because the server can't push data to the client fast enough. Set up alerts for server-side network bandwidth limits by using the Cache Read and Cache Write counters. |
Advisor recommendations
For some services, if critical conditions or imminent changes occur during resource operations, an alert displays on the service Overview page in the portal. You can find more information and recommended fixes for the alert in Advisor recommendations under Monitoring in the left menu. During normal operations, no advisor recommendations display.
For more information on Azure Advisor, see Azure Advisor overview.
The following screenshot shows an advisor recommendation for an Azure Cache for Redis alert:
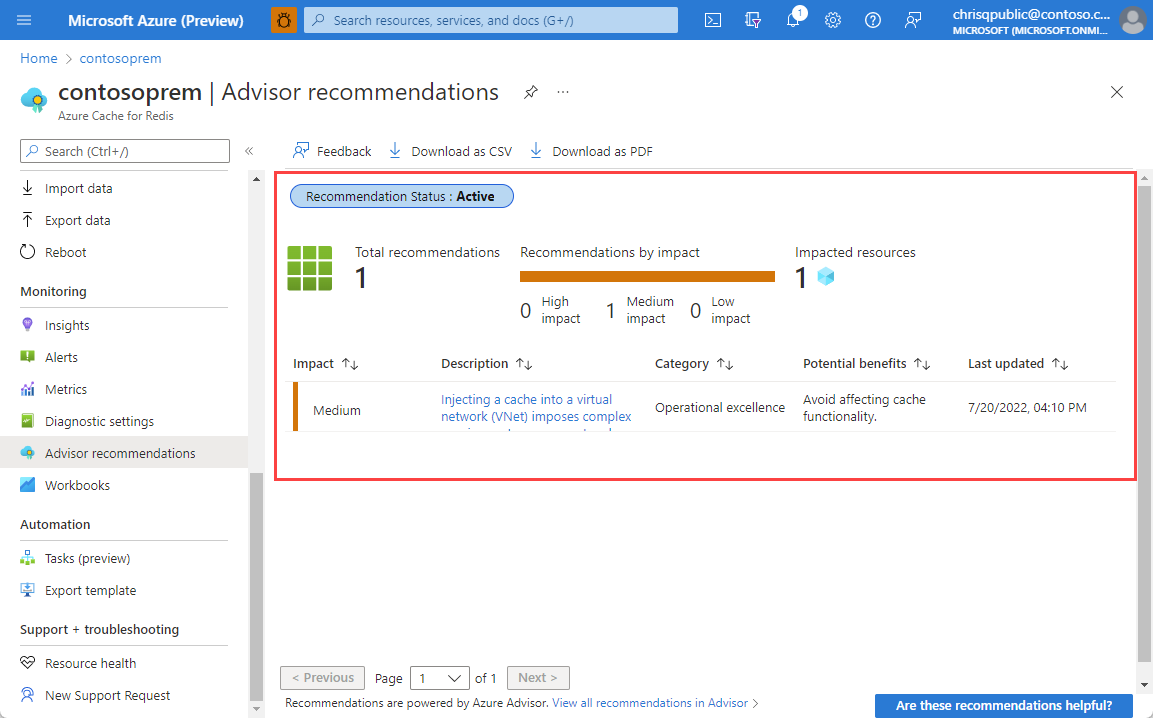
To upgrade your cache, select Upgrade now to change the pricing tier and scale your cache. For more information on choosing a pricing tier, see Choosing the right tier.
Related content
- See Azure Cache for Redis monitoring data reference for a reference of the metrics, logs, and other important values created for Azure Cache for Redis.
- See Monitoring Azure resources with Azure Monitor for general details on monitoring Azure resources.