Note
Access to this page requires authorization. You can try signing in or changing directories.
Access to this page requires authorization. You can try changing directories.
This article describes:
- The types of monitoring data you can collect for this service.
- Ways to analyze that data.
Note
If you're already familiar with this service and/or Azure Monitor and just want to know how to analyze monitoring data, see the Analyze section near the end of this article.
When you have critical applications and business processes that rely on Azure resources, you need to monitor and get alerts for your system. The Azure Monitor service collects and aggregates metrics and logs from every component of your system. Azure Monitor provides you with a view of availability, performance, and resilience, and notifies you of issues. You can use the Azure portal, PowerShell, Azure CLI, REST API, or client libraries to set up and view monitoring data.
- For more information on Azure Monitor, see the Azure Monitor overview.
- For more information on how to monitor Azure resources in general, see Monitor Azure resources with Azure Monitor.
Insights
Some services in Azure have a built-in monitoring dashboard in the Azure portal that provides a starting point for monitoring your service. These dashboards are called insights, and you can find them in the Insights Hub of Azure Monitor in the Azure portal.
Application Insights
Azure Functions has built-in integration with Application Insights to monitor function executions. For detailed information about how to integrate, configure, and use Application Insights to monitor Azure Functions, see the following articles:
- Monitor executions in Azure Functions
- Configure monitoring for Azure Functions
- Analyze Azure Functions telemetry in Application Insights
- Monitor Azure Functions with Application Insights
Resource types
Azure uses the concept of resource types and IDs to identify everything in a subscription. Resource types are also part of the resource IDs for every resource running in Azure. For example, one resource type for a virtual machine is Microsoft.Compute/virtualMachines. For a list of services and their associated resource types, see Resource providers.
Azure Monitor similarly organizes core monitoring data into metrics and logs based on resource types, also called namespaces. Different metrics and logs are available for different resource types. Your service might be associated with more than one resource type.
For more information about the resource types for Azure Functions, see Azure Functions monitoring data reference.
Data storage
For Azure Monitor:
- Metrics data is stored in the Azure Monitor metrics database.
- Log data is stored in the Azure Monitor logs store. Log Analytics is a tool in the Azure portal that can query this store.
- The Azure activity log is a separate store with its own interface in the Azure portal.
You can optionally route metric and activity log data to the Azure Monitor logs store. You can then use Log Analytics to query the data and correlate it with other log data.
Many services can use diagnostic settings to send metric and log data to other storage locations outside Azure Monitor. Examples include Azure Storage, hosted partner systems, and non-Azure partner systems, by using Event Hubs.
For detailed information on how Azure Monitor stores data, see Azure Monitor data platform.
Azure Monitor platform metrics
Azure Monitor provides platform metrics for most services. These metrics are:
- Individually defined for each namespace.
- Stored in the Azure Monitor time-series metrics database.
- Lightweight and capable of supporting near real-time alerting.
- Used to track the performance of a resource over time.
Collection: Azure Monitor collects platform metrics automatically. No configuration is required.
Routing: You can also route some platform metrics to Azure Monitor Logs / Log Analytics so you can query them with other log data. Check the DS export setting for each metric to see if you can use a diagnostic setting to route the metric to Azure Monitor Logs / Log Analytics.
- For more information, see the Metrics diagnostic setting.
- To configure diagnostic settings for a service, see Create diagnostic settings in Azure Monitor.
For a list of all metrics it's possible to gather for all resources in Azure Monitor, see Supported metrics in Azure Monitor.
For a list of available metrics for Azure Functions, see Azure Functions monitoring data reference.
Note
App Service metrics (Microsoft.Web/sites) aren't available when your function app runs on Linux in a Consumption plan.
Azure Monitor resource logs
Resource logs provide insight into operations that were done by an Azure resource. Logs are generated automatically, but you must route them to Azure Monitor logs to save or query them. Logs are organized in categories. A given namespace might have multiple resource log categories.
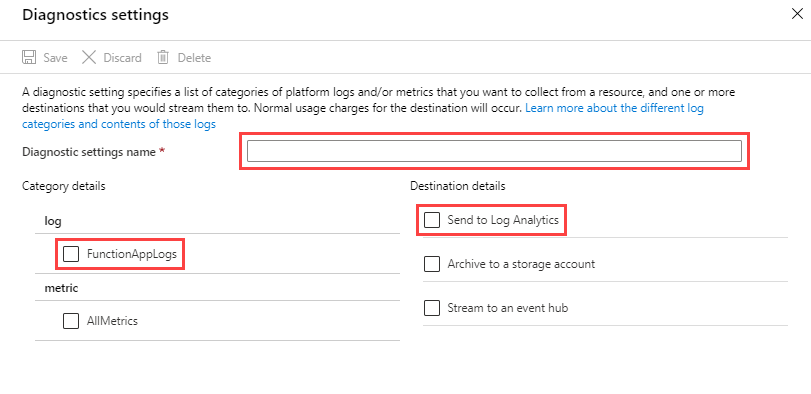
Collection: Resource logs aren't collected and stored until you create a diagnostic setting and route the logs to one or more locations. When you create a diagnostic setting, you specify which categories of logs to collect. There are multiple ways to create and maintain diagnostic settings, including the Azure portal, programmatically, and though Azure Policy.
Routing: The suggested default is to route resource logs to Azure Monitor Logs so you can query them with other log data. Other locations such as Azure Storage, Azure Event Hubs, and certain Microsoft monitoring partners are also available. For more information, see Azure resource logs and Resource log destinations.
For detailed information about collecting, storing, and routing resource logs, see Diagnostic settings in Azure Monitor.
For a list of all available resource log categories in Azure Monitor, see Supported resource logs in Azure Monitor.
All resource logs in Azure Monitor have the same header fields, followed by service-specific fields. The common schema is outlined in Azure Monitor resource log schema.
Azure Functions integrates with Azure Monitor Logs to monitor functions. For detailed instructions on how to set up diagnostic settings to configure and route resource logs, see Create diagnostic settings in Azure Monitor.
For the available resource log categories, their associated Log Analytics tables, and the logs schemas for Azure Functions, see Azure Functions monitoring data reference.
Important
Application Insights processes telemetry in batches. When a batch payload is too large or contains unescaped special characters, log entries might be dropped. To help prevent data loss:
- Limit individual log messages to 10,000 characters, especially when you log large XML or JSON payloads.
- Escape special characters in log data.
- Summarize or truncate large payloads before you log them.
Azure activity log
The activity log contains subscription-level events that track operations for each Azure resource as seen from outside that resource; for example, creating a new resource or starting a virtual machine.
Collection: Activity log events are automatically generated and collected in a separate store for viewing in the Azure portal.
Routing: You can send activity log data to Azure Monitor Logs so you can analyze it alongside other log data. Other locations such as Azure Storage, Azure Event Hubs, and certain Microsoft monitoring partners are also available. For more information on how to route the activity log, see Overview of the Azure activity log.
Other logs
Azure Functions also offers the ability to collect more than Azure Monitor resource logs. To view a near real time stream of application log files generated by your function running in Azure, you can connect to Application Insights and use Live Metrics Stream. Or, you can use the App Service platform built-in log streaming to view a stream of application log files. For more information, see Enable streaming execution logs in Azure Functions.
Analyze monitoring data
There are many tools for analyzing monitoring data.
Azure Monitor tools
Azure Monitor supports the following basic tools:
Metrics explorer, a tool in the Azure portal that allows you to view and analyze metrics for Azure resources. For more information, see Analyze metrics with Azure Monitor metrics explorer.
Log Analytics, a tool in the Azure portal that allows you to query and analyze log data by using the Kusto query language (KQL). For more information, see Get started with log queries in Azure Monitor.
The activity log, which has a user interface in the Azure portal for viewing and basic searches. To do more in-depth analysis, you have to route the data to Azure Monitor logs and run more complex queries in Log Analytics.
Tools that allow more complex visualization include:
- Dashboards that let you combine different kinds of data into a single pane in the Azure portal.
- Workbooks, customizable reports that you can create in the Azure portal. Workbooks can include text, metrics, and log queries.
- Grafana, an open platform tool that excels in operational dashboards. You can use Grafana to create dashboards that include data from multiple sources other than Azure Monitor.
- Power BI, a business analytics service that provides interactive visualizations across various data sources. You can configure Power BI to automatically import log data from Azure Monitor to take advantage of these visualizations.
Azure Monitor export tools
You can get data out of Azure Monitor into other tools by using the following methods:
Metrics: Use the REST API for metrics to extract metric data from the Azure Monitor metrics database. The API supports filter expressions to refine the data retrieved. For more information, see Azure Monitor REST API reference.
Logs: Use the REST API or the associated client libraries.
Another option is the workspace data export.
To get started with the REST API for Azure Monitor, see Azure monitoring REST API walkthrough.
Analyze metrics for Azure Functions
Functions provides these two dynamic scale plans that support serverless hosting:
Provides fast horizontal scaling, with flexible compute options, virtual network integration, and full support for connections using Microsoft Entra ID authentication. In this plan, instances dynamically scale out based on configured per-instance concurrency, incoming events, and per-function workloads for optimal efficiency. Flex Consumption is the recommended plan for serverless hosting. For more information, see Azure Functions Flex Consumption plan hosting.
The app-level metrics available to your app depend on the type of consumption plan you use.
These Azure Monitor metrics are related to Flex Consumption plan billing:
| Metric | Description | Meter calculation |
|---|---|---|
| On Demand Function Execution Count | Total number of function executions in on demand instances. | OnDemandFunctionExecutionCount relates to the On Demand Total Executions meter. |
| Always Ready Function Execution Count | Total number of function executions in always ready instances. | AlwaysReadyFunctionExecutionCount relates to the Always Ready Total Executions meter. |
| On Demand Function Execution Units | Total MB-milliseconds from on demand instances while actively executing functions. | OnDemandFunctionExecutionUnits / 1,024,000 is the On Demand Execution Time meter, in GB-seconds. |
| Always Ready Function Execution Units | Total MB-milliseconds from always ready instances while actively executing functions. | AlwaysReadyFunctionExecutionUnits / 1,024,000 is the Always Ready Execution Time meter, in GB-seconds. |
| Always Ready Units | The total MB-milliseconds of always ready instances assigned to the app, whether or not functions are actively executing. | AlwaysReadyUnits / 1,024,000 is the Always Ready Baseline meter, in GB-seconds. |
For more information, see Azure Functions monitoring data reference.
To better understand the costs of your functions, use Azure Monitor to view cost-related metrics that your function apps generate. You can view Monitor metrics by using one of these tools:
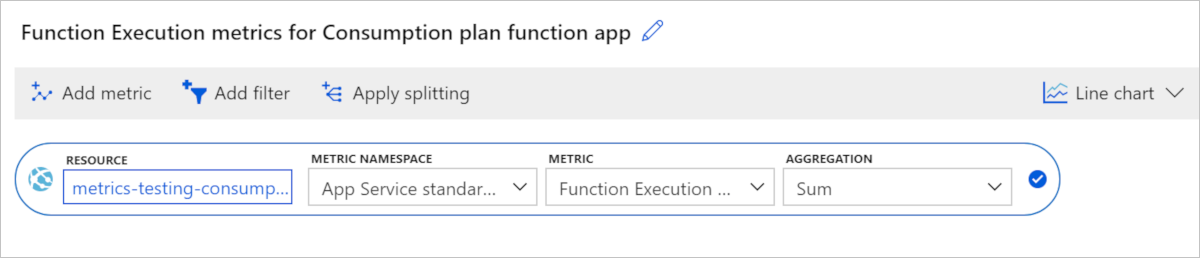
Use Azure Monitor metrics explorer to view cost-related data for your Flex Consumption plan function apps in a graphical format.
In the Azure portal, go to your function app.
In the left panel, scroll down to Monitoring and select Metrics.
From Metric, select On Demand Function Execution Count and Sum for Aggregation. This selection adds the sum of the execution counts during the chosen period to the chart.
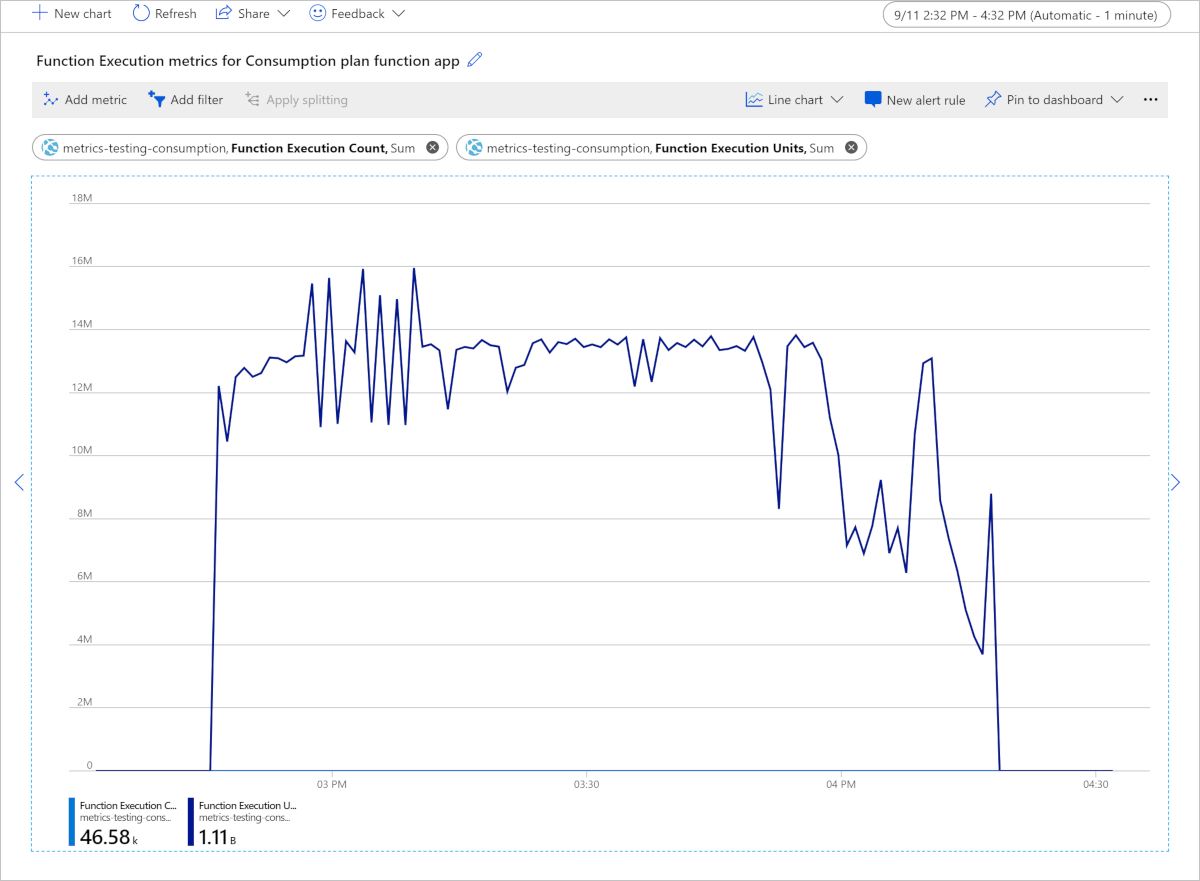
Select Add metric and add On Demand Function Execution Units, Always Ready Function Execution Count, Always Ready Function Execution Units, and Always Ready Units to the chart.
The resulting chart contains the totals for all the Flex Consumption execution metrics in the chosen time range, which in this example is a custom time range.

Because the number of On Demand Function Execution Units is greater than On Demand Function Execution Count, and there were no always ready instances on the app, the chart just shows On Demand Function Execution Units.
This chart shows a total of 3.54 billion On Demand Function Execution Units consumed in a 16-minute period, measured in MB-milliseconds. To convert to GB-seconds, divide by 1,024,000. In this example, the function app consumed 3,540,000,000 / 1,024,000 = 3,457.03 GB-seconds. You can take this value and multiply it by the current price of On Demand Execution Time on the Functions pricing page, which gives you the cost of these 16 minutes, assuming you already used any free grants of execution time. You can use this same calculation with the The Always Ready Function Execution Units metric and the Always Ready Execution Time billing meter cost, as well as with the Always Ready Units metric and the Always Ready Baseline billing meter cost, to find out the GB-seconds costs for always ready instances.
To calculate the On Demand Total Executions cost, take the On Demand Function Execution Count sum for the same time period, convert to millions, and then multiply by the On Demand Total Executions price on the Functions pricing page. For example, 2,100 executions in the example above converts to 0.0021 million executions. You can use this same calculation with the Always Ready Function Execution Count metric and the Always Ready Total Executions billing meter to find out the cost for executions handled by always ready instance.
To learn more about estimating costs for these plans, see Estimating consumption plan costs.
Analyze logs for Azure Functions
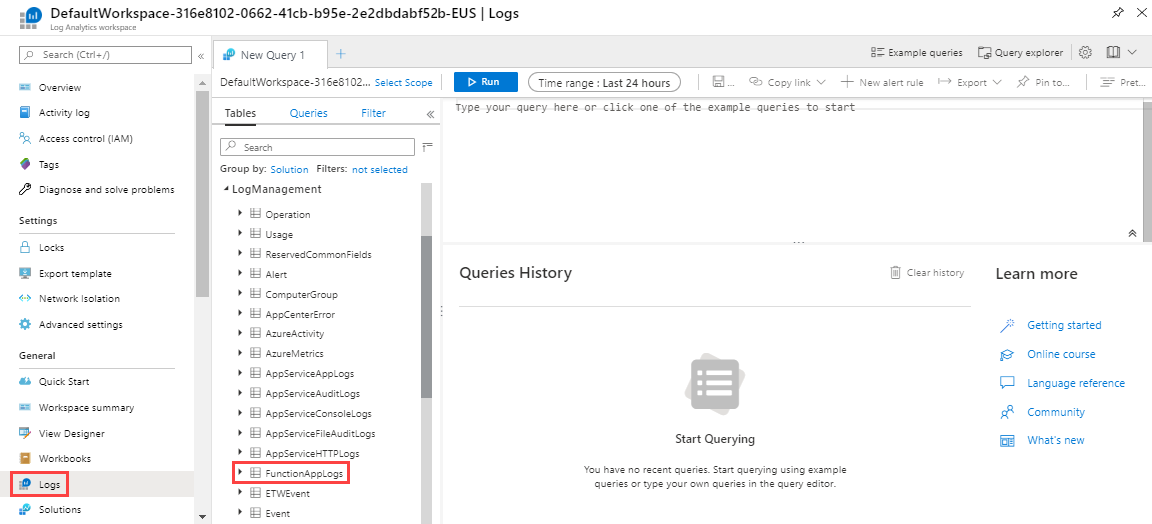
Azure Functions writes all logs to the FunctionAppLogs table under LogManagement in the Log Analytics workspace where you send the data. You can use Kusto queries to query the data.
Kusto queries
You can analyze monitoring data in the Azure Monitor Logs / Log Analytics store by using the Kusto query language (KQL).
Important
When you select Logs from the service's menu in the portal, Log Analytics opens with the query scope set to the current service. This scope means that log queries will only include data from that type of resource. If you want to run a query that includes data from other Azure services, select Logs from the Azure Monitor menu. See Log query scope and time range in Azure Monitor Log Analytics for details.
For a list of common queries for any service, see the Log Analytics queries interface.
The following sample queries can help you monitor all your functions app logs:
FunctionAppLogs
| order by TimeGenerated desc
FunctionAppLogs
| project TimeGenerated, HostInstanceId, Message, _ResourceId
| order by TimeGenerated desc
The following sample query can help you monitor a specific functions app's logs:
FunctionAppLogs
| where FunctionName == "<Function name>"
| order by TimeGenerated desc
The following sample query can help you monitor exceptions on all your functions app logs:
FunctionAppLogs
| where ExceptionDetails != ""
| order by TimeGenerated asc
The following sample query can help you monitor exceptions on a specific functions app's logs:
FunctionAppLogs
| where ExceptionDetails != ""
| where FunctionName == "<Function name>"
| order by TimeGenerated desc
Alerts
Azure Monitor alerts proactively notify you when specific conditions are found in your monitoring data. Alerts allow you to identify and address issues in your system before your customers notice them. For more information, see Azure Monitor alerts.
There are many sources of common alerts for Azure resources. For examples of common alerts for Azure resources, see Sample log alert queries. The Azure Monitor Baseline Alerts (AMBA) site provides a semi-automated method of implementing important platform metric alerts, dashboards, and guidelines. The site applies to a continually expanding subset of Azure services, including all services that are part of the Azure Landing Zone (ALZ).
The common alert schema standardizes the consumption of Azure Monitor alert notifications. For more information, see Common alert schema.
Types of alerts
You can alert on any metric or log data source in the Azure Monitor data platform. There are many different types of alerts depending on the services you're monitoring and the monitoring data you're collecting. Different types of alerts have various benefits and drawbacks. For more information, see Choose the right monitoring alert type.
The following list describes the types of Azure Monitor alerts you can create:
- Metric alerts evaluate resource metrics at regular intervals. Metrics can be platform metrics, custom metrics, logs from Azure Monitor converted to metrics, or Application Insights metrics. Metric alerts can also apply multiple conditions and dynamic thresholds.
- Log alerts allow users to use a Log Analytics query to evaluate resource logs at a predefined frequency.
- Activity log alerts trigger when a new activity log event occurs that matches defined conditions. Resource Health alerts and Service Health alerts are activity log alerts that report on your service and resource health.
Some Azure services also support smart detection alerts, Prometheus alerts, or recommended alert rules.
For some services, you can monitor at scale by applying the same metric alert rule to multiple resources of the same type that exist in the same Azure region. Individual notifications are sent for each monitored resource. For supported Azure services and clouds, see Monitor multiple resources with one alert rule.
Note
If you're creating or running an application that runs on your service, Azure Monitor application insights might offer more types of alerts.
Azure Functions alert rules
The following table lists common and recommended alert rules for Azure Functions. These alerts are just recommendations. You can set alerts for any metric, log entry, or activity log entry listed in the Monitoring data reference for Azure Functions.
| Alert type | Condition | Description |
|---|---|---|
| Metric | Average connections | When number of connections exceed a set value |
| Metric | HTTP 404 | When HTTP 404 responses exceed a set value |
| Metric | HTTP Server Errors | When HTTP 5xx errors exceed a set value |
| Activity Log | Create or update function app | When app is created or updated |
| Activity Log | Delete function app | When app is deleted |
| Activity Log | Restart function app | When app is restarted |
| Activity Log | Stop function app | When app is stopped |
Advisor recommendations
For some services, if critical conditions or imminent changes occur during resource operations, an alert displays on the service Overview page in the portal. You can find more information and recommended fixes for the alert in Advisor recommendations under Monitoring in the left menu. During normal operations, no advisor recommendations display.
For more information on Azure Advisor, see Azure Advisor overview.
Related content
For more information about monitoring Azure Functions, see the following articles:
- Azure Functions monitoring data reference provides a reference of the metrics, logs, and other important values available for your function app.
- Monitor Azure resources with Azure Monitor gives general details about monitoring Azure resources.
- Monitor executions in Azure Functions details how to monitor a function app.
- How to configure monitoring for Azure Functions describes how to configure monitoring.
- Analyze Azure Functions telemetry in Application Insights describes how to view and query the data being collected from a function app.