Note
Access to this page requires authorization. You can try signing in or changing directories.
Access to this page requires authorization. You can try changing directories.
Applies to: ![]() Azure SQL Database
Azure SQL Database ![]() Azure SQL Managed Instance
Azure SQL Managed Instance
Database watcher is a managed monitoring solution for database services in the Azure SQL family. It supports Azure SQL Database and Azure SQL Managed Instance.
Database watcher collects in-depth workload monitoring data to give you a detailed view of database performance, configuration, and health. Monitoring data from the databases, elastic pools, and SQL managed instances you select is collected into a central data store in your Azure subscription. Dashboards in Azure portal provide a single-pane-of-glass view of your Azure SQL estate and a detailed view of each database, elastic pool, and SQL managed instance. Alerts send you notifications when database conditions across your Azure SQL estate might require attention.

To store and analyze SQL monitoring data, database watcher can use either Azure Data Explorer or Real-Time Analytics in Microsoft Fabric. Azure Data Explorer is a fully managed, highly scalable data service, purpose-built for fast ingestion and analytics on time-series monitoring data. A single Azure Data Explorer cluster can scale to support monitoring data from thousands of Azure SQL resources. Real-Time Analytics uses the same core engine as a SaaS offering within Microsoft Fabric.
You can query data in an Azure Data Explorer or Real-Time Analytics database using KQL or T-SQL, build custom visualizations using Azure Data Explorer dashboards, Power BI or Grafana, and analyze data in Excel. You can set data retention policy per database or per table, and scale your Azure Data Explorer cluster automatically or manually to achieve the optimal price/performance ratio.
To start monitoring your Azure SQL resources, create a watcher resource in your Azure subscription. Configure the watcher by selecting a data store and a set of databases, elastic pools, or SQL managed instances to monitor, called SQL targets. Grant the watcher access to targets, and start the watcher.
For the steps to get started quickly, see Quickstart: monitor Azure SQL with database watcher. For setup and configuration details, see Create and configure a watcher.
For answers to frequently asked questions about database watcher, see Database watcher FAQ.
For a video overview of database watcher, watch a Data Exposed episode:
Note
Database watcher is currently in preview. Preview features are released with limited capabilities, but are made available on a preview basis so customers can get early access and provide feedback. Preview features are subject to separate supplemental preview terms, and aren't subject to SLAs. Support is provided as best effort in certain cases. However, Microsoft Support is eager to get your feedback on the preview functionality, and might provide best effort support in certain cases. Preview features might have limited or restricted functionality, and might be available only in selected geographic areas.
Supported Azure SQL targets
Database watcher supports all service tiers, compute tiers, and service objectives in Azure SQL Database and Azure SQL Managed Instance. This includes vCore and DTU purchasing models, provisioned and serverless compute tiers, single databases and elastic pools, and Hyperscale.
Database watcher can monitor all types of secondary readable replicas, including high availability replicas, geo-replicas, and Hyperscale named secondary replicas.
For a given watcher, the SQL targets can be in any subscription within the same Microsoft Entra ID tenant.
Database watcher price
Database watcher costs are incurred by its individual components, as follows:
| Component | Price | Notes |
|---|---|---|
| Watchers | Free | |
| Dashboards | Free | |
| Azure Data Explorer cluster 1 | Pricing details | The optimal cluster SKU depends on the number of monitoring targets and the query workload running on the cluster. For cluster sizing considerations, see Manage Azure Data Explorer cluster. |
| Real-Time Analytics in Microsoft Fabric | Included in the Power BI Premium workspace consumption model. Billing per use. | Use either Azure Data Explorer or Real-Time Analytics. Only one of these offerings is required. |
| A vault in Azure Key Vault | Pricing details | Required only if the optional SQL authentication is used instead of the default Microsoft Entra authentication. |
| Azure network bandwidth | Pricing details | Cost is not incurred if a watcher, its targets, and its data store are deployed in the same Azure region. |
| Alerts | Pricing details | Database watcher uses Log Alerts. Monthly price is variable and depends on the number of alert rules you create, the number of SQL targets that have generated alerts during the month, and the evaluation frequency of each alert rule. |
1 You can use a free Azure Data Explorer cluster when a service level agreement is not required and when query performance and storage requirements are satisfied by the free cluster capacity specifications. The free cluster trial period is for a year and can be extended automatically.
There is no charge per monitored Azure SQL resource or per user, making database watcher an inexpensive monitoring solution for larger Azure SQL environments and larger teams.
Regional availability
At this time, you can create watchers in the following Azure regions:
- Canada Central
- Canada East
- Central US
- East US
- East US 2
- North Central US
- West US
Tip
A watcher in one Azure region can monitor targets in another region. Similarly, a watcher and its data store can be located in different regions.
When possible, colocate a watcher, its targets, and its data store in the same region. If database watcher is not yet available in your region, choose a region in the same Azure geography. This can reduce Azure network bandwidth costs.
Limits
There is a limit on the number of SQL targets per watcher, and the number of watchers per subscription. Deployments exceeding these limits are not supported.
| Parameter | Limit |
|---|---|
| SQL targets per watcher1 | 100 |
| Watchers per subscription | 20 |
1A high availability replica of a database, elastic pool, or SQL managed instance is monitored independently of its parent replica, and is considered a separate target.
Note
During preview, limits are subject to change.
Dashboards
Database watcher uses Azure Workbooks to provide monitoring dashboards at the estate level and at the resource level.
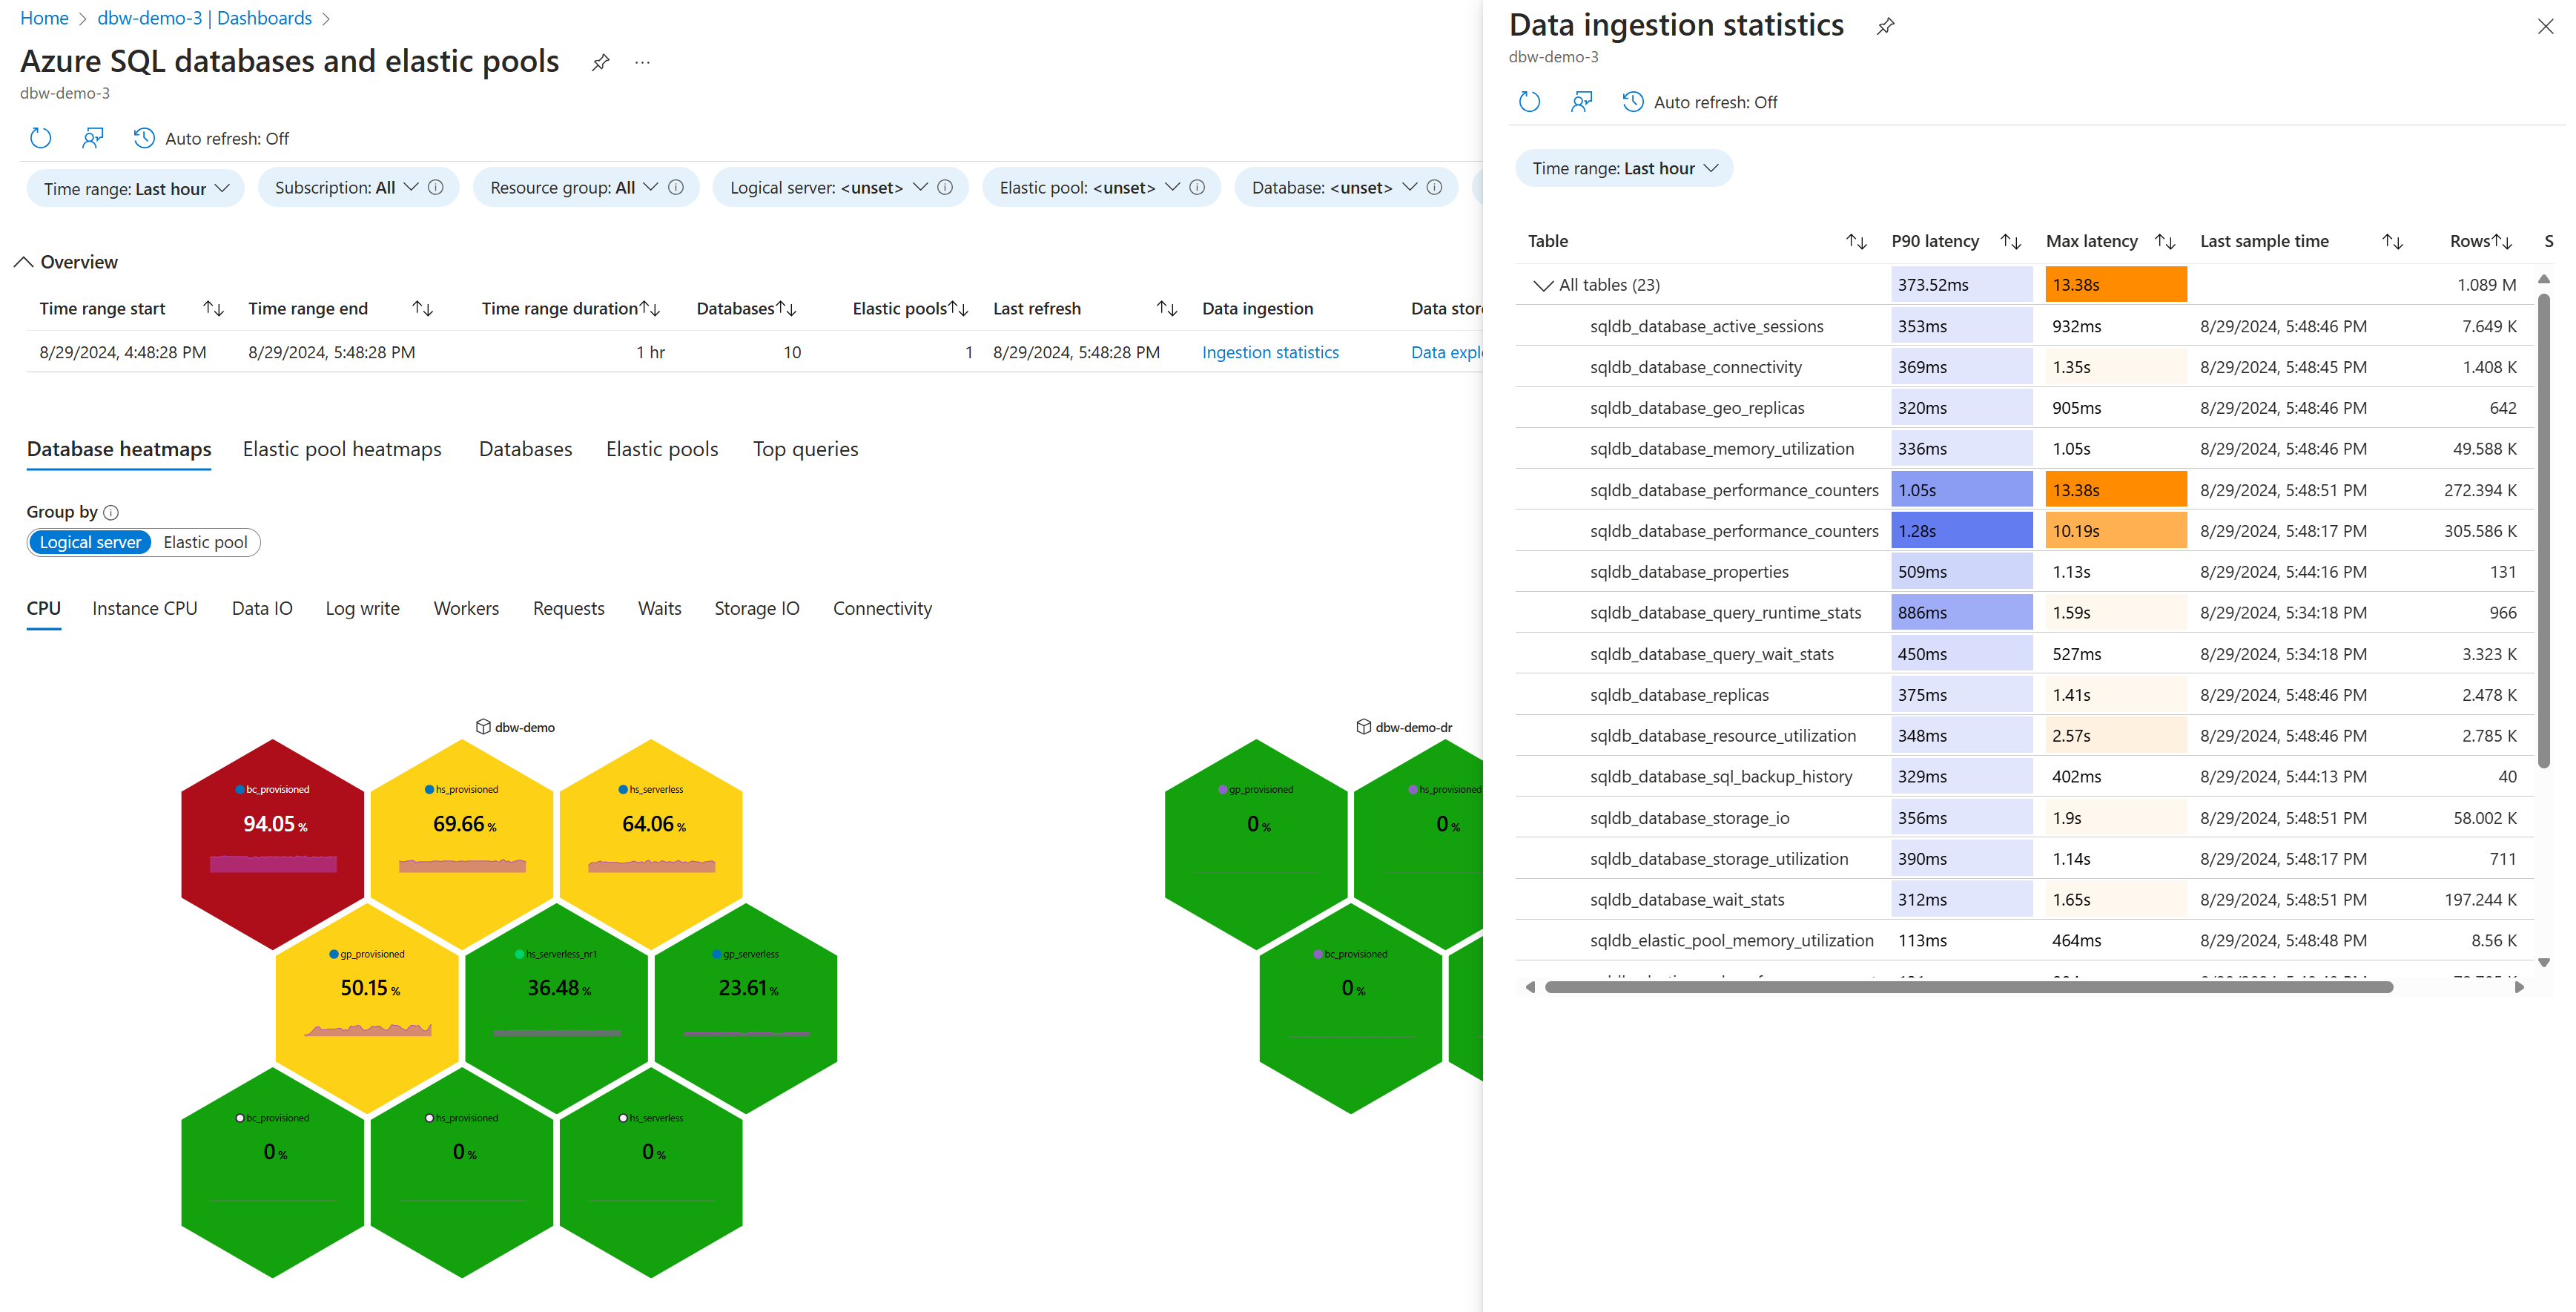
Here is an example of a database CPU utilization heatmap on the estate dashboard. Each hexagon represents a SQL target. There are two logical servers, one with six databases and one with three databases. The high availability secondary replicas are shown on the heatmap as separate targets. Select the image to see additional details, including data ingestion statistics.
Here is an example showing a partial view of the Performance tab of an Azure SQL database dashboard. Select the image to zoom into details.

The following table describes the capabilities of database watcher dashboards in the Azure portal.
| Capability | Description |
|---|---|
| Estate dashboards | Visualize high-level monitoring data for multiple monitored resources in a common view. Use heatmaps to find top resource consuming databases, elastic pools, or SQL managed instances. Use the top queries view to find top resource consuming queries across your Azure SQL estate, ranking queries by CPU, duration, execution count, etc. Use the subscription, resource group, and resource name filters to focus on subsets of your Azure SQL estate. Drill through to detailed dashboards for specific resources. |
| Resource dashboards | Visualize detailed monitoring data for a database, an elastic pool, or a SQL managed instance, including: - Active sessions - Backup history - Common performance counters - Connectivity probes - Database and instance properties and configuration - Geo-replication - Index metadata, usage statistics, warnings, and suggestions - Resource usage - Session and connection statistics - SQL Agent job state and history - Storage consumption and performance - Table metadata - Top queries - Wait statistics Use resource dropdowns to quickly switch from one resource to another. Use the estate link to zoom out to an estate dashboard. |
| Filter by time range | On each dashboard, set the time range to focus on the desired time interval. Use standard or custom time ranges. Narrow down the time range to an interval of interest by "brushing", or dragging the mouse cursor over a chart to select a shorter time range. |
| Historical data | Depending on the dataset, dashboards show either a summary for the selected time interval, or the latest sample collected in the time interval. Toggle between the latest and a historical view to look at data samples earlier in the selected time range. For example, instead of looking at the currently active sessions, review a previous sample of active sessions collected when a spike in resource usage occurred. |
| Secondary replicas | Monitor all types of replicas, including high-availability (HA) secondary replicas on estate dashboards. Toggle between viewing the primary replica and its HA secondary replica on resource dashboards. |
| Download data to Excel | Download data from charts and grids as csv files and open them in Excel for additional analysis. |
| Data refresh | Retrieve the latest data from the monitoring data store when you open a dashboard and as you switch from tab to tab. After a dashboard has been opened for some time, refresh it manually to see the latest data, or enable automatic dashboard refresh. |
| Ad hoc KQL query | Use a link on each dashboard to open the Azure Data Explorer web UI and query your monitoring data with KQL. For more information, see datasets and Use KQL to analyze monitoring data. |
| Descriptions | Toggle the Show descriptions parameter to see descriptions that help you interpret displayed data and include relevant documentation links. |
| Tooltips | Hover over a field to see more details and context for displayed data. |
| Ingestion statistics | Use the Ingestion statistics link to see data ingestion latency and other ingestion statistics per dataset. |
| Dark mode | Switch the Azure portal appearance to use the dark theme to have database watcher dashboards use dark mode. |
Note
During preview, dashboard visualizations and capabilities are subject to change.
SQL monitoring data
Database watcher collects monitoring data from more than 70 SQL catalog views and dynamic management views (DMVs). Data from one or multiple related views is transformed into a dataset. For example, data from sys.dm_exec_sessions, sys.dm_exec_requests, and other views forms the Active sessions dataset. For each dataset, there is a separate table in the Azure Data Explorer or Real-Time Analytics database.
Database watcher has separate dataset groups for databases, elastic pools, and SQL managed instances. There are 10 to 30 datasets in each group, providing a detailed view of database performance, configuration, and health for your Azure SQL resources.
For more information, see Database watcher data collection and datasets.
Alerts
Database watcher provides a set of alert rule templates to let you easily create Azure Monitor alert rules. After an alert rule is created, you can customize it and manage it just like any other alert rule in Azure Monitor. For more information, see Database watcher alerts.
Network connectivity
Database watcher uses a remote data collection agent that connects to targets, data store, and key vault over the network. Depending on your network security requirements and the configuration of your Azure resources, database watcher can use either private or public connectivity. You always fully control network connectivity from database watcher to your Azure resources.
For more information about network connectivity in Azure SQL, see Azure SQL Database connectivity architecture and Azure SQL Managed Instance connectivity architecture.
Private connectivity
To provide private connectivity, database watcher uses Azure Private Link. When you configure a watcher, you can create managed private endpoints to let the watcher connect to databases and elastic pools on logical servers, or to SQL managed instances. You can also create a private endpoint for the Azure Data Explorer cluster, and for the key vault storing SQL authentication credentials. At this time, private connectivity is not available for connections to Real-Time Analytics in Microsoft Fabric.
A resource owner must approve the managed private endpoint for a watcher before the watcher can use it. Conversely, resource owners can delete any private endpoint for a watcher at any time to stop data collection.
Once you create and approve a managed private endpoint for a watcher that targets an Azure resource, all network traffic between the watcher and the resource uses private connectivity, even if public connectivity for the resource remains enabled.
For more information about private endpoints in Azure SQL, see Azure Private Link for Azure SQL Database and Azure Private Link for Azure SQL Managed Instance.
Public connectivity
If private connectivity is not required, database watcher can use public connectivity to connect to Azure resources. To enable a watcher to connect to databases and elastic pools on an Azure SQL Database logical server, public access to the server must be enabled, and the IP-based firewall must allow connections from all Azure services.
To enable a watcher to connect to a SQL managed instance using public connectivity, the instance must have its public endpoint enabled. Additionally, a Network Security Group (NSG) rule that allows inbound traffic on TCP port 3342 to the managed instance subnet must have its source set to AzureCloud. For more information, see Configure public endpoints in Azure SQL Managed Instance.
To enable a watcher to connect to an Azure Data Explorer cluster or a key vault using public connectivity, the cluster or vault must have its network access enabled from all networks.
Data access
Just like network connectivity, you fully control database watcher access to your databases. You grant access by creating dedicated watcher logins on logical servers and SQL managed instances, and then granting specific, limited permissions to collect monitoring data from SQL system views.
Watcher authentication
Database watcher supports Microsoft Entra authentication (previously known as Azure Active Directory authentication). This is the preferred and recommended way for a watcher to authenticate to a SQL target. You create a Microsoft Entra authentication login for the managed identity of the watcher on all logical servers and SQL managed instances that you want to monitor.
Database watcher also supports password-based SQL authentication. You might use SQL authentication if Microsoft Entra authentication is not enabled on your Azure SQL resources. For more information, see Additional configuration to use SQL authentication.
Watcher authorization
To collect monitoring data, a watcher requires specific, limited access to each monitoring target, as described in the following table. These role memberships and permissions give a watcher the necessary access to the system monitoring data, but not to any other data in your databases.
| Azure SQL Database | Azure SQL Managed Instance |
|---|---|
Membership in all of the following server roles: ##MS_ServerPerformanceStateReader####MS_DefinitionReader####MS_DatabaseConnector## |
The following server permissions:CONNECT SQLCONNECT ANY DATABASEVIEW ANY DATABASEVIEW ANY DEFINITIONVIEW SERVER PERFORMANCE STATEThe SELECT permission on the following tables in the msdb database:dbo.backupmediafamilydbo.backupmediasetdbo.backupsetdbo.suspect_pagesdbo.syscategoriesdbo.sysjobactivitydbo.sysjobhistorydbo.sysjobsdbo.sysjobstepsdbo.sysoperatorsdbo.syssessions |
Important
When a watcher connects to an Azure SQL resource, it validates the SQL permissions it holds. If the permissions granted are insufficient, or if unnecessary permissions are granted, the watcher disconnects. This ensures that the watcher can collect system monitoring data, but is not accidentally granted access to any other data in your databases.
When configuring watcher access to a SQL target, always create a dedicated login using provided scripts. Do not add the watcher login or user to any SQL roles or grant any SQL permissions other than the ones listed in the table.
If you deny the required permissions to the login or user for a watcher, or to a role that has a watcher login or user as a member (including the public database role), then the watcher might not collect monitoring data. Depending on which permissions are denied, this might affect some or all datasets.
Conversely, if you grant unnecessary permissions to the login or user for a watcher, or to a role that has the watcher login or user as a member, then the watcher might not collect monitoring data for some or all datasets. Similarly, data might not be collected if you add the watcher login or user to a built-in server or database role.
What's new
This section describes recent database watcher fixes, changes, and improvements.
| Time period | Changes |
|---|---|
| July 2025 | - Fix an issue where database watcher monitoring queries prevented serverless databases, including free offer databases, from pausing. For more information, see Data collection in serverless databases. |
| April 2025 | - Fix a bug where a database watcher deployment via Bicep, an ARM template, Terraform, or REST API would fail if the subscription ID, resource group name, or watcher name deployment parameters used inconsistent casing. - Fix a bug where collection of certain datasets for a SQL database target would stop if the database was restored from backup. - Change to limit data collection in the Table metadata datasets for databases with many tables and for SQL managed instances with many databases to avoid long-running collection queries. - Improve collection query performance for the Session statistics dataset for SQL managed instance targets. |
| February 2025 | - Add support for alerting. For more information, see Database watcher alerts. |
| January 2025 | - Fix to make database watcher deployments via Bicep or ARM templates idempotent. - Fix a bug where SQL Agent job history details on the SQL Managed Instance detailed dashboard weren't displayed. - Fix a bug when filtering data on the Sessions charts on the detailed dashboards would cause KQL query errors. - Fix a bug where storage throughput values on the detailed dashboards were incorrect. - Improve storage utilization charts on the detailed dashboards to include the maximum storage size. - Improve to show the original and compressed size of collected data in the Data store section. - Improve the message shown when a dashboard cannot connect to the data store to include suggestions for common problems. - Add informational messages when there is no data shown on the Top queries dashboards for known reasons. - Add Hyperscale log rate limit information in the Replicas dataset for Azure SQL databases. - Add transaction start time and log bytes used to the Active sessions datasets. |
| November 2024 | - Enable database watcher in the Australia Central, Australia Southeast, Canada East, Central US, Germany West Central, Japan West, Korea Central, and North Central US Azure regions. - Increase the limit on the number of SQL targets per watcher from 50 to 100. |
| October 2024 | - Fix bugs where the Table metadata dataset was not collected if there were any views with invalid table references, or any tables with multiple column check constraints. - Add support for using a user assigned identity as the watcher identity. For more information, see Modify watcher identity. - Automatically grant the watcher access to key vault secrets when adding a SQL target that uses SQL authentication. - Automatically grant the watcher access to an Azure Data Explorer database when adding a data store to an existing watcher. - Add the feedback button on the Overview page and other pages. |
| September 2024 | - Fix a bug where the number of user logical sessions in the Session statistics dataset was always the same as the number of user sessions, even if MARS logical sessions were used. - Fix a bug where elastic pool storage utilization wasn't reported correctly for Hyperscale elastic pools. - Resolve an issue where for certain datasets, the first sample collected after a watcher restart might contain data that has already been collected before restart. - Improve collection query performance to avoid timeouts for the Table metadata dataset. - Improve collection reliability for the Query runtime statistics and Query wait statistics datasets on SQL Managed Instance. - Add failover-related columns to the Database replicas dataset for SQL Managed Instance. - Add index operational statistics columns to the Index metadata datasets. - Add support for selecting multiple Azure SQL databases in the Add SQL target blade. |
| August 2024 | - Enable database watcher in the Central US, East US 2, North Europe, and Sweden Central Azure regions. - Add subscription and resource group filters in estate dashboards. |
| July 2024 | - Fix a bug where the Performance counters datasets were not collected from databases with a case-sensitive catalog collation, or managed instances with a case-sensitive database collation. - Fix a bug where data was not collected if the database name in the SQL metadata had a different case than the database name in the Azure Resource Manager (ARM) metadata. - Fix a bug where the Query runtime statistics and Query wait statistics datasets were not collected in databases with a large volume of new queries and query plans inserted into Query Store tables. - Resolve an issue where the Geo-replicas and Replicas datasets were not collected from Hyperscale databases. - Add the subscription_id and resource_group_name common columns to all datasets. Requires a one-time restart of a watcher.- Add the resource_id common column to all datasets. The data appears for SQL targets added in July 2024 or later. To make data appear for an existing SQL target, remove and re-add the target, and restart the watcher. |
| June 2024 | - Fix a bug where data was not collected from some SQL targets added via Bicep or an ARM template. - Fix a bug where the Backup history dataset was not collected for some Azure SQL databases. - Fix a bug where the replica type of a managed instance was incorrectly determined as Geo-replication forwarder if the instance had a database using Managed Instance link. The same bug caused the Query runtime statistics and Query wait statistics datasets to not be collected in this case. - Fix a bug that caused a Failed to load targets error on the SQL targets blade in the Azure portal if the user did not have access to the subscription of the SQL target, or if the subscription has been deleted. - Fix a bug where the retention and cache period for an Azure Data Explorer database created by default while creating a watcher in the Azure portal was set to unlimited instead of 365 and 31 days respectively. - Fix a bug where certain management operations such as creating or deleting a managed private endpoint were reported as successful in the Azure portal even though they have failed. - Fix a bug where for the SQL database targets, the list of databases in the dropdown was incomplete if the SQL logical server contained more than 1,000 databases. - Fix a bug where selecting an Azure Data Explorer database as the data store would remove the access that a different watcher in the same resource group had on this database. - Enable watcher ARM template export in the Azure portal. - Add a warning during watcher creation if the Microsoft.Network resource provider isn't registered in the subscription selected for the watcher. - Add a detailed error if deleting a watcher or a managed private endpoint fails because there is a delete lock on the resource scope. |
| April 2024 | - Enable database watcher in the Australia East and UK South Azure regions. - Fix a failure adding a managed private endpoint when multiple private endpoints are added quickly for the same watcher. - Fix the Backup history dataset for SQL databases to include full backups. - Improve collection query performance to avoid timeouts for the Index metadata, Query runtime statistics, Query wait statistics, and Table metadata datasets. - Fix a bug where for certain datasets data wasn't collected after a database was restored from a backup. - Fix a bug where the Index metadata dataset wasn't collected when indexes have many key or included columns or when the names of these columns are long. - Add the SOS schedulers dataset. - Add a button to download the selected query plan from the Top queries dashboards. - Add a quickstart sample to create and configure a watcher using Bicep or an ARM template. |
Limitations
This section describes database watcher limitations. Workarounds are provided if available.
| Limitation | Workaround |
|---|---|
| Alerts aren't available when the data store uses Real-Time Analytics in Microsoft Fabric, or a free Azure Data Explorer cluster. | In Real-Time Analytics, you can create Activator alerts for a Real-Time Dashboard. |
| Azure log search alerts on Azure Data Explorer don't support 1-minute alert evaluation frequency. | None at this time. |
| Azure log search alerts on Azure Data Explorer aren't supported when public access to the Azure Data Explorer cluster is disabled. | None at this time. |
| Because of a security restriction in Azure Monitor, you can't modify alert rule queries in the Azure portal if you connect from an IP address associated with a virtual network where private endpoints exist. | You can modify an alert rule using Azure CLI, PowerShell, REST API, or ARM templates. For more information, see Create a new alert rule using the CLI, PowerShell, or an ARM template and Manage alert rules. |
| If using smaller Azure Data Explorer SKUs such as Dev/test or Extra small, some dashboard queries might intermittently fail to execute with an "aborted due to throttling" error. | Reload the dashboard, or scale up the Azure Data Explorer cluster to the next higher SKU. |
| If you create a free Azure Data Explorer cluster from the database watcher UI in Azure portal, you might get a "Could not connect to cluster, 403-Forbidden" error if you try to access the cluster in the Azure Data Explorer web UI. | This issue doesn't occur if you create the free cluster using https://aka.ms/kustofree. If you have already created a free cluster from Azure portal, follow these steps: In the Azure Data Explorer web UI, select your profile name in the main bar to open the account manager, and select Switch directory. Select the directory other than Microsoft Account, and select Switch. You should now see the free Azure Data Explorer cluster you created. Alternatively, you can edit the cluster connection in the Azure Data Explorer web UI using the edit (pencil) button, and similarly switch the directory. |
| If CPU consumption for a database, elastic pool, or a SQL managed instance persists near 100%, remaining CPU resources might be insufficient for database watcher data collection queries, causing gaps in the collected data. | If you observe data gaps that correlate with high CPU utilization in the database, elastic pool, or a SQL managed instance, consider tuning your application workload to reduce CPU consumption, or increase the number of vCores or DTUs to enable reliable monitoring. |
Known issues
During preview, database watcher has the following known issues.
| Issue | Mitigation or workaround |
|---|---|
| If data collection cannot start or continue because of an error (for example, insufficient access to a SQL target or to the data store), the error is not exposed. | To troubleshoot, see Data is not collected. |
| Because of a known issue in Azure SQL Database and Azure SQL Managed Instance, expected data might not be collected from a high availability (HA) readable secondary replica if database replicas change roles, for example after a maintenance event. | Commonly, the issue resolves without any action within one or two days. To resume data collection sooner, restart the watcher. |
| For Azure SQL Managed Instance, data might not be collected from the readable high availability replica or from a geo-replica if you are using SQL authentication. | There are two workarounds: 1. Use the Microsoft Entra ID authentication (preferred). 2. Disable the password policy check. Execute ALTER LOGIN [database-watcher-login-placeholder] WITH CHECK_POLICY = OFF;, replacing database-watcher-login-placeholder with the name of the SQL authentication login of the watcher. Execute this command on the primary replica, and on the geo-replica, if any. |
In Azure SQL Managed Instance, data is not collected if the EXECUTE permission on the sys.xp_msver system stored procedure is revoked or denied to the public role. |
Grant the EXECUTE permission on sys.xp_msver to the watcher login. On every SQL managed instance added as a SQL target, execute USE master; CREATE USER [database-watcher-login-placeholder] FOR LOGIN [database-watcher-login-placeholder]; GRANT EXECUTE ON sys.xp_msver TO [database-watcher-login-placeholder];, replacing database-watcher-login-placeholder with the name of the watcher login. |
| If you create a managed private endpoint for a watcher to connect to a SQL managed instance that is stopped, the provisioning state of the private endpoint is reported as Failed, and the watcher cannot connect to the instance. | Delete the managed private endpoint with the Failed provisioning state and start the SQL managed instance. Once the failed private endpoint is deleted and the instance is running, re-create the managed private endpoint. |
| Data is not collected if you use a database in Real-Time Analytics as the data store, and the OneLake availability option is enabled. | Disable the OneLake availability option and restart the watcher to resume data collection. |
| Because of a known issue in Azure Monitor Alerts, if you edit an alert rule created from a database watcher template, the scope of any fired alert is set to the Azure Data Explorer cluster used as the watcher data store instead of the SQL target that the alert applies to. | Edit the alert rule programmatically, for example using Bicep or an ARM template, and set the resourceIdColumn property to the value resource_id. For more information, see Resource Manager template samples for log search alert rules in Azure Monitor. |
Troubleshoot
This section describes the steps you can take to solve common problems. If the steps in this section don't solve the problem, open a support case.
Data is not collected
If you create a new watcher and do not see monitoring data on dashboards and in the data store, or if you only see older data for an existing watcher, review this section.
On the watcher Overview page, check the Status field to see if the watcher is running. If not, use the Start button on the same page to start data collection. A new watcher is not started automatically.
Check that the watcher has access to the data store.
If you use an Azure Data Explorer database as the data store, check that the Azure Data Explorer cluster is started. For more information, see Stopped Azure Data Explorer clusters.
Check that the watcher has the specific, limited access to SQL targets. Additionally, if using SQL authentication for any targets, check watcher access to key vault, or use the recommended Microsoft Entra authentication instead.
If you want the watcher to use Microsoft Entra authentication to connect to SQL targets, make sure that Microsoft Entra authentication is enabled on the SQL logical servers hosting the database and elastic pool targets, and on the SQL managed instance targets.
If you created any private endpoints for the watcher, make sure that they are approved by the resource owner.
If you are using public connectivity, make sure that the requirements to allow the watcher to connect to targets, data store, and key vault are met.
The Azure Data Explorer cluster or database, or the Real-Time Analytics database might have been deleted after it was selected as the data store for your watcher. Navigate to the cluster and the database, and confirm that they exist.
If you are using the free Azure Data Explorer cluster, make sure that you haven't reached the storage capacity of the cluster. For more information, see Free Azure Data Explorer cluster.
If you make changes to watcher access or connectivity as part of troubleshooting, you might need to stop and restart the watcher for the changes to take effect.
Dashboards are blank
If you select the Dashboards page of a watcher, but do not see a summary of SQL targets on the page, expand the Data store section. If you see a Cannot connect ... error, review this section.
You might not have access to the data store. For more information, see Grant users and groups access to the data store.
You might not have network connectivity to the data store. For example, this happens if connections from your browser to the Azure Data Explorer cluster use public connectivity, but you disable public access to the cluster. In that case, you also cannot connect to the cluster from Kusto Explorer or the Azure Data Explorer web UI.
To resolve this, establish private connectivity from your machine to the Azure Data Explorer cluster as described in Private connectivity to the data store.
To validate that you have access and can connect to the data store, and that the data store database exists, follow these steps:
On the Dashboards page of a watcher, expand the Data store section, and copy the Kusto query URI value. Make sure to copy the entire URI string. Make a note of the Kusto database value as well.
Open the Azure Data Explorer web UI. Sign in if prompted.
Select Add, Connection, and enter the copied URI as the Connection URI.
Select Add to create a new connection.
Once a new connection entry is added, expand it to view the databases.
Select the database referenced as the Kusto database on the Dashboards page of your watcher, and select the + sign on the tab bar to open a new query tab connected to this database.
Run the following KQL command:
.show database principals;Check that a row for a Viewer or a higher privileged role exists for your user account, or for a Microsoft Entra ID group that contains your user account.
Send feedback
The database watcher team at Microsoft is looking forward to your comments and suggestions. You can send product feedback in one of the following ways:
- Post a new idea in the SQL feedback forum. On the Post a new idea page, use SQL as the forum, select the Azure SQL group, and include database watcher in the title. The feedback you submit in the feedback forum is public. Other community members can upvote and comment on your ideas and suggestions. Community votes and comments help the database watcher team plan and prioritize product improvements.
- Use the feedback button on one of database watcher pages in the Azure portal. For example, you can find the feedback button on the watcher Overview page, or on dashboards next to the refresh button. The feedback you send this way is not public. While Microsoft will see your feedback, depending on your preference and the privacy rules in effect, Microsoft might not be able to respond to you regarding this feedback.
For technical support or help solving a problem with database watcher, open a support case.