Note
Access to this page requires authorization. You can try signing in or changing directories.
Access to this page requires authorization. You can try changing directories.
APPLIES TO: SDK v4
Analyzing Bot behavior
The following collection of queries can be used to analyze bot behavior. You can use the collection to author custom queries in Azure Monitor Log Analytics and to create monitoring and Power BI visualization dashboards.
Prerequisites
It's helpful to have a basic understanding of the following concepts:
- Kusto queries
- How to use Log Analytics in the Azure portal to write Azure Monitor log queries
- The basic concepts of Log queries in Azure Monitor
Tip
If your create your bot using tools such as Copilot Studio or Composer, you'll want to use the Adaptive Dialog version of each query when available.
Dashboards
Azure Dashboards offer a great way to view and share the information generated from your queries. You can build custom dashboards to help monitor your bots activity by associating your queries with the tiles that you add to your dashboard. For more information on dashboards and how to associate your queries with them, see Create and share dashboards of Log Analytics data. The remainder of this article shows examples of some of the queries that you may find useful in monitoring your bots behavior.
Example Kusto queries
Note
It's recommended to pivot on different dimensions such as period, channel, and locale for all queries in this article.
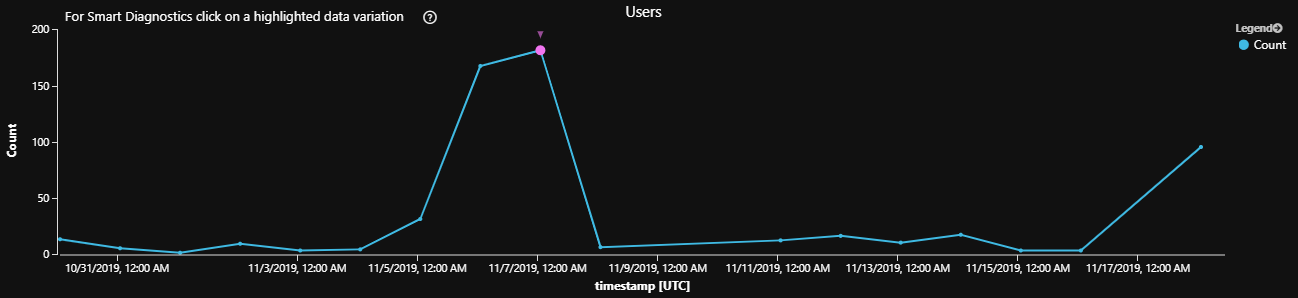
Number of users per period
This example results in a line chart that shows how many distinct users communicated with your bot per day for the past 14 days. The time period can be easily changed by assigning different values to the queryStartDate, queryEndDate and interval variables.
Important
You'll only get a correct count of unique users in this query if they're authenticated users, and the results may also depend on the channel capabilities.
// number of users per period
let queryStartDate = ago(14d);
let queryEndDate = now();
let groupByInterval = 1d;
customEvents
| where timestamp > queryStartDate
| where timestamp < queryEndDate
| summarize uc=dcount(user_Id) by bin(timestamp, groupByInterval)
| render timechart
Tip
The Kusto summarize operator is used to produce a table that aggregates the content of the input table.
The Bin function is a Kusto scalar function that when used in conjunction with the summarize operator will group the query results into the specified value. In the above example, this is grouped by day, Kusto also will accept h=hours, m=minutes, s=seconds, ms=milliseconds, microsecond=microseconds.
The render operator enables you to easily render charts, such as the timechart, a line chart where the x-axis is a datetime and any other numeric column can be used for the y-axis. It automatically keeps the x-axis spaced nicely even if your data doesn't have every time specified. If no render statement is used, it defaults to table.
Sample number-of-users-per-period query results
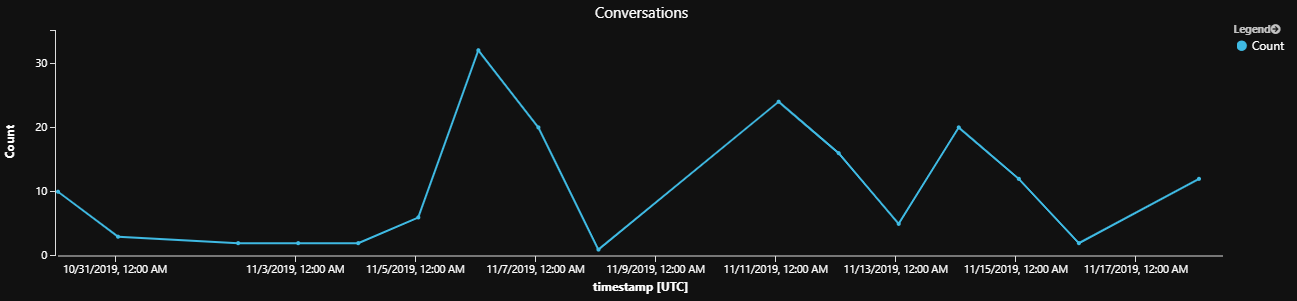
Activity per period
This example illustrates how to measure the volume of activity per desired dimension, such as a count of the number of conversations, dialogs, or messages per day for the past 14 days. The time period can be easily changed by assigning different values to the querystartdate, queryEndDate and interval variables. The desired dimension is defined by the extend clause in the following example, metric can be set to either InstanceId, DialogId or activityId.
Assign metric to the dimension that you want to display:
- InstanceId measures the number of Conversations
- DialogId measures the number of Dialogs
- ActivityId measures the number of Messages
// Measures the number of activity's (conversations, dialogs, messages) per period.
let queryStartDate = ago(14d);
let queryEndDate = now();
let groupByInterval = 1d;
customEvents
| where timestamp > queryStartDate
| where timestamp < queryEndDate
| extend InstanceId = tostring(customDimensions['InstanceId'])
| extend DialogId = tostring(customDimensions['DialogId'])
| extend ActivityId = tostring(customDimensions['activityId'])
| where DialogId != '' and  InstanceId != '' and user_Id != ''
| extend metric = InstanceId // DialogId or ActivityId
| summarize Count=dcount(metric) by  bin(timestamp, groupByInterval)
| order by Count desc nulls last
| render timechart
Tip
The Kusto extend operator is used to create calculated columns and append them to the result set.
Sample activity-per-period query results
Activity per user per period
This example demonstrates how to count the number of activities per user per period. This query drills down into the activity per period query to focus on the activity per user per period. The activities include dialogs, conversations or messages. This query measures user interaction with your bot, which can help find potential problems, such as:
- Days with a lot of activity by a single user may mean an attack or test
- Days with little interaction may indicate service health issues
Tip
You can remove by user_Id to get the general bot activity volume which can be pivoted on time and dialogs, messages, or conversations.
// number of users per period per dialogs
let queryStartDate = ago(14d);
let queryEndDate = now();
let interval = 6h;
customEvents
| where timestamp > queryStartDate
| where timestamp < queryEndDate
| extend InstanceId = tostring(customDimensions['InstanceId'])
| extend DialogId = tostring(customDimensions['DialogId'])
| extend ActivityId = tostring(customDimensions['activityId'])
| where DialogId != '' and InstanceId != '' and user_Id != ''
| extend metric = ActivityId // InstanceId // DialogId // or InstanceId for conversation count
| summarize Count=dcount(metric) by user_Id, bin(timestamp, groupByInterval)
| order by Count desc nulls last
Sample activity-per-user-per-period query results
| user_Id | timestamp | Count |
|---|---|---|
| User-8107ffd2 | 2019-09-03T00:00:00Z | 14 |
| User-75f2cc8f | 2019-08-30T00:00:00Z | 13 |
| User-75f2cc8d | 2019-09-03T00:00:00Z | 13 |
| User-3060aada | 2019-09-03T00:00:00Z | 10 |
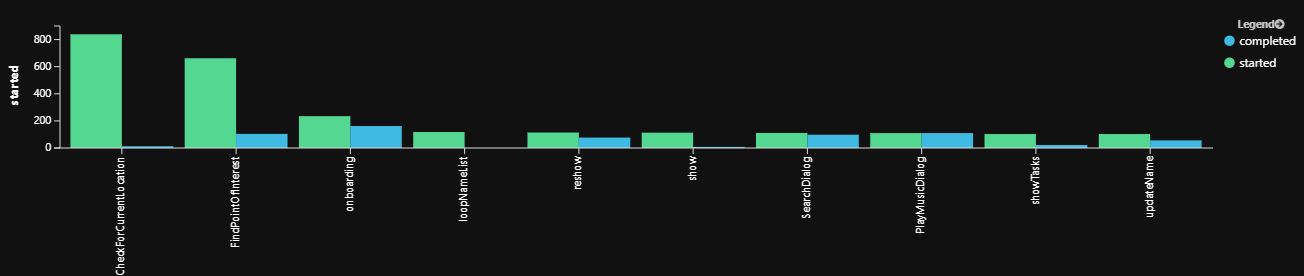
Dialog completion
Once you set the telemetry client for a dialog, the dialog (and its children) will emit some default telemetry data, such as started and completed. This example can be used to measure the completed dialogs relative to started dialogs. If the number of dialogs started is greater than the number completed, some of your users aren't completing the dialog flow. You can use this query to help you identify and troubleshoot any potential dialog logic. It can also be used to identify which dialogs are most and least frequently used.
Tip
If your create your bot using tools such as Copilot Studio or Composer, you'll want to use the adaptive dialog version of each query.
Waterfall dialog completion
// % Completed Waterfall Dialog: shows completes relative to starts
let queryStartDate = ago(14d);
let queryEndDate = now();
customEvents
| where timestamp > queryStartDate
| where timestamp < queryEndDate
| where name=="WaterfallStart"
| extend DialogId = customDimensions['DialogId']
| extend InstanceId = tostring(customDimensions['InstanceId'])
| join kind=leftouter (
    customEvents
    | where name=="WaterfallComplete"
    | extend InstanceId = tostring(customDimensions['InstanceId'])
  ) on InstanceId
| summarize started=countif(name=='WaterfallStart'), completed=countif(name1=='WaterfallComplete') by tostring(DialogId)
| where started > 100  // filter for sample
// Show starts vs. completes
| project tostring(DialogId), started, completed
| order by started desc, completed asc  nulls last
| render barchart  with (kind=unstacked, xcolumn=DialogId, ycolumns=completed, started, ysplit=axes)
Tip
The Kusto join operator is used to merge the rows of two tables to form a new table by matching values of the specified column(s) from each table.
The project operator is used to select the fields that you want to show up in your output. Similar to the extend operator that adds a new field, the project operator can either choose from the existing set of fields or add a new field.
Adaptive dialogs started and completed
// % Completed adaptive dialog: shows completes relative to starts. This type is the default dialog type when using Copilot Studio or Composer.
customEvents
| where name=="AdaptiveDialogStart" or name == "AdaptiveDialogComplete"
| extend DialogId = tostring(customDimensions['DialogId'])
| summarize started=countif(name=='AdaptiveDialogStart'), completed=countif(name=='AdaptiveDialogComplete') by DialogId
| project DialogId, started, completed
| order by started desc, completed asc nulls last
| render barchart with (kind=unstacked, xcolumn=DialogId, ycolumns=completed, started, ysplit=axes)
Sample dialog-completion query results
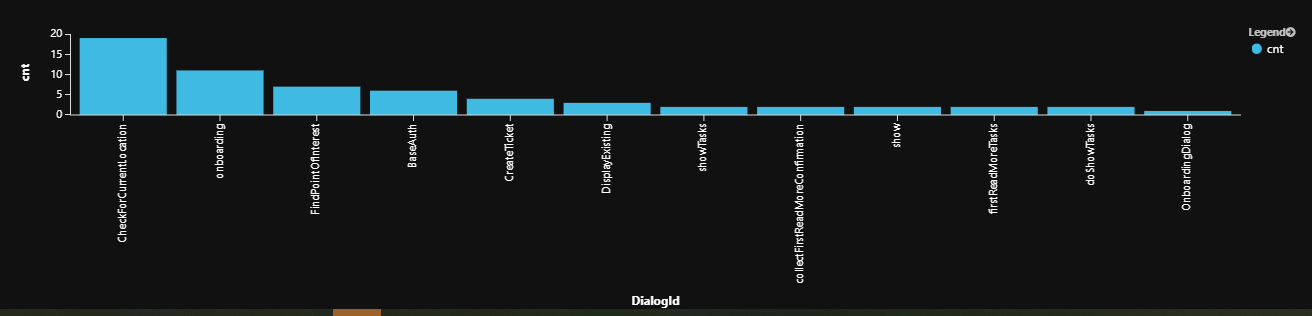
Dialog incompletion
This example can be used to count the number of dialog flows that started but never completed due to cancellation or abandonment during the specified time period. You can use it to review incomplete dialogs and examine whether they were actively canceled due to user confusion or abandoned due to user distraction or loss of interest.
Waterfall dialogs not completed
// Show incomplete dialogs when using waterfall dialogs.
let queryStartDate = ago(14d);
let queryEndDate = now();
customEvents
| where timestamp > queryStartDate
| where timestamp < queryEndDate
| where name == "WaterfallStart"
| extend DialogId = customDimensions['DialogId']
| extend instanceId = tostring(customDimensions['InstanceId'])
| join kind=leftanti (
  customEvents
  | where name == "WaterfallComplete"
  | extend instanceId = tostring(customDimensions['InstanceId'])
  ) on instanceId
| summarize cnt=count() by  tostring(DialogId)
| order by cnt
| render barchart
Adaptive dialogs not completed
// Show incomplete dialogs for adaptive dialogs; this type is the default dialog type when using Copilot Studio or Composer.
let queryStartDate = ago(14d);
let queryEndDate = now();
customEvents
| where name == "AdaptiveDialogStart"
| extend DialogId = tostring(customDimensions['DialogId'])
| join kind=rightanti (
customEvents
| where name == "AdaptiveDialogComplete"
| extend DialogId = tostring(customDimensions['DialogId'])
) on name, DialogId
| summarize cnt=count() by DialogId
| order by cnt
| render barchart
Tip
The Kusto order operator (Same as the sort operator) is used to sort the rows of the input table into order by one or more columns. Note: If you want to exclude null values from the results of any query, you can filter them out in your where statement, for example you could add "and isnotnull(Timestamp)", or to return null values at the beginning or end, add the nulls first or nulls first to the end of the order statement.
Sample dialog-incompletion query results
Dialog Sequence Drill Down
Waterfall start/step/complete for dialog in conversation
This example shows the sequence of dialog steps, grouped by conversation (instanceId), which can be useful in determining which steps lead to dialog interruption.
The run this query, enter the value of the desired DialogId in place of <SampleDialogId>
// Drill down: Show waterfall start/step/complete for specific dialog
let queryStartDate = ago(14d);
let queryEndDate = now();
let DialogActivity=(dlgid:string) {
customEvents
| where timestamp > queryStartDate
| where timestamp < queryEndDate
| extend DialogId = customDimensions['DialogId']
| extend StepName = customDimensions['StepName']
| extend InstanceId = customDimensions['InstanceId']
| where DialogId == dlgid
| project timestamp, name, StepName, InstanceId
| order by tostring(InstanceId), timestamp asc
};
// For example see SampleDialogId behavior
DialogActivity("<SampleDialogId>")
Tip
This query was written using a query-defined function, which is a user-defined function that is defined and used within the scope of a single query, and is defined through a let statement. This query written without the use of the query-defined function:
let queryStartDate = ago(14d);
let queryEndDate = now();
customEvents
| where timestamp > queryStartDate
| where timestamp < queryEndDate
| extend DialogId = customDimensions['DialogId']
| extend StepName = customDimensions['StepName']
| extend InstanceId = customDimensions['InstanceId']
| where DialogId == "<SampleDialogId>"
| project timestamp, name, StepName, InstanceId
| order by tostring(InstanceId), timestamp asc
Sample query results
| timestamp | name | StepName | InstanceId |
|---|---|---|---|
| 2019-08-23T20:04... | WaterfallStart | null | ...79c0f03d8701 |
| 2019-08-23T20:04... | WaterfallStep | GetPointOfInterestLocations | ...79c0f03d8701 |
| 2019-08-23T20:04... | WaterfallStep | ProcessPointOfInterestSelection | ...79c0f03d8701 |
| 2019-08-23T20:04... | WaterfallStep | GetRoutesToDestination | ...79c0f03d8701 |
| 2019-08-23T20:05... | WaterfallStep | ResponseToStartRoutePrompt | ...79c0f03d8701 |
| 2019-08-23T20:05... | WaterfallComplete 1 | null | ...79c0f03d8701 |
| 2019-08-28T23:35... | WaterfallStart | null | ...6ac8b3211b99 |
| 2019-08-28T23:35... | WaterfallStep 2 | GetPointOfInterestLocations | ...6ac8b3211b99 |
| 2019-08-28T19:41... | WaterfallStart | null | ...8137d76a5cbb |
| 2019-08-28T19:41... | WaterfallStep 2 | GetPointOfInterestLocations | ...8137d76a5cbb |
| 2019-08-28T19:41... | WaterfallStart | null | ...8137d76a5cbb |
1 Completed
2 Abandoned
Interpretation: Users seem to abandon the conversation at the GetPointOfInterestLocations step.
Note
Waterfall dialogs execute a sequence (start, multiple steps, complete). If a sequence shows start with no complete, it means the dialog was interrupted either due to user abandoning or canceling the dialog. In this detailed analysis, one can see this behavior (see completed versus abandoned steps).
Waterfall start/step/complete/cancel steps aggregate totals
This example shows the aggregate totals of the total number of times that a dialog sequence was started, the combined total number of waterfall steps, how many were successfully completed, how many were canceled and the difference between WaterfallStart and the combined total of WaterfallComplete plus WaterfallCancel will give you the total number abandoned.
// Drill down: Aggregate view of waterfall start/step/complete/cancel steps totals for specific dialog
let queryStartDate = ago(14d);
let queryEndDate = now();
let DialogSteps=(dlgid:string) {
customEvents
| where timestamp > queryStartDate
| where timestamp < queryEndDate
| extend DialogId = customDimensions['DialogId']
| where DialogId == dlgid
| project name
| summarize count() by name
};
// For example see SampleDialogId behavior
DialogSteps("<SampleDialogId>")
Sample waterfall-aggregate query results
| name | count |
|---|---|
| WaterfallStart | 21 |
| WaterfallStep | 47 |
| WaterfallComplete | 11 |
| WaterfallCancel | 1 |
Interpretation: Of 21 invocations of dialog sequence, only 11 has completed, 9 were abandoned, and one was canceled by the user.
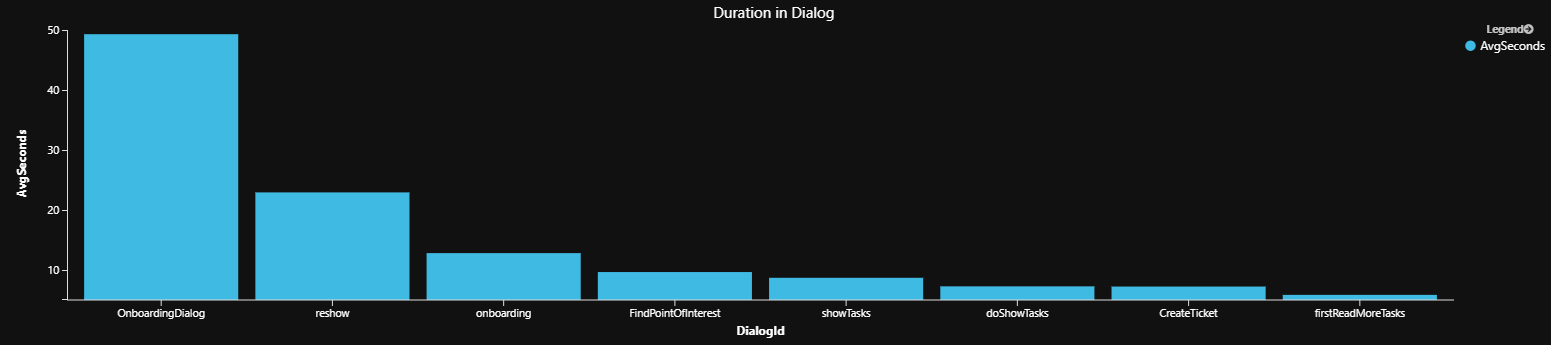
Average duration in dialog
This example measures the average amount of time users spend in a given dialog. Your bot might benefit from simplifying dialogs that take a user a long time to complete.
// Average dialog duration
let queryStartDate = ago(14d);
let queryEndDate = now();
customEvents
| where timestamp > queryStartDate
| where timestamp < queryEndDate
| where name=="WaterfallStart"
| extend DialogId = customDimensions['DialogId']
| extend instanceId = tostring(customDimensions['InstanceId'])
| join kind=leftouter (customEvents | where name=="WaterfallCancel" | extend instanceId = tostring(customDimensions['InstanceId'])) on instanceId
| join kind=leftouter (customEvents | where name=="WaterfallComplete" | extend instanceId = tostring(customDimensions['InstanceId'])) on instanceId
| extend duration = case(not(isnull(timestamp1)), timestamp1 - timestamp,
not(isnull(timestamp2)), timestamp2 - timestamp, 0s) // Abandoned aren't counted. Alternate: now()-timestamp
| extend seconds = round(duration / 1s)
| summarize AvgSeconds=avg(seconds) by tostring(DialogId)
| order by AvgSeconds desc nulls last
| render barchart with (title="Duration in Dialog")
Sample average-duration query results
Average steps in dialog
This example shows each invoked dialog's "length" as calculated by average, min, max and standard deviation. This can help analyze dialog quality. For example:
- Dialogs with too many steps should be evaluated for simplification opportunities.
- Dialogs with a wide gap between min/max/average could mean that users get stalled trying to complete the tasks. You may need to evaluate the possibility of there being shorter paths to complete the tasks, or ways to reduce the dialog complexity.
- Dialogs with a large standard-deviation suggest complex paths or broken experience (abandon/cancel).
- Dialogs with few steps may be so because they were never completed. Analyzing the completion/abandonment rates may help to make that determination.
// min/max/std/avg steps per dialog
let queryStartDate = ago(14d);
let queryEndDate = now();
customEvents
| where timestamp > queryStartDate
| where timestamp < queryEndDate
| extend DialogId = tostring(customDimensions['DialogId'])
| extend StepName = tostring(customDimensions['StepName'])
| extend InstanceId = tostring(customDimensions['InstanceId'])
| where name == "WaterfallStart" or  name == "WaterfallStep" or  name == "WaterfallComplete"
| order by InstanceId, timestamp asc
| project timestamp, DialogId, name, InstanceId, StepName
| summarize cnt=count() by InstanceId, DialogId
| summarize avg=avg(cnt), minsteps=min(cnt),maxsteps=max(cnt), std=stdev(cnt) by DialogId
| extend avgsteps = round(avg, 1)
| extend avgshortbysteps=maxsteps-avgsteps
| extend avgshortbypercent=round((1.0 - avgsteps/maxsteps)*100.0, 1)
| project DialogId, avgsteps, minsteps, maxsteps, std, avgshortbysteps, avgshortbypercent
| order by std desc nulls last
Sample average-steps query results
| Dialog ID | avg steps | min steps | max steps | std | avg short by steps | avg short by percent |
|---|---|---|---|---|---|---|
| FindArticlesDialog | 6.2 | 2 | 7 | 2.04 | 0.8 | 11.4% |
| CreateTicket | 4.3 | 2 | 5 | 1.5 | 0.7 | 14% |
| CheckForCurrentLocation | 3.9 | 2 | 5 | 1.41 | 1.1 | 22% |
| BaseAuth | 3.3 | 2 | 4 | 1.03 | 0.7 | 17.5% |
| onboarding | 2.7 | 2 | 4 | 0.94 | 1.3 | 32.5% |
__Interpretation: For example, FindArticlesDialog has a wide spread between min/max and should be investigated and possibly redesigned & optimized.
Channel activity by activity metric
This example measures the amount of activity your bot receives per channel in the given period. It does this by counting any one of the following metrics: incoming messages, users, conversations or dialogs. This can be useful for service health analysis or to measure a channels popularity.
// number of metric: messages, users, conversations, dialogs by channel
let queryStartDate = ago(14d);
let queryEndDate = now();
let groupByInterval = 1d;
customEvents
| where timestamp > queryStartDate
| where timestamp < queryEndDate
| extend InstanceId = tostring(customDimensions['InstanceId'])
| extend DialogId = tostring(customDimensions['DialogId'])
| extend ActivityId = tostring(customDimensions['activityId'])
| extend ChannelId = tostring(customDimensions['channelId'])
| where DialogId != '' and  InstanceId != '' and user_Id != ''
| extend metric = user_Id // InstanceId or ActivityId or user_Id
| summarize Count=count(metric) by  ChannelId, bin(timestamp, groupByInterval)
| order by Count desc nulls last
| render barchart with (title="Users", kind=stacked) // or Incoming Messages or Conversations or Users
Tip
You may want to consider trying these variations:
- Run the query without the timestamp bucketing:
bin(timestamp, groupByInterval). - You can also use
dcountfor distinct users andcountfor all user event activities. This also works for repeat users.
Sample channel-activity-by-activity query results
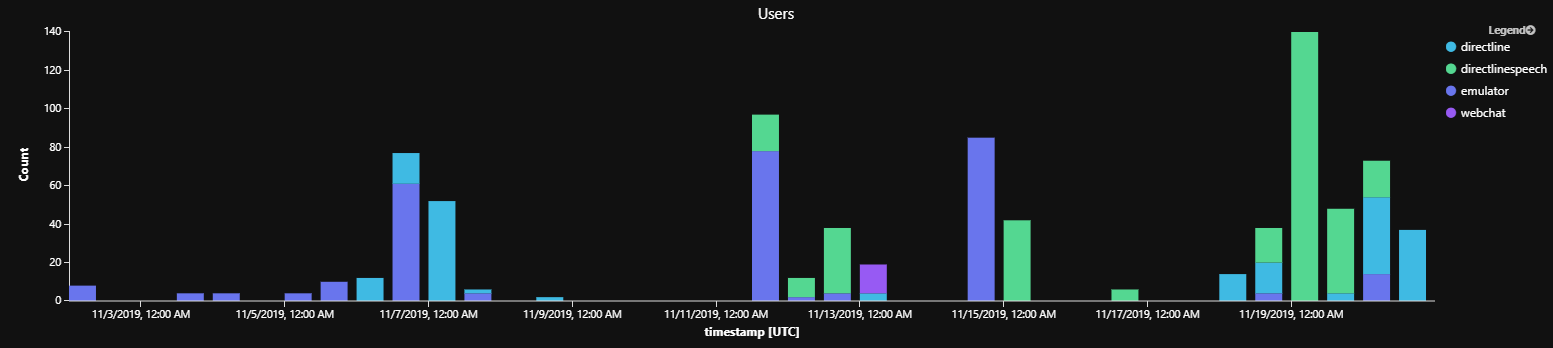
Interpretation: Emulator testing used to be most popular but once we went live, DirectLineSpeech, is the most popular channel.
Total Intents by popularity
This example applies to LUIS enabled bots. It shows a summary of all intents by popularity, and corresponding intent detection certainty score.
Note
Language Understanding (LUIS) will be retired on 1 October 2025. Beginning 1 April 2023, you won't be able to create new LUIS resources. A newer version of language understanding is now available as part of Azure AI Language.
Conversational language understanding (CLU), a feature of Azure AI Language, is the updated version of LUIS. For more information about language understanding support in the Bot Framework SDK, see Natural language understanding.
- In practice, the view should be separated for each metric.
- Popular intent paths should be optimized for user experience.
- Low average scores indicate poor recognition & possible missing actual user intent.
// show total intents
let queryStartDate = ago(14d);
let queryEndDate = now();
customEvents
| where timestamp > queryStartDate
| where timestamp < queryEndDate
| where name startswith "LuisResult"
| extend intentName = tostring(customDimensions['intent'])
| extend intentScore = todouble(customDimensions['intentScore'])
| summarize ic=count(), ac=avg(intentScore)*100 by intentName
| project intentName, ic, ac
| order by ic desc nulls last
| render barchart with (kind=unstacked, xcolumn=intentName, ycolumns=ic,ac, title="Intents Popularity")
Sample intents-by-popularity query results
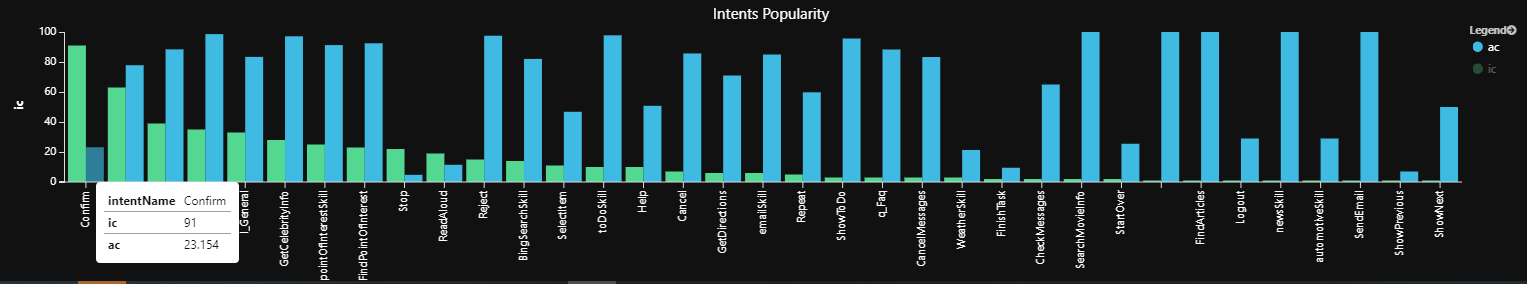
Interpretation: For example the most popular intent, confirm is detected only with 23% confidence on average.
Tip
Barcharts are one of over a dozen options available with Kusto queries. Some other options include: anomalychart, areachart, columnchart, linechart, scatterchart. For more information, see the render operator topic.
Schema of Bot Analytics Instrumentation
The following tables show the most common fields that your bot will log telemetry data into.
General Envelope
Common log analytics fields in Application Insights instrumentation.
| Field | Description | Sample Values |
|---|---|---|
| name | Message type | BotMessageSend, BotMessageReceived, LuisResult, WaterfallStep, WaterfallStart, SkillWebSocketProcessRequestLatency, SkillWebSocketOpenCloseLatency, WaterfallComplete, QnaMessage, WaterfallCancel, SkillWebSocketTurnLatency, AuthPromptValidatorAsyncFailure |
| customDimensions | SDK Bot Analytics | activityId=<id>, activityType=message, channelId=emulator, fromId=<id>, fromName=User, locale=en-us, recipientId=<id>, recipientName=Bot, text=find a coffee shop |
| timestamp | Time of event | 2019-09-05T18:32:45.287082Z |
| instance_Id | Conversation ID | f7b2c416-a680-4b2c-b4cc-79c0f03d8711 |
| operation_Id | Turn ID | 084b2856947e3844a5a18a8476d99aaa |
| user_Id | Unique channel user ID | emulator7c259c8e-2f47... |
| client_IP | Client ip address | 127.0.0.1 (may be absent due to privacy block) |
| client_City | Client city | Redmond (if detected, may be absent) |
Note
Azure AI QnA Maker will be retired on 31 March 2025. Beginning 1 October 2022, you won't be able to create new QnA Maker resources or knowledge bases. A newer version of the question and answering capability is now available as part of Azure AI Language.
Custom question answering, a feature of Azure AI Language, is the updated version of the QnA Maker service. For more information about question-and-answer support in the Bot Framework SDK, see Natural language understanding.
Note
Language Understanding (LUIS) will be retired on 1 October 2025. Beginning 1 April 2023, you won't be able to create new LUIS resources. A newer version of language understanding is now available as part of Azure AI Language.
Conversational language understanding (CLU), a feature of Azure AI Language, is the updated version of LUIS. For more information about language understanding support in the Bot Framework SDK, see Natural language understanding.
Custom Dimensions
Most of bot specific activity data is stored in customDimensions field.
| Field | Description | Sample Values |
|---|---|---|
| activityId | Message ID | <id>: 8da6d750-d00b-11e9-80e0-c14234b3bc2a |
| activityType | Type of message | message, conversationUpdate, event, invoke |
| channelId | Channel identifier | emulator, directline, msteams, webchat |
| fromId | From Identifier | <id> |
| fromName | Username from client | John Bonham, Keith Moon, Steve Smith, Steve Gadd |
| locale | Client origin locale | en-us, zh-cn, en-GB, de-de, zh-CN |
| recipientId | Recipient identifier | <id> |
| recipientName | Recipient name | John Bonham, Keith Moon, Steve Smith, Steve Gadd |
| text | Text in message | find a coffee shop |
Custom Dimensions: LUIS
Note
Language Understanding (LUIS) will be retired on 1 October 2025. Beginning 1 April 2023, you won't be able to create new LUIS resources. A newer version of language understanding is now available as part of Azure AI Language.
Conversational language understanding (CLU), a feature of Azure AI Language, is the updated version of LUIS. For more information about language understanding support in the Bot Framework SDK, see Natural language understanding.
LUIS instrumentation stores its data in the following Custom Dimensions fields.
| Field | Description | Sample Values |
|---|---|---|
| intent | LUIS detected intent | pointOfInterestSkill |
| intentScore | LUIS recognition score | 0.98 |
| Entities | LUIS detected entities | FoodOfGrocery = [["coffee"]], KEYWORD= ["coffee shop"] |
| Question | LUIS detected question | find a coffee shop |
| sentimentLabel | LUIS detected sentiment | positive |
Custom Dimensions: QnAMaker
Note
Azure AI QnA Maker will be retired on 31 March 2025. Beginning 1 October 2022, you won't be able to create new QnA Maker resources or knowledge bases. A newer version of the question and answering capability is now available as part of Azure AI Language.
Custom question answering, a feature of Azure AI Language, is the updated version of the QnA Maker service. For more information about question-and-answer support in the Bot Framework SDK, see Natural language understanding.
QnAMaker instrumentation stores its data in the following Custom Dimensions fields.
Tip
To enable logging of personal information like questions and answers, the log personal information parameter should be set to true in the constructor of the QnA Maker class.
| Field | Description | Sample Values |
|---|---|---|
| question | QnA detected question | what can you do? |
| answer | QnA answer | You have questions, I may have answers. |
| articleFound | QnA | true |
| questionId | QnA question ID | 488 |
| knowledgeBaseId | QnA KB ID | 2a4936f3-b2c8-44ff-b21f-67bc413b9727 |
| matchedQuestion | Array of matched questions | ["Can you explain to me what your role is?","Can you tell me a bit about yourself?","Can you tell me about you?","could you help me","hmmm so what can you do?","how can you help me","How can you help me?","How can you help?","so how can i use you in my projects?","Talk to me about your capability","What are you capable of?", ...] |
See Also
- For a tutorial on writing log queries, see Get started with log queries in Azure Monitor
- Visualizing data from Azure Monitor
- Learn how to Add telemetry to your bot
- Learn more about Azure Monitor log queries
- Complete listing of Bot Framework Application Insights Events
- Create and share dashboards of Log Analytics data