Note
Access to this page requires authorization. You can try signing in or changing directories.
Access to this page requires authorization. You can try changing directories.
Important
This feature is currently in preview and is provided without a service-level agreement. At this time, previews aren't recommended for production workloads. Certain features of this preview aren't supported or might have capability constraints. For more information, see supplemental terms of use for Microsoft Azure previews.
The Azure Cosmos DB account dashboard brings account health, monitoring, resource inventory, and diagnostic guidance into Visual Studio Code. The extension labels this experience Account Overview (Preview). Use it to identify resources that need attention and decide what to investigate without leaving your editor.
Viewing the dashboard doesn't change your Azure resources. Resource creation and deletion are separate actions that use the extension's existing wizards and confirmations.
What the dashboard provides
The dashboard has three tabs:
| Tab | What you can inspect |
|---|---|
| Monitoring | Request activity, request unit (RU) usage, storage, server-side latency, availability, and other account metrics. |
| Databases and Containers | Container inventory, throughput and storage observations, throttling assessments, and physical-partition distribution. |
| Advisories | Diagnostic findings derived by the extension, Azure Advisor recommendations, and Azure Monitor alerts. |
The account header stays visible across the tabs. Expand Account details to inspect provisioning status, capacity mode, and account properties. The account actions also provide access to cost analysis, resource JSON, and database or container creation.
Prerequisites
Before you start, you need:
- Visual Studio Code and an Azure Cosmos DB extension version that includes Account Overview (Preview).
- An Azure Cosmos DB account that uses the NoSQL API.
- An Azure identity signed in to the extension, with permission to read the account and the monitoring sources you want to inspect.
If the preview isn't available in your installed extension, check the extension's details page for Switch to Pre-Release Version.
Permissions and diagnostic logs
The dashboard uses your signed-in Azure identity. Different sources have separate access requirements:
| Source | Typical read access |
|---|---|
| Account properties, databases, containers, and throughput configuration | Reader on the account or a containing scope. |
| Azure Monitor metrics and alerts | Monitoring Reader at the relevant scope. |
| Azure Advisor recommendations | Reader on the subscription. |
| Log-based diagnostic findings | Log Analytics Reader or equivalent permission to query the relevant logs. |
Equivalent custom-role permissions can also provide access. Creating or deleting resources requires additional write permissions; dashboard read access doesn't grant those permissions.
Some derived advisories require DataPlaneRequests and QueryRuntimeStatistics diagnostic logs sent to Log Analytics in resource-specific mode. These checks don't use legacy AzureDiagnostics tables. Configure Azure Cosmos DB resource logs and log-query access if you need these findings.
Open the dashboard
Sign in and browse your accounts in the Azure resources explorer.
Open the context menu for your Azure Cosmos DB account.
Select Account Overview (Preview) > Overview.
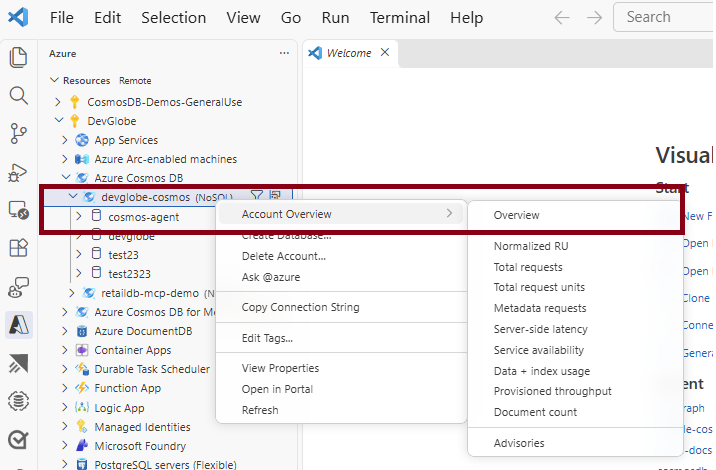
Wait for the dashboard sections to load.
Alternatively, open the Command Palette, run Cosmos DB: Open Account Overview, and select an Azure Cosmos DB account. You don't need to select a database or container.
Inspect account health
Start with the Health badge beside the account name. Focus on or hover over the badge to see which checks completed, found a problem, or couldn't be assessed.
| Health | Meaning |
|---|---|
| Critical | A known critical signal exists, such as failed or canceled provisioning, sustained account-wide throttling, or an active Sev0 or Sev1 alert. |
| Needs Attention | A signal needs investigation, such as provisioning in progress, an active Sev2 or Sev3 alert, a high-impact Performance or Cost recommendation from Azure Advisor, or a critical container. |
| Healthy | Available account request observations support a healthy result, and no available contributing signal raises the severity. Some checks can still be incomplete. |
| Unknown | The dashboard doesn't have enough evidence to establish a healthy result, and no known problem takes precedence. |
This badge is an extension diagnostic summary, not Azure Resource Health or an availability guarantee. It doesn't evaluate every possible issue, including HTTP 5xx responses, latency, or index health. Review the charts and unassessed checks even when the badge shows Healthy.
The account-wide throttling check uses the last hour in one-minute buckets. It identifies sustained throttling when more than 1% of requests receive HTTP 429 responses for at least five minutes. Changing the selected database or chart period doesn't change this account-wide check.
Status in Account details describes provisioning, not workload health. Online means provisioning succeeded.
Explore monitoring metrics
- Select Monitoring.
- Choose 1 hour, 24 hours, or 7 days.
- Choose All databases or an individual database.
- Select a metric tile to display its chart.
- Inspect chart values and any shaded throttling periods.
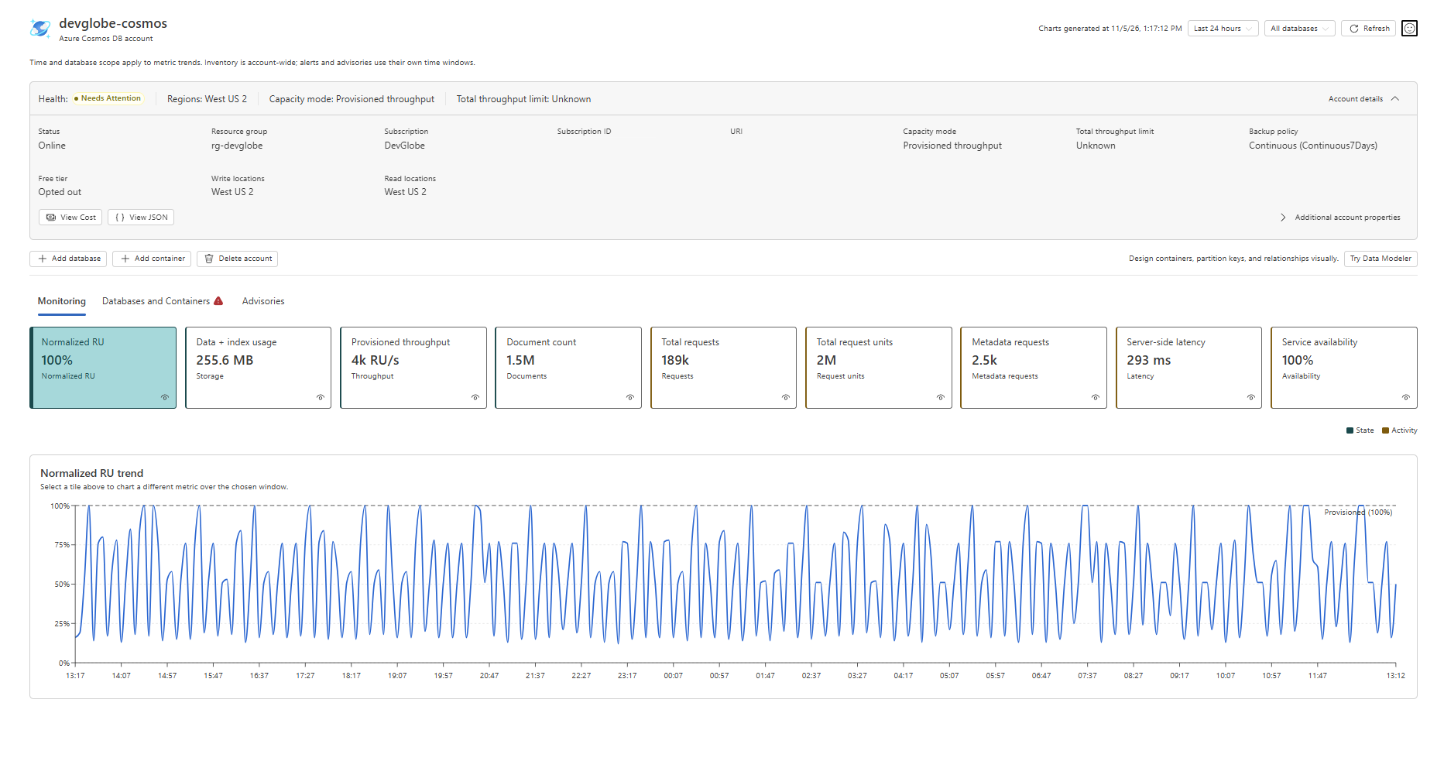
Interpret the metric tiles according to what they measure:
| Metric | Tile value |
|---|---|
| Normalized RU | Highest observed throughput utilization in the selected period, as a percentage of provisioned capacity. |
| Total requests | Total observed requests in the period. |
| Total request units | Total observed RU consumed, not RU/s or configured throughput. |
| Metadata requests | Observed metadata and control-plane requests, separate from Total requests. |
| Server-side latency | Highest observed bucket-average latency across Direct and Gateway measurements, not client round-trip or p99 latency. |
| Service availability | Latest available account-level reading, even when a database is selected. |
| Data + index usage | Storage in the newest observed chart bucket. A partial reading isn't a complete storage total. |
| Provisioned throughput | Latest observed provisioned RU/s, not the account's total throughput limit. |
| Document count | Latest combined observations from containers that reported data, not a live document count. |
On serverless accounts, Normalized RU and Provisioned throughput don't appear. Use request counts, consumed RU, and storage instead.
Missing readings aren't measured zeros. A dash, No data, Partial data, or an access error requires a different interpretation from an observed numeric 0. Azure Monitor ingestion delays and different observation windows can also explain differences between the dashboard and the Azure portal.
Investigate containers and physical partitions
- Select Databases and Containers.
- Search, filter, or sort the container inventory to find a resource.
- Inspect its throttling assessment, storage, document count, and data growth.
- Select a container in the partition section to inspect its physical partitions.
- For provisioned accounts, compare RU and Storage distribution. Serverless accounts show storage distribution only.
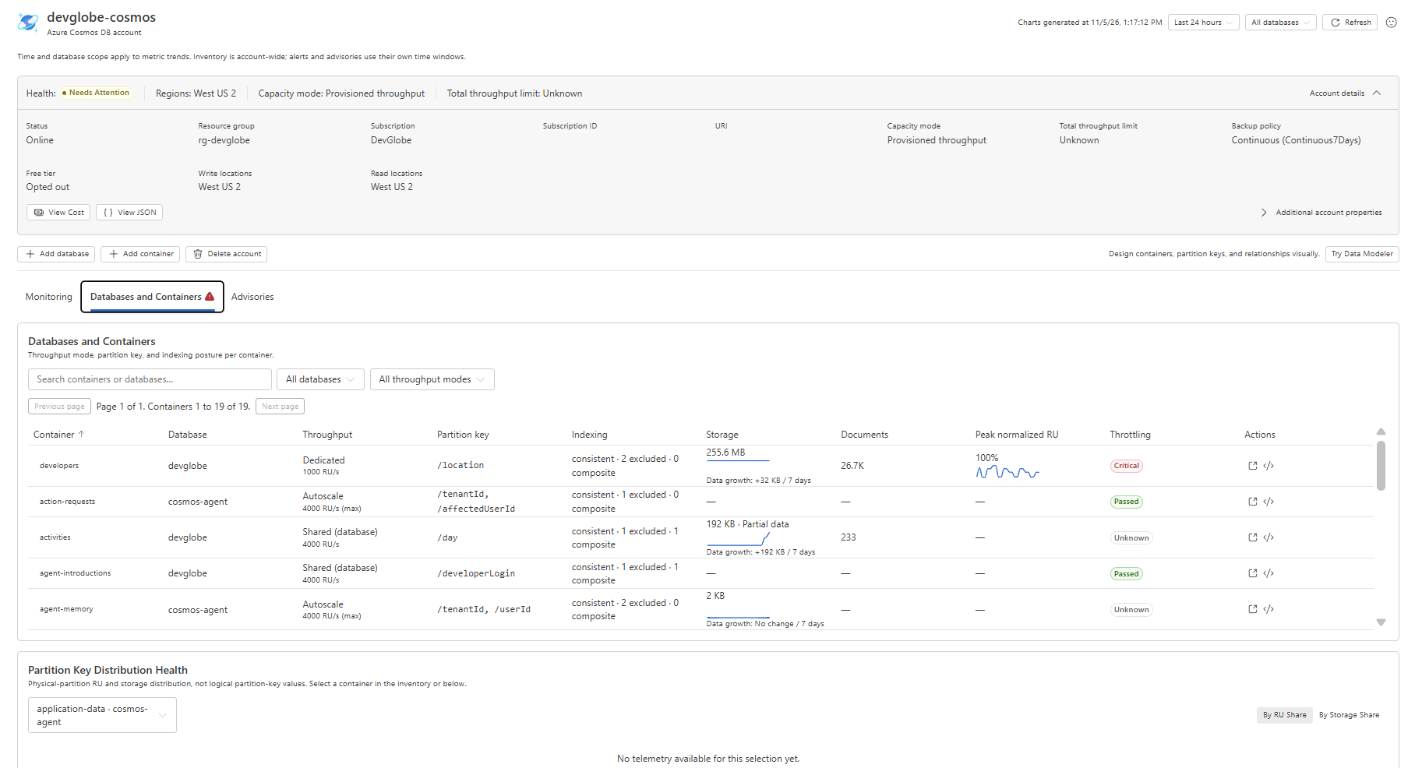
The partition selection is independent of the database filter in the account header. The RU view uses p99 normalized utilization for each physical partition, not that partition's share of all account RU.
Use this view to investigate uneven load or storage. It displays physical partitions, not individual logical partition-key values. A uniformly busy set of physical partitions can indicate a capacity problem rather than uneven distribution.
Container actions can locate the resource in the explorer or open its query editor for further investigation.
Review advisories and alerts
- Select Advisories.
- Open a derived finding to review its evidence and suggested investigation.
- Review Azure Advisor recommendations separately from the extension's derived findings.
- In Azure Monitor alerts, choose Active or Resolved and a period of 1h, 1d, 7d, or 30d.
- Use View in Azure portal to investigate an individual alert.
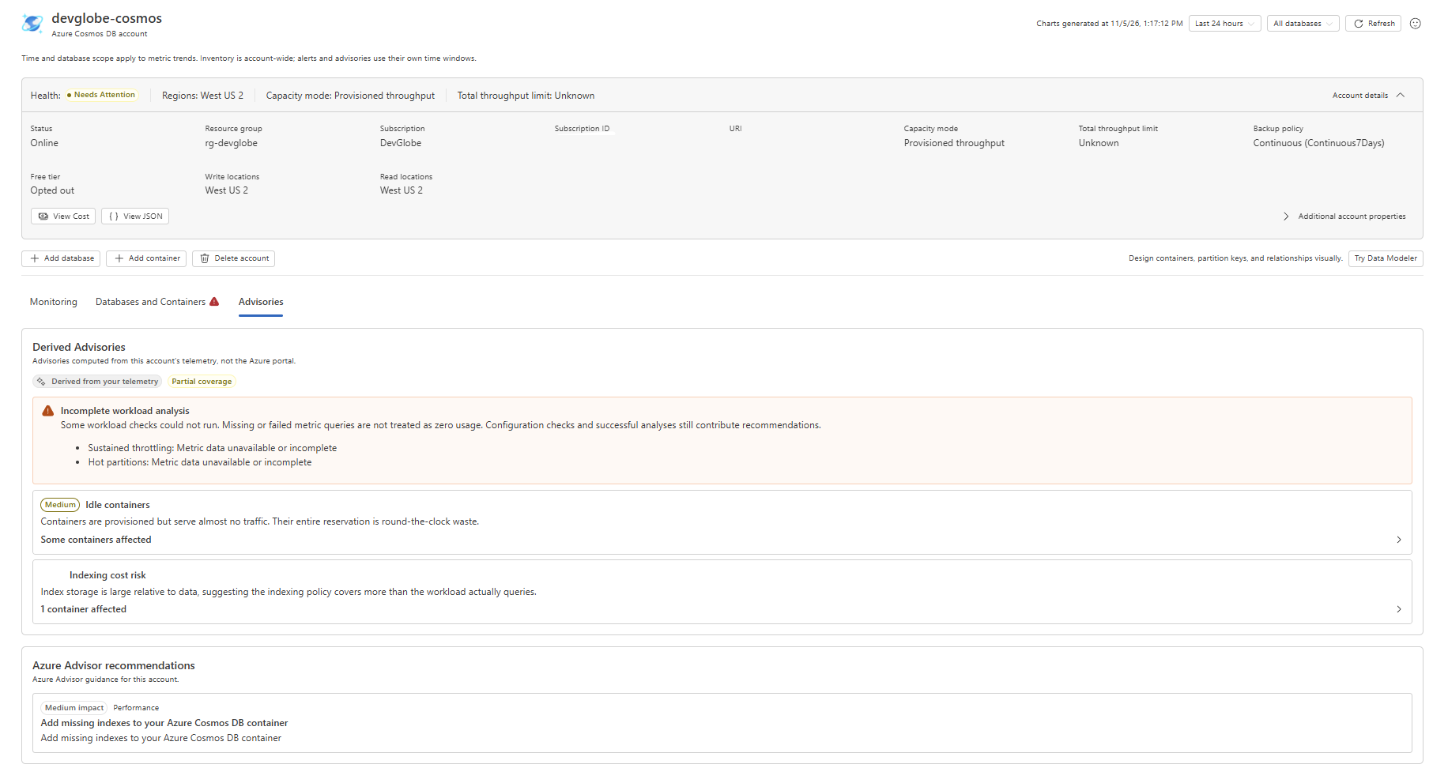
Derived advisories are diagnostic heuristics, not automatic fixes or guaranteed savings. Validate workload requirements and service limits before changing throughput, indexing, or capacity mode. Dismissing a derived finding hides it in the current dashboard; it doesn't change an Azure resource or dismiss an Azure alert.
Active alerts have a fired alert condition. That condition is separate from the incident workflow state, such as New, Acknowledged, or Closed. The account health summary checks active alerts independently of the alert list's selected period.
Some checks use different observation windows from the monitoring charts. Partial coverage means that some checks couldn't complete; no findings doesn't prove that every resource was assessed.
Refresh and configure the dashboard
Select Refresh to load a new snapshot. The dashboard doesn't refresh on a timer or just because you return to its editor tab. Switching dashboard tabs preserves the selected account and doesn't reload the data.
In Visual Studio Code Settings, search for Account Overview to configure container-health thresholds and physical-partition view controls. These settings don't change the thresholds for derived advisories.
View Cost opens the account's cost analysis in the Azure portal. View JSON opens the account resource definition, not its keys or connection strings. Try Data Modeler opens Data Modeler for the same account and requires available GitHub Copilot models and enabled AI features.
Troubleshooting
- The dashboard action is missing. Confirm that the account uses the NoSQL API and that your extension version includes the preview.
- A source shows missing access or can't load. Check permissions at that source's scope, select Refresh, and use Show Output when diagnostic details are offered.
- A metric shows no data or partial data. Check the observation period, account activity, and Azure Monitor ingestion. Don't interpret missing data as zero usage.
- Log-based advisories are unavailable. Confirm resource-specific diagnostic logging and access to the Log Analytics workspace.