series_mv_ee_anomalies_fl()
The function series_mv_ee_anomalies_fl() is a user-defined function (UDF) that detects multivariate anomalies in series by applying elliptic envelope model from scikit-learn. This model assumes that the source of the multivariate data is multi-dimensional normal distribution. The function accepts a set of series as numerical dynamic arrays, the names of the features columns and the expected percentage of anomalies out of the whole series. The function builds a multi-dimensional elliptical envelope for each series and marks the points that fall outside this normal envelope as anomalies.
Prerequisites
- The Python plugin must be enabled on the cluster. This is required for the inline Python used in the function.
- The Python plugin must be enabled on the database. This is required for the inline Python used in the function.
Syntax
T | invoke series_mv_ee_anomalies_fl(features_cols, anomaly_col [, score_col [, anomalies_pct ]])
Learn more about syntax conventions.
Parameters
| Name | Type | Required | Description |
|---|---|---|---|
| features_cols | dynamic |
✔️ | An array containing the names of the columns that are used for the multivariate anomaly detection model. |
| anomaly_col | string |
✔️ | The name of the column to store the detected anomalies. |
| score_col | string |
The name of the column to store the scores of the anomalies. | |
| anomalies_pct | real |
A real number in the range [0-50] specifying the expected percentage of anomalies in the data. Default value: 4%. |
Function definition
You can define the function by either embedding its code as a query-defined function, or creating it as a stored function in your database, as follows:
Define the function using the following let statement. No permissions are required.
Important
A let statement can't run on its own. It must be followed by a tabular expression statement. To run a working example of series_mv_ee_anomalies_fl(), see Example.
// Define function
let series_mv_ee_anomalies_fl=(tbl:(*), features_cols:dynamic, anomaly_col:string, score_col:string='', anomalies_pct:real=4.0)
{
    let kwargs = bag_pack('features_cols', features_cols, 'anomaly_col', anomaly_col, 'score_col', score_col, 'anomalies_pct', anomalies_pct);
    let code = ```if 1:
        from sklearn.covariance import EllipticEnvelope
        features_cols = kargs['features_cols']
        anomaly_col = kargs['anomaly_col']
        score_col = kargs['score_col']
        anomalies_pct = kargs['anomalies_pct']
        dff = df[features_cols]
        ellipsoid = EllipticEnvelope(contamination=anomalies_pct/100.0)
        for i in range(len(dff)):
            dffi = dff.iloc[[i], :]
            dffe = dffi.explode(features_cols)
            ellipsoid.fit(dffe)
            df.loc[i, anomaly_col] = (ellipsoid.predict(dffe) < 0).astype(int).tolist()
            if score_col != '':
                df.loc[i, score_col] = ellipsoid.decision_function(dffe).tolist()
        result = df
    ```;
    tbl
    | evaluate hint.distribution=per_node python(typeof(*), code, kwargs)
};
// Write your query to use the function here.
Example
The following example uses the invoke operator to run the function.
To use a query-defined function, invoke it after the embedded function definition.
// Define function
let series_mv_ee_anomalies_fl=(tbl:(*), features_cols:dynamic, anomaly_col:string, score_col:string='', anomalies_pct:real=4.0)
{
let kwargs = bag_pack('features_cols', features_cols, 'anomaly_col', anomaly_col, 'score_col', score_col, 'anomalies_pct', anomalies_pct);
let code = ```if 1:
from sklearn.covariance import EllipticEnvelope
features_cols = kargs['features_cols']
anomaly_col = kargs['anomaly_col']
score_col = kargs['score_col']
anomalies_pct = kargs['anomalies_pct']
dff = df[features_cols]
ellipsoid = EllipticEnvelope(contamination=anomalies_pct/100.0)
for i in range(len(dff)):
dffi = dff.iloc[[i], :]
dffe = dffi.explode(features_cols)
ellipsoid.fit(dffe)
df.loc[i, anomaly_col] = (ellipsoid.predict(dffe) < 0).astype(int).tolist()
if score_col != '':
df.loc[i, score_col] = ellipsoid.decision_function(dffe).tolist()
result = df
```;
tbl
| evaluate hint.distribution=per_node python(typeof(*), code, kwargs)
};
// Usage
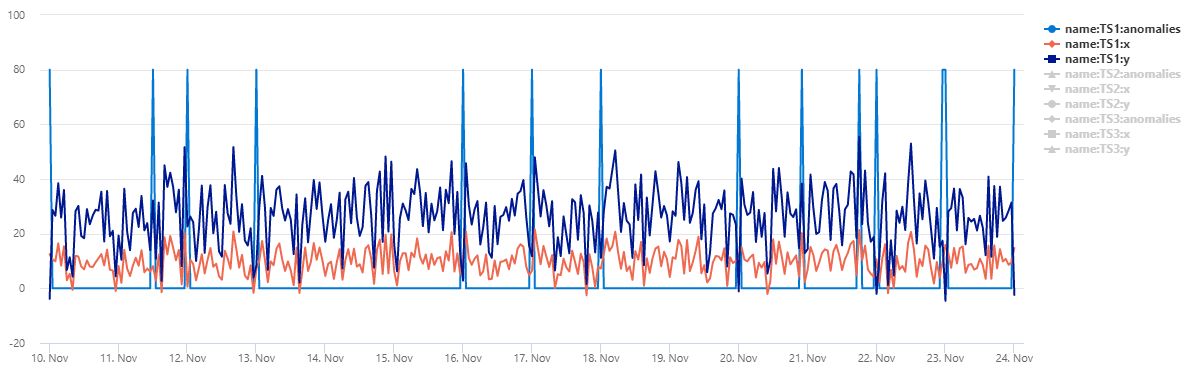
normal_2d_with_anomalies
| extend anomalies=dynamic(null), scores=dynamic(null)
| invoke series_mv_ee_anomalies_fl(pack_array('x', 'y'), 'anomalies', 'scores')
| extend anomalies=series_multiply(80, anomalies)
| render timechart
Output
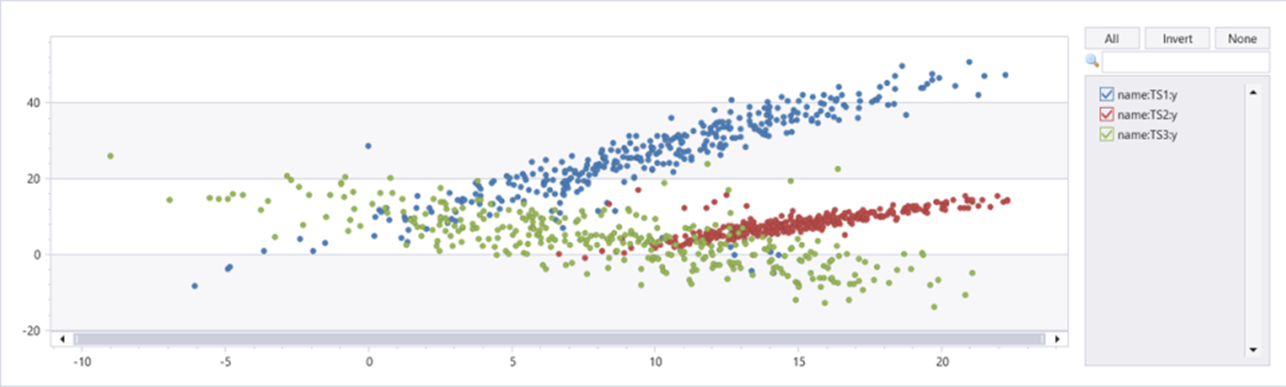
The table normal_2d_with_anomalies contains a set of 3 time series. Each time series has two-dimensional normal distribution with daily anomalies added at midnight, 8am, and 4pm respectively. You can create this sample dataset using an example query.
To view the data as a scatter chart, replace the usage code with the following:
normal_2d_with_anomalies
| extend anomalies=dynamic(null)
| invoke series_mv_ee_anomalies_fl(pack_array('x', 'y'), 'anomalies')
| where name == 'TS1'
| project x, y, anomalies
| mv-expand x to typeof(real), y to typeof(real), anomalies to typeof(string)
| render scatterchart with(series=anomalies)
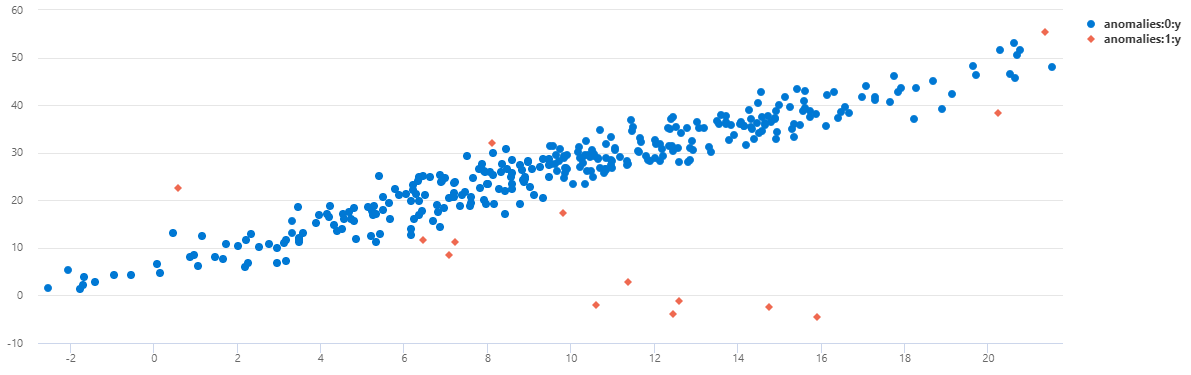
You can see that on TS1 most of the midnight anomalies were detected using this multivariate model.
Create a sample dataset
.set normal_2d_with_anomalies <|
//
let window=14d;
let dt=1h;
let n=toint(window/dt);
let rand_normal_fl=(avg:real=0.0, stdv:real=1.0)
{
    let x =rand()+rand()+rand()+rand()+rand()+rand()+rand()+rand()+rand()+rand()+rand()+rand();
    (x - 6)*stdv + avg
};
union
(range s from 0 to n step 1
| project t=startofday(now())-s*dt
| extend x=rand_normal_fl(10, 5)
| extend y=iff(hourofday(t) == 0, 2*(10-x)+7+rand_normal_fl(0, 3), 2*x+7+rand_normal_fl(0, 3))  //  anomalies every midnight
| extend name='TS1'),
(range s from 0 to n step 1
| project t=startofday(now())-s*dt
| extend x=rand_normal_fl(15, 3)
| extend y=iff(hourofday(t) == 8, (15-x)+10+rand_normal_fl(0, 2), x-7+rand_normal_fl(0, 1)) //  anomalies every 8am
| extend name='TS2'),
(range s from 0 to n step 1
| project t=startofday(now())-s*dt
| extend x=rand_normal_fl(8, 6)
| extend y=iff(hourofday(t) == 16, x+5+rand_normal_fl(0, 4), (12-x)+rand_normal_fl(0, 4)) //  anomalies every 4pm
| extend name='TS3')
| summarize t=make_list(t), x=make_list(x), y=make_list(y) by name
This feature isn't supported.
Feedback
Coming soon: Throughout 2024 we will be phasing out GitHub Issues as the feedback mechanism for content and replacing it with a new feedback system. For more information see: https://aka.ms/ContentUserFeedback.
Submit and view feedback for