Note
Access to this page requires authorization. You can try signing in or changing directories.
Access to this page requires authorization. You can try changing directories.
This tutorial describes the basics of setting up a Microsoft Defender for IoT OT sensor, using a trial subscription of Microsoft Defender for IoT and your own virtual machine.
For a full, end-to-end deployment, make sure to follow steps to plan and prepare your system, and also fully calibrate and fine-tune your settings. For more information, see Deploy Defender for IoT for OT monitoring.
Note
If you're looking to set up security monitoring for enterprise IoT systems, see Enable Enterprise IoT security in Defender for Endpoint.
In this tutorial, you learn how to:
- Create a VM for the sensor
- Onboard a virtual sensor
- Configure a virtual SPAN port
- Provision for cloud management
- Download software for a virtual sensor
- Install the virtual sensor software
- Activate the virtual sensor
Prerequisites
Before you start, make sure that you have the following:
Completed Quickstart: Get started with Defender for IoT so that you have an Azure subscription added to Defender for IoT.
Access to the Azure portal as a Security Admin, Contributor, or Owner. For more information, see Azure user roles for OT and Enterprise IoT monitoring with Defender for IoT.
Make sure that you have a network switch that supports traffic monitoring via a SPAN port. You'll also need at least one device to monitor, connected to the switch's SPAN port.
VMware, ESXi 5.5 or later, installed and operational on your sensor.
Available hardware resources for your VM as follows:
Deployment type Corporate Enterprise SMB Maximum bandwidth 2.5 Gb/sec 800 Mb/sec 160 Mb/sec Maximum protected devices 12,000 10,000 800 An understanding of OT monitoring with virtual appliances.
Details for the following network parameters to use for your sensor appliance:
- A management network IP address
- A sensor subnet mask
- An appliance hostname
- A DNS address
- A default gateway
- Any input interfaces
Create a VM for your sensor
This procedure describes how to create a VM for your sensor with VMware ESXi.
Defender for IoT also supports other processes, such as using Hyper-V or physical sensors. For more information, see Defender for IoT installation.
To create a VM for your sensor:
Make sure that VMware is running on your machine.
Sign in to the ESXi, choose the relevant datastore, and select Datastore Browser.
Upload the image and select Close.
Go to Virtual Machines, and then select Create/Register VM.
Select Create new virtual machine, and then select Next.
Add a sensor name and then define the following options:
Compatibility: <latest ESXi version>
Guest OS family: Linux
Guest OS version: Debian
Select Next.
Choose the relevant datastore and select Next.
Change the virtual hardware parameters according to the required specifications for your needs. For more information, see the table in the Prerequisites section above.
Your VM is now prepared for your Defender for IoT software installation. You'll continue by installing the software later on in this tutorial, after you've onboarded your sensor in the Azure portal, configured traffic mirroring, and provisioned the machine for cloud management.
Onboard the virtual sensor
Before you can start using your Defender for IoT sensor, you need to onboard your new virtual sensor to your Azure subscription.
To onboard the virtual sensor:
In the Azure portal, go to the Defender for IoT > Getting started page.
At the bottom left, select Set up OT/ICS Security.
Alternately, from the Defender for IoT Sites and sensors page, select Onboard OT sensor > OT.
By default, on the Set up OT/ICS Security page, Step 1: Did you set up a sensor? and Step 2: Configure SPAN port or TAP of the wizard are collapsed.
You'll install software and configure traffic mirroring later on in the deployment process, but should have your appliances ready and traffic mirroring method planned.
In Step 3: Register this sensor with Microsoft Defender for IoT, define the following values:
Field name Description Resource name Select the site you want to attach your sensors to, or select Create site to create a new site.
If you're creating a new site:
1. In the New site field, enter your site's name and select the checkmark button.
2. From the Site size menu, select your site's size. The sizes listed in this menu are the sizes that you're licensed for, based on the licenses you'd purchased in the Microsoft 365 admin center.Display name Enter a meaningful name for your site to be shown across Defender for IoT. Tags Enter tag key and values to help you identify and locate your site and sensor in the Azure portal. Zone Select the zone you want to use for your OT sensor, or select Create zone to create a new one. For more information, see Plan OT sites and zones.
When you're done with all other fields, select Register to add your sensor to Defender for IoT. A success message is displayed and your activation file is automatically downloaded. The activation file is unique for your sensor and contains instructions about your sensor's management mode.
All files downloaded from the Azure portal are signed by root of trust so that your machines use signed assets only.
Save the downloaded activation file in a location that will be accessible to the user signing into the console for the first time so they can activate the sensor.
You can also download the file manually by selecting the relevant link in the Activate your sensor box. You'll use this file to activate your sensor, as described below.
In the Add outbound allow rules box, select the Download endpoint details link to download a JSON list of the endpoints you must configure as secure endpoints from your sensor.
Save the downloaded file locally. Use the endpoints listed in the downloaded file later in this tutorial to ensure that your new sensor can successfully connect to Azure.
Tip
You can also access the list of required endpoints from the Sites and sensors page. For more information, see Sensor management options from the Azure portal.
At the bottom left of the page, select Finish. You can now see your new sensor listed on the Defender for IoT Sites and sensors page.
Until you activate your sensor, the sensor's status shows as Pending Activation.
For more information, see Manage sensors with Defender for IoT in the Azure portal.
Configure a SPAN port
Virtual switches don't have mirroring capabilities. However, for the sake of this tutorial you can use promiscuous mode in a virtual switch environment to view all network traffic that goes through the virtual switch.
This procedure describes how to configure a SPAN port using a workaround with VMware ESXi.
Note
Promiscuous mode is an operating mode and a security monitoring technique for a VM's interfaces in the same portgroup level as the virtual switch to view the switch's network traffic. Promiscuous mode is disabled by default but can be defined at the virtual switch or portgroup level.
To configure a monitoring interface with Promiscuous mode on an ESXi v-Switch:
Open the vSwitch properties page and select Add standard virtual switch.
Enter SPAN Network as the network label.
In the MTU field, enter 4096.
Select Security, and verify that the Promiscuous Mode policy is set to Accept mode.
Select Add to close the vSwitch properties.
Highlight the vSwitch you've created, and select Add uplink.
Select the physical NIC you'll use for the SPAN traffic, change the MTU to 4096, then select Save.
Open the Port Group properties page and select Add Port Group.
Enter SPAN Port Group as the name, enter 4095 as the VLAN ID, and select SPAN Network in the vSwitch drop down, then select Add.
Open the OT Sensor VM properties.
For Network Adapter 2, select the SPAN network.
Select OK.
Connect to the sensor, and verify that mirroring works.
Validate traffic mirroring
After configuring traffic mirroring, make an attempt to receive a sample of recorded traffic (PCAP file) from the switch SPAN or mirror port.
A sample PCAP file will help you:
- Validate the switch configuration
- Confirm that the traffic going through your switch is relevant for monitoring
- Identify the bandwidth and an estimated number of devices detected by the switch
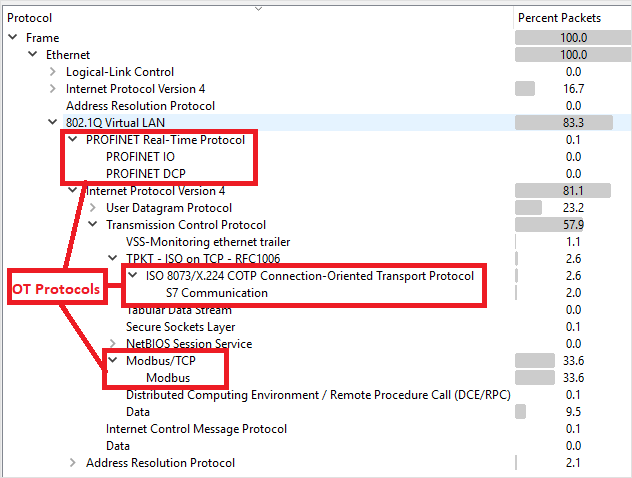
Use a network protocol analyzer application, such as Wireshark, to record a sample PCAP file for a few minutes. For example, connect a laptop to a port where you've configured traffic monitoring.
Check that Unicast packets are present in the recording traffic. Unicast traffic is traffic sent from address to another.
If most of the traffic is ARP messages, your traffic mirroring configuration isn't correct.
Verify that your OT protocols are present in the analyzed traffic.
For example:
Provision for cloud management
This section describes how to configure endpoints to define in firewall rules, ensuring that your OT sensors can connect to Azure.
For more information, see Methods for connecting sensors to Azure.
To configure endpoint details:
Open the file you'd downloaded earlier to view the list of required endpoints. Configure your firewall rules so that your sensor can access each of the required endpoints, over port 443.
Tip
You can also download the list of required endpoints from the Sites and sensors page in the Azure portal. Go to Sites and sensors > More actions > Download endpoint details. For more information, see Sensor management options from the Azure portal.
For more information, see Provision sensors for cloud management.
Download software for your virtual sensor
This section describes how to download and install the sensor software on your own machine.
To download software for your virtual sensors:
In the Azure portal, go to the Defender for IoT > Getting started page, and select the Sensor tab.
In the Purchase an appliance and install software box, ensure that the default option is selected for the latest and recommended software version, and then select Download.
Save the downloaded software in a location that's accessible from your VM.
All files downloaded from the Azure portal are signed by root of trust so that your machines use signed assets only.
Install sensor software
This procedure describes how to install the sensor software on your VM.
Note
Towards the end of this process you will be presented with the usernames and passwords for your device. Make sure to copy these down as these passwords will not be presented again.
To install the software on the virtual sensor:
If you closed your VM, sign into the ESXi again and open your VM settings.
For CD/DVD Drive 1, select Datastore ISO file and select the Defender for IoT software you'd downloaded earlier.
Select Next > Finish.
Power on the VM, and open a console.
When the installation boots, you're prompted to start the installation process. Select the Install iot-sensor-
<version number>item to continue or let it start automatically after 30 seconds. For example: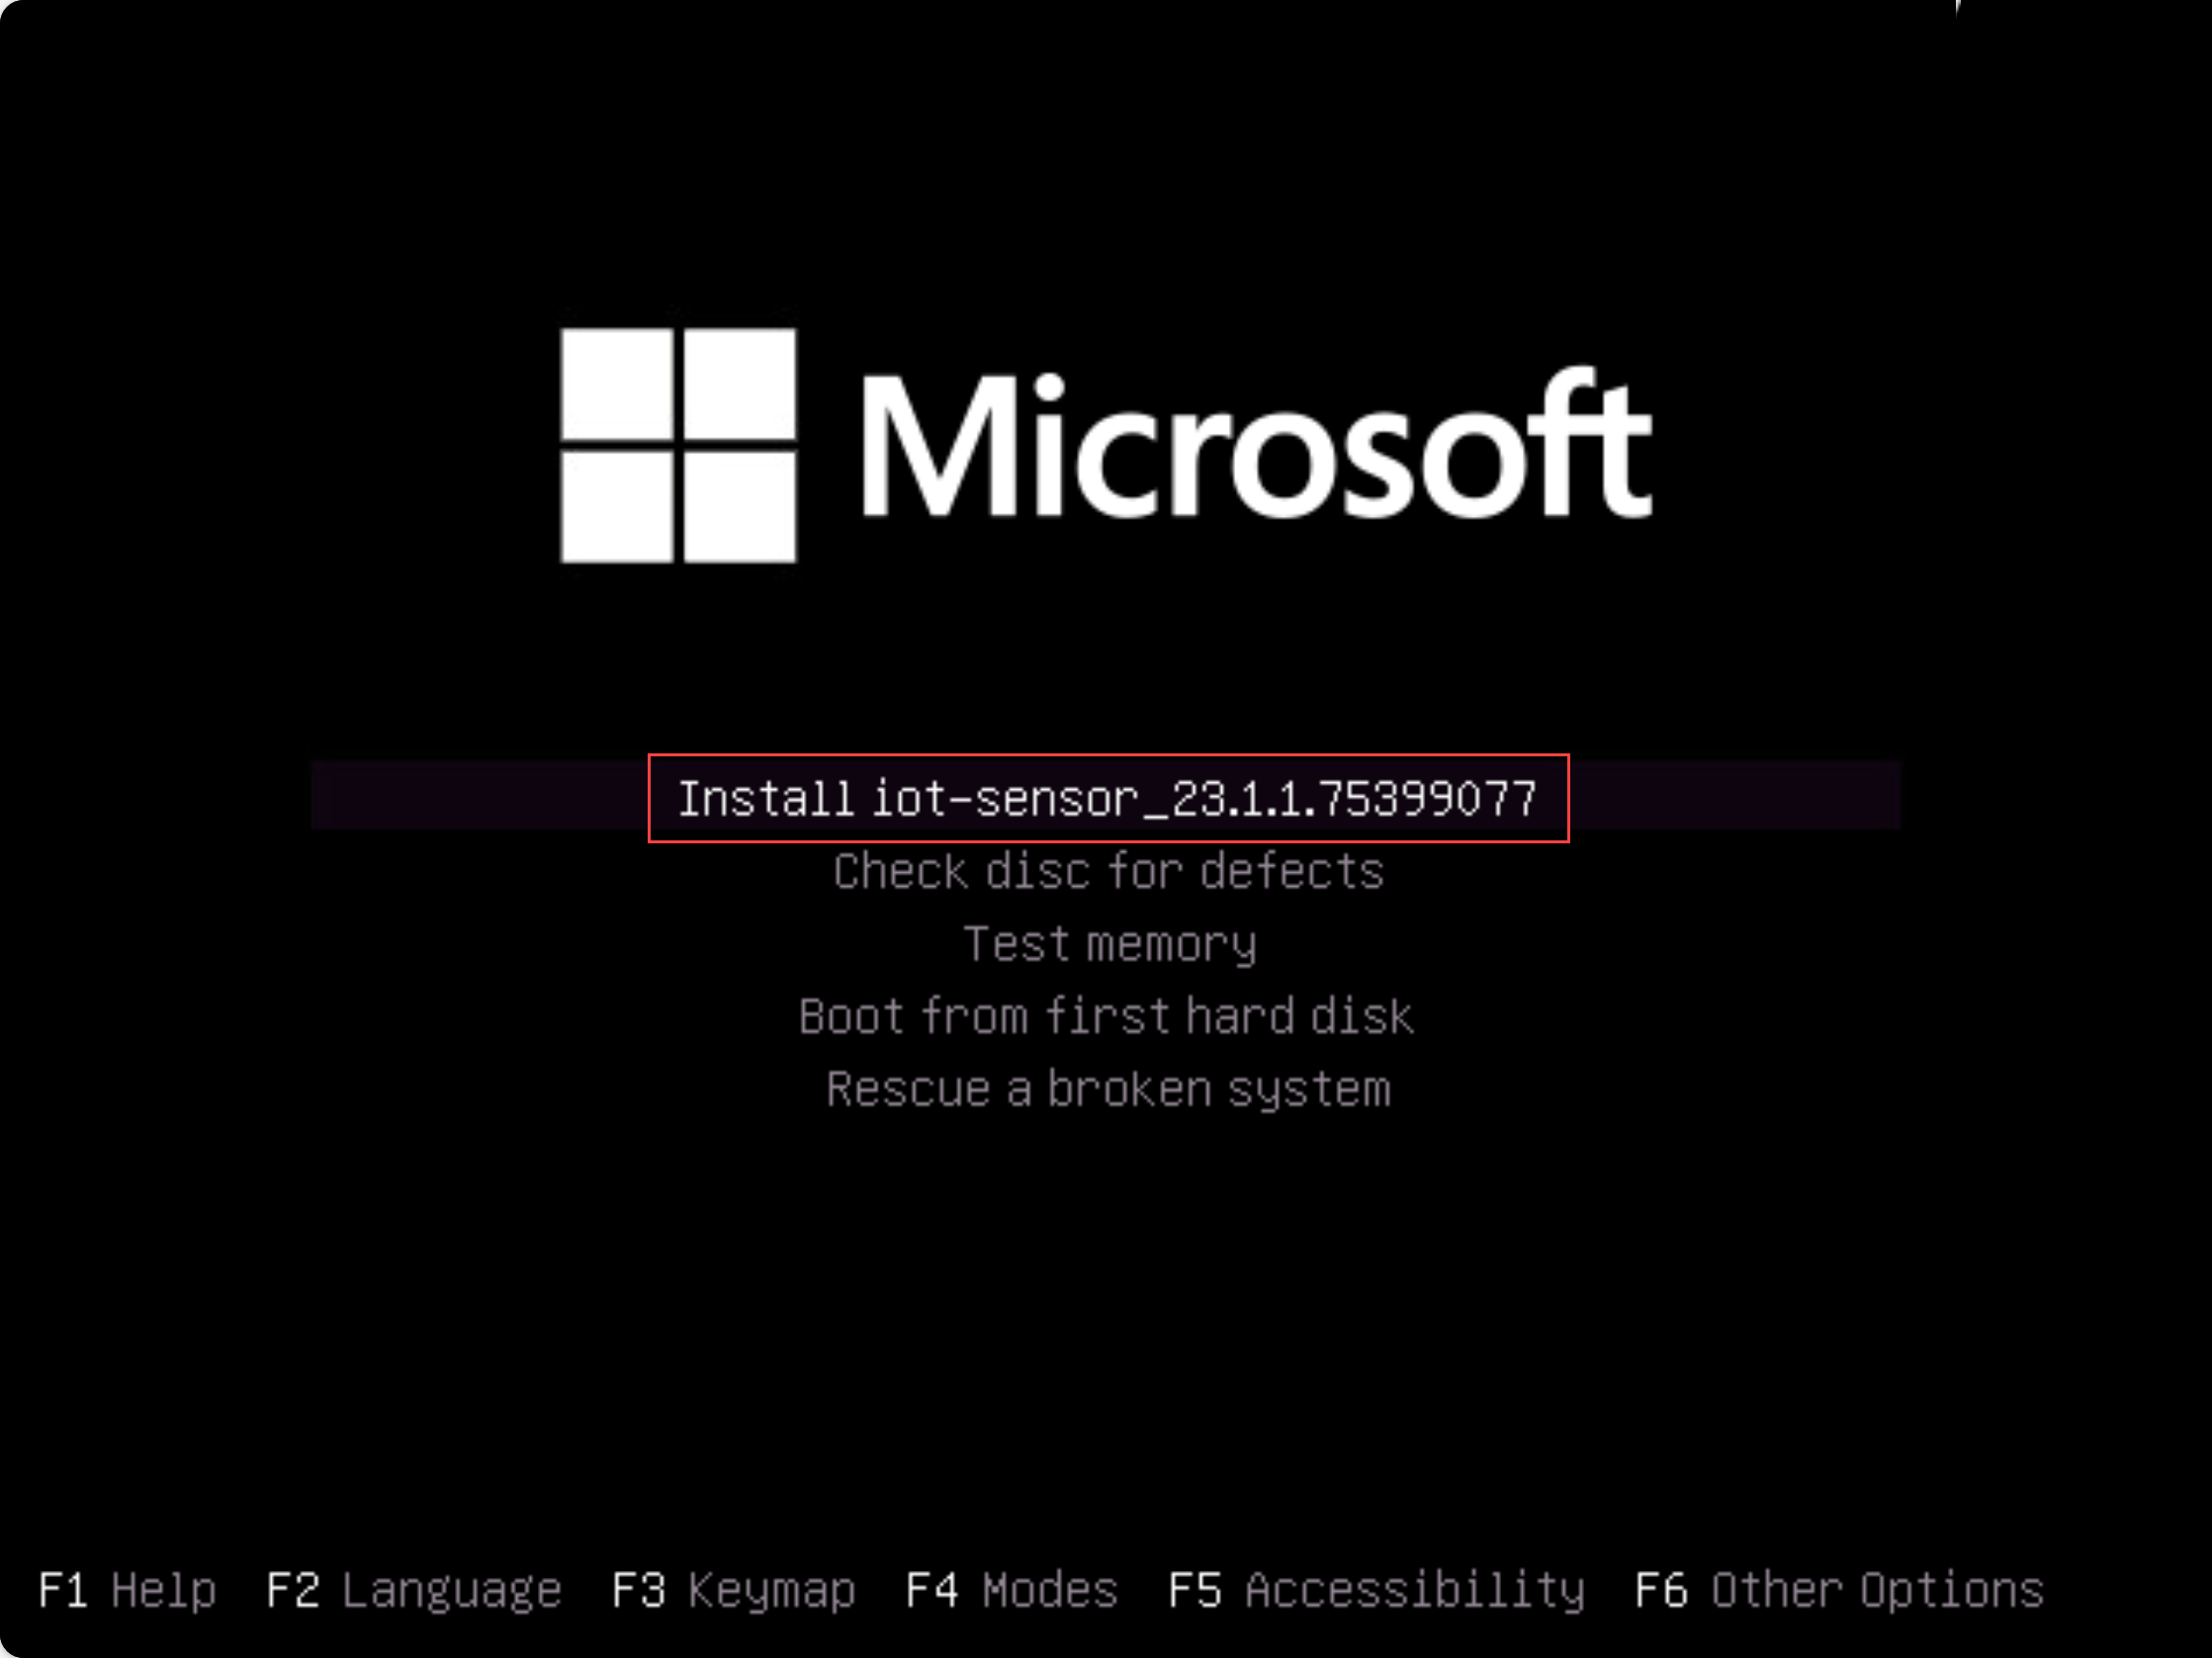
Note
If you're using a legacy BIOS version, you're prompted to select a language and the installation options are presented at the top left instead of in the center. When prompted, select
Englishand then the Install iot-sensor-<version number>option to continue.The installation begins, giving you updated status messages as it goes. The entire installation process takes up to 20-30 minutes, and may vary depending on the type of media you're using.
When the installation is complete, you're shown the following set of default networking details.
IP: 172.23.41.83,
SUBNET: 255.255.255.0,
GATEWAY: 172.23.41.1,
UID: 91F14D56-C1E4-966F-726F-006A527C61D
Use the default IP address provided to access your sensor for initial setup and activation.
Post-installation validation
This procedure describes how to validate your installation using the sensor's own system health checks and is available to the default admin user.
To validate your installation:
Sign in to the OT sensor as the
adminuser.Select System Settings > Sensor management > System Health Check.
Select the following commands:
- Appliance to check that the system is running. Verify that each line item shows Running and that the last line states that the System is up.
- Version to verify that you have the correct version installed.
- ifconfig to verify that all input interfaces configured during installation are running.
For more post-installation validation tests, such as gateway, DNS or firewall checks, see Validate an OT sensor software installation.
Define initial setup
The following procedure describes how to configure your sensor's initial setup settings, including:
- Signing into the sensor console and changing the admin user password
- Defining network details for your sensor
- Defining the interfaces you want to monitor
- Activating your sensor
- Configuring SSL/TLS certificate settings
Sign in to the sensor console and change the default password
This procedure describes how to sign into the OT sensor console for the first time. You're prompted to change the default password for the admin user.
To sign in to your sensor:
In a browser, go the
192.168.0.101IP address, which is the default IP address provided for your sensor at the end of the installation.The initial sign-in page appears. For example:

Enter the following credentials and select Login:
- Username:
support - Password:
support
You're asked to define a new password for the admin user.
- Username:
In the New password field, enter your new password. Your password must contain lowercase and uppercase alphabetic characters, numbers, and symbols.
In the Confirm new password field, enter your new password again, and then select Get started.
For more information, see Default privileged users.
The Defender for IoT | Overview page opens to the Management interface tab.
Define sensor networking details
In the Management interface tab, use the following fields to define network details for your new sensor:
For the sake of this tutorial, leave the skip the proxy configurations in the Enable proxy for cloud connectivity (Optional) area.
When you're done, select Next: Interface configurations to continue.
Define the interfaces you want to monitor
The Interface connections tab shows all interfaces detected by the sensor by default. Use this tab to turn monitoring on or off per interface, or define specific settings for each interface.
Tip
We recommend that you optimize performance on your sensor by configuring your settings to monitor only the interfaces that are actively in use.
In the Interface configurations tab, do the following to configure settings for your monitored interfaces:
Select the Enable/Disable toggle for any interfaces you want the sensor to monitor. You must select at least one interface to continue.
If you're not sure about which interface to use, select the
 Blink physical interface LED button to have the selected port blink on your machine. Select any of the interfaces that you've connected to your switch.
For the sake of this tutorial, skip any advanced settings and select Next: Reboot > to continue.
When prompted, select Start reboot to reboot your sensor machine. After the sensor starts again, you're automatically redirected to the IP address you'd defined earlier as your sensor IP address.
Select Cancel to wait for the reboot.
Activate your OT sensor
This procedure describes how to activate your new OT sensor.
To activate your sensor:
In the Activation tab, select Upload to upload the sensor's activation file that you'd downloaded from the Azure portal.
Select the terms and conditions option and then select Next: Certificates.
Define SSL/TLS certificate settings
Use the Certificates tab to deploy an SSL/TLS certificate on your OT sensor. While we recommend that you use a CA-signed certificate for all production environments, for the sake of this tutorial, select to use a self-signed certificate.
To define SSL/TLS certificate settings:
In the Certificates tab, select Use Locally generated self-signed certificate (Not recommended), and then select the Confirm option.
For more information, see SSL/TLS certificate requirements for on-premises resources and Create SSL/TLS certificates for OT appliances.
Select Finish to complete the initial setup and open your sensor console.