Note
Access to this page requires authorization. You can try signing in or changing directories.
Access to this page requires authorization. You can try changing directories.
This tutorial shows you how to migrate Oracle WebLogic Server (WLS) to Azure Kubernetes Service (AKS) and configure automatic horizontal scaling based on Prometheus metrics.
In this tutorial, you accomplish the following tasks:
- Learn which WebLogic application metrics you can export using WebLogic Monitoring Exporter.
- Deploy and run a WebLogic application on AKS using an Azure marketplace offer.
- Enable the Azure Monitor managed service for Prometheus using an Azure marketplace offer.
- Feed WLS metrics to an Azure Monitor workspace using an Azure marketplace offer.
- Integrate Kubernetes Event-driven Autoscaling (KEDA) with an AKS cluster using an Azure marketplace offer.
- Create a KEDA scaler based on Prometheus Metrics.
- Validate the scaler configuration.
The following diagram illustrates the architecture you build:

The Oracle WebLogic Server on AKS offer runs a WLS operator and a WLS domain on AKS. The WLS operator manages a WLS domain deployed using a model in image domain source type. To learn more about the WLS operator, see Oracle WebLogic Kubernetes Operator.
The WebLogic Monitoring Exporter scrapes WebLogic Server metrics and feeds them to Prometheus. The exporter uses the WebLogic Server 12.2.1.x RESTful Management Interface for accessing runtime state and metrics.
The Azure Monitor managed service for Prometheus collects and saves metrics from WLS at scale using a Prometheus-compatible monitoring solution, based on the Prometheus project from the Cloud Native Computing Foundation. For more information, see Azure Monitor managed service for Prometheus.
This article integrates KEDA with your AKS cluster to scale the WLS cluster based on Prometheus metrics from the Azure Monitor workspace. KEDA monitors the Azure Monitor managed service for Prometheus and feeds that data to AKS and the Horizontal Pod Autoscaler (HPA) to drive rapid scaling of the WLS workload.
The following WLS state and metrics are exported by default. You can configure the exporter to export other metrics on demand. For a detailed description of WebLogic Monitoring Exporter configuration and usage, see WebLogic Monitoring Exporter.

Prerequisites
- An Azure subscription. If you don't have an Azure subscription, create a free account before you begin.
- Make sure you have either the
Ownerrole or theContributorandUser Access Administratorroles in the subscription. You can verify the assignment by following the steps in List Azure role assignments using the Azure portal. - Prepare a local machine with either Windows with WSL, GNU/Linux, or macOS installed.
- Install Azure CLI version 2.54.0 or higher to run Azure CLI commands.
- Install and set up kubectl.
- Install cURL.
- Have the credentials for an Oracle single sign-on (SSO) account. To create one, see Create Your Oracle Account.
- Use the following steps to accept the license terms for WLS:
- Visit the Oracle Container Registry and sign in.
- If you have a support entitlement, select Middleware, then search for and select weblogic_cpu.
- If you don't have a support entitlement from Oracle, select Middleware, then search for and select weblogic.
- Accept the license agreement.
Prepare the sample application
This article uses testwebapp from the weblogic-kubernetes-operator repository as a sample application.
Use the following commands to download the prebuilt sample app and expand it into a directory. Because this article writes several files, these commands create a top level directory to contain everything.
export BASE_DIR=$PWD/wlsaks
mkdir $BASE_DIR && cd $BASE_DIR
curl -L -o testwebapp.war https://aka.ms/wls-aks-testwebapp
unzip -d testwebapp testwebapp.war
Modify the sample application
This article uses the metric openSessionsCurrentCount to scale up and scale down the WLS cluster. By default, the session timeout on WebLogic Server is 60 minutes. To observe the scaling down capability quickly, use the following steps to set a short timeout:
Use the following command to specify a session timeout of 150 seconds using
wls:timeout-secs. TheHEREDOCformat is used to overwrite the file at testwebapp/WEB-INF/weblogic.xml with the desired content.cat <<EOF > testwebapp/WEB-INF/weblogic.xml <?xml version="1.0" encoding="UTF-8"?> <wls:weblogic-web-app xmlns:wls="http://xmlns.oracle.com/weblogic/weblogic-web-app" xmlns:xsi="http://www.w3.org/2001/XMLSchema-instance" xsi:schemaLocation="http://java.sun.com/xml/ns/javaee http://java.sun.com/xml/ns/javaee/web-app_2_5.xsd http://xmlns.oracle.com/weblogic/weblogic-web-app http://xmlns.oracle.com/weblogic/weblogic-web-app/1.4/weblogic-web-app.xsd"> <wls:weblogic-version>12.2.1</wls:weblogic-version> <wls:jsp-descriptor> <wls:keepgenerated>false</wls:keepgenerated> <wls:debug>false</wls:debug> </wls:jsp-descriptor> <wls:context-root>testwebapp</wls:context-root> <wls:session-descriptor> <wls:timeout-secs>150</wls:timeout-secs> </wls:session-descriptor> </wls:weblogic-web-app> EOFUse the following command to rezip the sample app:
cd testwebapp && zip -r ../testwebapp.war * && cd ..
Create an Azure Storage account and upload the application
Use the following steps to create a storage account and container. Some of these steps direct you to other guides. After completing the steps, you can upload a sample application to deploy on WLS.
- Sign in to the Azure portal.
- Create a storage account by following the steps in Create a storage account. Use the following specializations for the values in that article:
- Create a new resource group for the storage account.
- For Region, select East US.
- For Storage account name, use the same value as the resource group name.
- For Performance, select Standard.
- The remaining tabs need no specializations.
- Proceed to validate and create the account, then return to this article.
- Create a storage container within the account by following the steps in the Create a container section of Quickstart: Upload, download, and list blobs with the Azure portal.
- In the same article, follow the steps in the Upload a block blob section to upload the testwebapp.war file. Then, return to this article.
Deploy WLS on AKS using the Azure Marketplace offer
In this section, you create a WLS cluster on AKS using the Oracle WebLogic Server on AKS offer. The offer provides a full feature set for easily deploying WebLogic Server on AKS. This article focuses on the advanced dynamic scaling capabilities of the offer. For more information about the offer, see Deploy a Java application with WebLogic Server on an Azure Kubernetes Service (AKS) cluster. For the complete reference documentation for the offer, see the Oracle documentation.
This offer implements the following choices for horizontal autoscaling:
Kubernetes Metrics Server. This choice sets up all necessary configuration at deployment time. A horizontal pod autoscaler (HPA) is deployed with a choice of metrics. You can further customize the HPA after deployment.
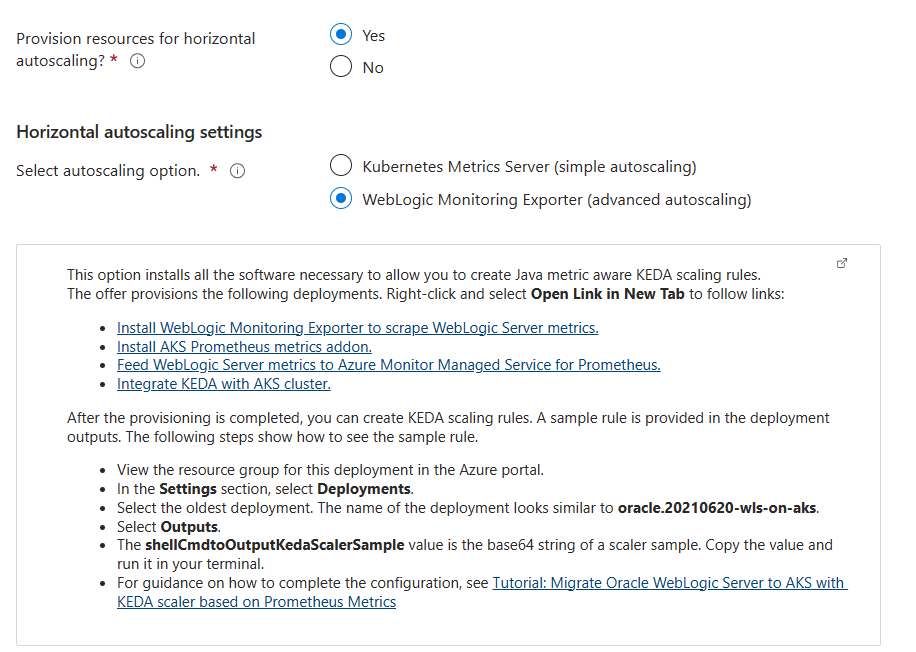
WebLogic Monitoring Exporter. This choice automatically provisions WebLogic Monitoring Exporter, Azure Monitor managed service for Prometheus, and KEDA. After the offer deployment completes, the WLS metrics are exported and saved in the Azure Monitor workspace. KEDA is installed with the ability to retrieve metrics from the Azure Monitor workspace.
With this option, you must take more steps after deployment to complete the configuration.
This article describes the second option. Use the following steps to to complete the configuration:
Open the Oracle WebLogic Server on AKS offer in your browser and select Create. You should see the Basics pane of the offer.
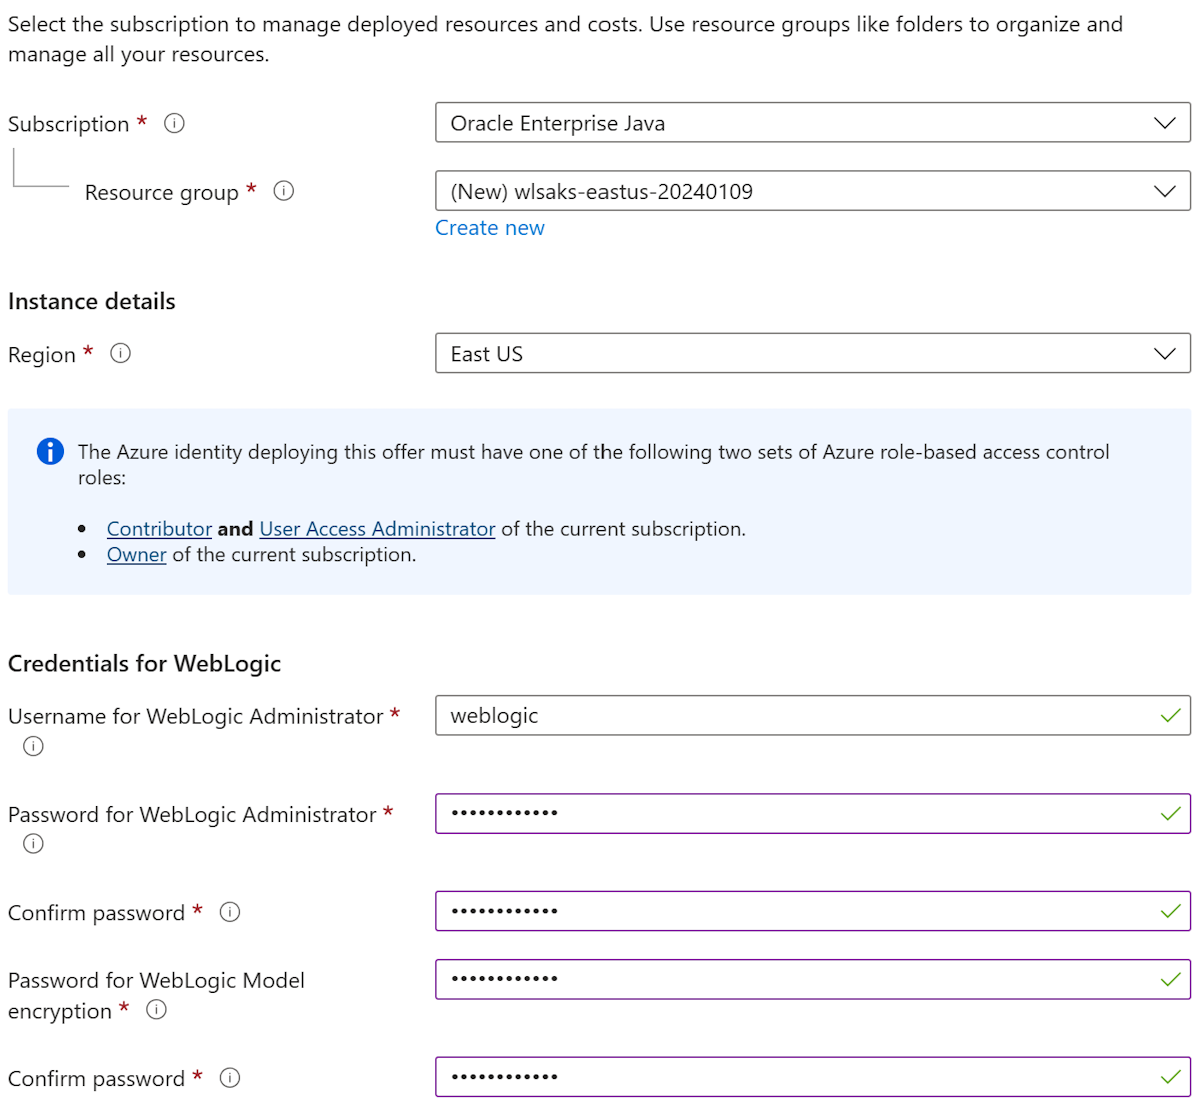
Use the following steps to fill out the Basics pane:
- Ensure that the value shown for Subscription is the same one that has the roles listed in the prerequisites section.
- In the Resource group field, select Create new and fill in a unique value for the resource group - for example, wlsaks-eastus-20240109.
- Under Instance details, for Region, select East US.
- Under Credentials WebLogic, provide a password for WebLogic Administrator and WebLogic Model encryption, respectively. Save aside the username and password for WebLogic Administrator.
- Next to Optional Basic Configuration, select No.
- Under Optional Basic Configuration, set Maximum dynamic cluster size to 10. This value enables you to observe the autoscaling behavior.
Select Next and go to the AKS tab.
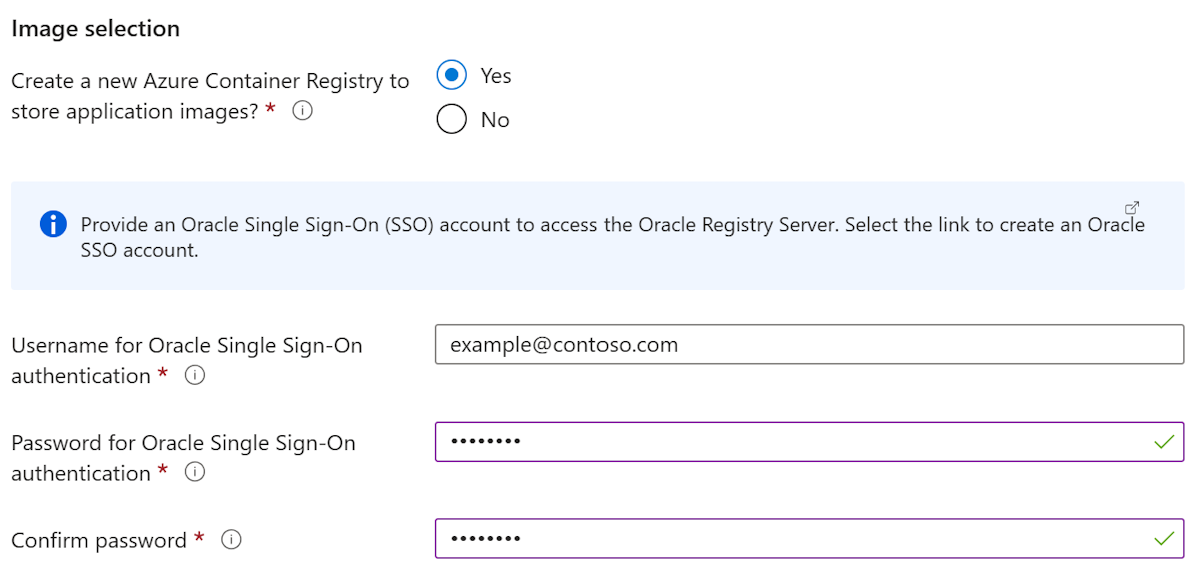
Under Image selection, use the following steps:
- For Username for Oracle Single Sign-On authentication, fill in your Oracle SSO username from the prerequisites.
- For Password for Oracle Single Sign-On authentication, fill in your Oracle SSO credentials from the prerequisites.
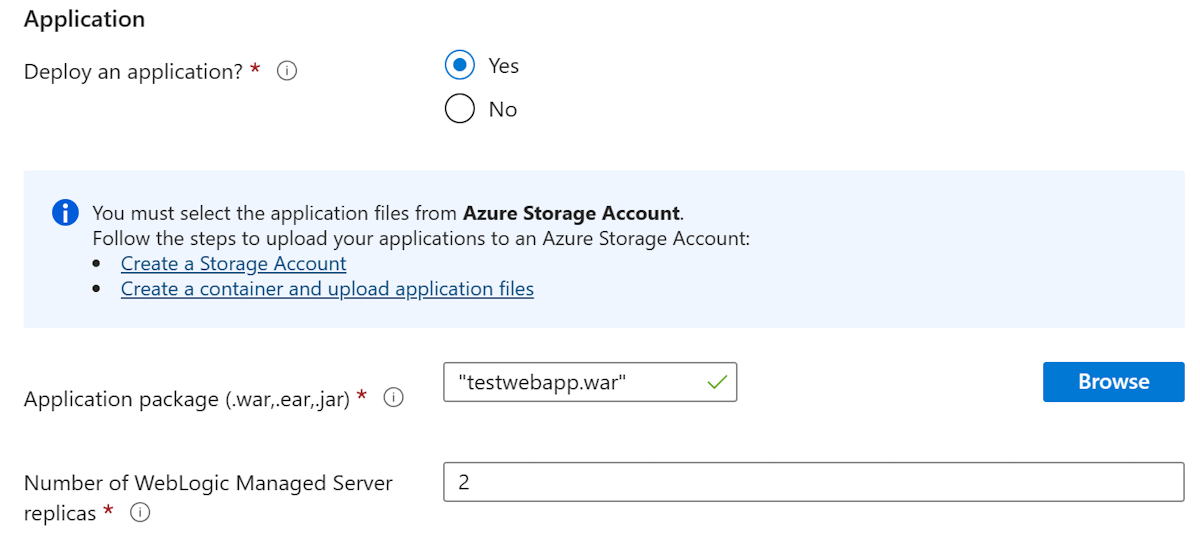
Under Application, use the following steps:
In the Application section, next to Deploy an application?, select Yes.
Next to Application package (.war,.ear,.jar), select Browse.
Start typing the name of the storage account from the preceding section. When the desired storage account appears, select it.
Select the storage container from the preceding section.
Select the checkbox next to testwebapp.war, which you uploaded in the previous section. Select Select.
Select Next.
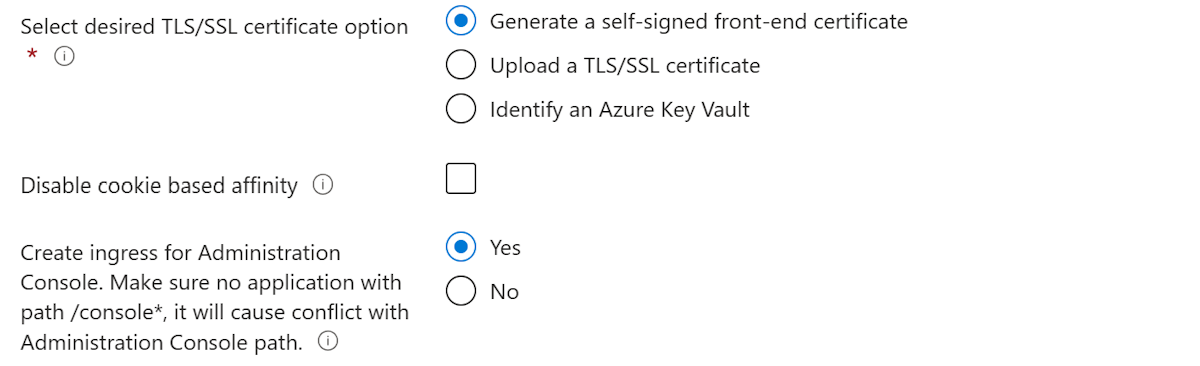
Leave the default values in the TLS/SSL Configuration pane. Select Next to go to the Load Balancing pane, then use the following steps:
- Leave the default values for all option except Create ingress for Administration Console. Make sure no application with path /console*, it will cause conflict with Administration Console path. For this option, select Yes.
- Leave the default values for the remaining fields.
- Select Next.
Leave the default values for the DNS pane, then select Next to go to the Database pane.
Leave the default values for the Database pane, select Next to go to the Autoscaling pane, then use the following steps:
- Next to Provision resources for horizontal autoscaling?, select Yes.
- Under Horizontal autoscaling settings, next to Select autoscaling option., select WebLogic Monitor Exporter (advanced autoscaling).
- Select Review + create.
Wait until Running final validation... successfully completes, then select Create. After a while, you should see the Deployment page where Deployment is in progress is displayed.


If you see any problems during Running final validation..., fix them and try again.
Connect to the AKS cluster
The following sections require a terminal with kubectl installed to manage the WLS cluster. To install kubectl locally, use the az aks install-cli command.
Use the following steps to connect to the AKS cluster:
- Open the Azure portal and go to the resource group that you provisioned in the Deploy WLS on AKS using the Azure Marketplace offer section.
- Select the resource of type Kubernetes service from resource list.
- Select Connect. Guidance to connect the AKS cluster appears.
- Select Azure CLI and follow the steps to connect to the AKS cluster in your local terminal.
Retrieve metrics from the Azure Monitor workspace
Use the following steps to see metrics in the Azure Monitor workspace using Prometheus Query Language (PromQL) queries:
In the Azure portal, view the resource group you used in the Deploy WLS on AKS using the Azure Marketplace offer section.
Select the resource of type Azure Monitor workspace.
Under Managed Prometheus, select Prometheus explorer.
Input
webapp_config_open_sessions_current_countto query the current account of open sessions, as shown in the following screenshot:

Note
You can use the following command to access the metrics by exposing the WebLogic Monitoring Exporter:
cat <<EOF | kubectl apply -f -
apiVersion: v1
kind: Service
metadata:
  name: sample-domain1-cluster-1-exporter
  namespace: sample-domain1-ns
spec:
  ports:
  - name: default
    port: 8080
    protocol: TCP
    targetPort: 8080
  selector:
    weblogic.domainUID: sample-domain1
    weblogic.clusterName: cluster-1
  sessionAffinity: None
  type: LoadBalancer
EOF

kubectl get svc -n sample-domain1-ns -w
Wait for the EXTERNAL-IP column in the row for sample-domain1-cluster-1-exporter to switch from <pending> to an IP address. Then, open the URL http://<exporter-public-ip>:8080/metrics in a browser and sign in with the credentials you specified when deploying the offer. Here, you can find all the available metrics. You can input any of these in the PromQL window to display them in Azure Monitor. For example, heap_free_percent shows an interesting graph. To watch the memory pressure as the load is applied to the application, set Auto refresh and Time range to the smallest possible interval and leave the tab open.
Create the KEDA scaler
Scalers define how and when KEDA should scale a deployment. This article uses the Prometheus scaler to retrieve Prometheus metrics from the Azure Monitor workspace.
This article uses openSessionsCurrentCount as the trigger. The rule for this metric is described as follows. When the average open session count is more than 10, scale up the WLS cluster until it reaches the maximum replica size. Otherwise, scale down the WLS cluster until it reaches its minimum replica size. The following table lists the important parameters:
| Parameter name | Value |
|---|---|
serverAddress |
The Query endpoint of your Azure Monitor workspace. |
metricName |
webapp_config_open_sessions_current_count |
query |
sum(webapp_config_open_sessions_current_count{app="app1"}) |
threshold |
10 |
minReplicaCount |
1 |
maxReplicaCount |
The default value is 5. If you modified the maximum cluster size during offer deployment, replace with your maximum cluster size. |
Because you selected WebLogic Monitoring Exporter at deployment time, a KEDA scaler is ready to deploy. The following steps show you how to configure the KEDA scaler for use with your AKS cluster:
Open the Azure portal and go to the resource group that you provisioned in the Deploy WLS on AKS using the Azure Marketplace offer section.
In the navigation pane, in the Settings section, select Deployments. You see an ordered list of the deployments to this resource group, with the most recent one first.
Scroll to the oldest entry in this list. This entry corresponds to the deployment you started in the previous section. Select the oldest deployment, whose name starts with something similar to
oracle.20210620-wls-on-aks.Select Outputs. This option shows the list of outputs from the deployment.
The kedaScalerServerAddress value is the server address that saves the WLS metrics. KEDA is able to access and retrieve metrics from the address.
The shellCmdtoOutputKedaScalerSample value is the
base64string of a scaler sample. Copy the value and run it in your terminal. The command should look similar to the following example:echo -e YXBpVm...XV0aAo= | base64 -d > scaler.yamlThis command produces a scaler.yaml file in the current directory.
Modify the
metric:andquery:lines in scaler.yaml as shown in the following example:metricName: webapp_config_open_sessions_current_count query: sum(webapp_config_open_sessions_current_count{app="app1"})Note
When you deploy an app with the offer, it's named
app1by default. You can use the following steps to access the WLS admin console to obtain the application name:- Use the preceding steps to view the deployment outputs.
- The adminConsoleExternalUrl value is the fully qualified, public Internet visible link to the WLS admin console. Select the copy icon next to the field value to copy the link to your clipboard.
- Paste the value to your browser and open the WLS admin console.
- Sign in with the WLS admin account, which you saved aside during in the Deploy WLS on AKS using the Azure Marketplace offer section.
- Under Domain Structure, select Deployments. You find app1 listed.
- Select app1 to find that the Name value for the application is
app1. Useapp1as the application name in the query.
If desired, modify the
maxReplicaCount:line in scaler.yaml as shown in the following example. It's an error to set this value higher than what you specified at deployment time on the AKS tab.maxReplicaCount: 10Use the following command to create the KEDA scaler rule by applying scaler.yaml :
kubectl apply -f scaler.yamlIt takes several minutes for KEDA to retrieve metrics from the Azure Monitor workspace. You can watch the scaler status by using the following command:
kubectl get hpa -n sample-domain1-ns -wAfter the scaler is ready to work, the output looks similar to the following content. The value in the
TARGETScolumn switches from<unknown>to0.NAME REFERENCE TARGETS MINPODS MAXPODS REPLICAS AGE keda-hpa-azure-managed-prometheus-scaler Cluster/sample-domain1-cluster-1 0/10 (avg) 1 5 2 15s
Test autoscaling
Now, you're ready to observe the autoscaling capability. This article opens new sessions using curl to access the application. After the average session count is larger than 10, the scaling-up action happens. The sessions last for 150 seconds, and the open session count decreases as the sessions expire. After the average session count is less than 10, the scaling-down action happens. Use the following steps to cause the scaling-up and scaling-down actions:
Use the following steps to obtain the application URL:
- Use the preceding steps to view the deployment outputs.
- The clusterExternalUrl value is the fully qualified, public, internet-visible link to the sample app deployed in WLS on this AKS cluster. To copy the link to your clipboard, select the copy icon next to the field value.
- The URL to access testwebapp.war is
${clusterExternalUrl}testwebapp- for example,http://wlsgw202403-wlsaks0314-domain1.eastus.cloudapp.azure.com/testwebapp/.
Run the
curlcommand to access the application and cause new sessions. The following example opens 22 new sessions. The sessions are expired after 150 seconds. Replace the WLS_CLUSTER_EXTERNAL_URL value with yours.COUNTER=0 MAXCURL=22 WLS_CLUSTER_EXTERNAL_URL="http://wlsgw202403-wlsaks0314-domain1.eastus.cloudapp.azure.com/" APP_URL="${WLS_CLUSTER_EXTERNAL_URL}testwebapp/" while [ $COUNTER -lt $MAXCURL ]; do curl ${APP_URL}; let COUNTER=COUNTER+1; sleep 1;doneIn two separate shells, use the following commands:
Use the following command to observe the scaler:
kubectl get hpa -n sample-domain1-ns -wThis command produces output that looks similar to the following example:
$ kubectl get hpa -n sample-domain1-ns -w
NAME                                       REFERENCE                          TARGETS          MINPODS   MAXPODS   REPLICAS   AGE
keda-hpa-azure-managed-prometheus-scaler   Cluster/sample-domain1-cluster-1   0/10 (avg)       1         10         1         24m
keda-hpa-azure-managed-prometheus-scaler   Cluster/sample-domain1-cluster-1   0/10 (avg)       1         10         1         24m
keda-hpa-azure-managed-prometheus-scaler   Cluster/sample-domain1-cluster-1   5/10 (avg)       1         10         1         26m
keda-hpa-azure-managed-prometheus-scaler   Cluster/sample-domain1-cluster-1   22/10 (avg)      1         10         1         27m
keda-hpa-azure-managed-prometheus-scaler   Cluster/sample-domain1-cluster-1   7334m/10 (avg)   1         10         3         29m
keda-hpa-azure-managed-prometheus-scaler   Cluster/sample-domain1-cluster-1   14667m/10 (avg)  1         10         3         48m
keda-hpa-azure-managed-prometheus-scaler   Cluster/sample-domain1-cluster-1   0/10 (avg)       1         10         3         30m
keda-hpa-azure-managed-prometheus-scaler   Cluster/sample-domain1-cluster-1   0/10 (avg)       1         10         3         35m
keda-hpa-azure-managed-prometheus-scaler   Cluster/sample-domain1-cluster-1   0/10 (avg)       1         10         1         35m
keda-hpa-azure-managed-prometheus-scaler   Cluster/sample-domain1-cluster-1   0/10 (avg)       1         10         5         53m
In a separate shell, use the following command to observe the WLS pods:
kubectl get pod -n sample-domain1-ns -wThis command produces output that looks similar to the following example:
$ kubectl get pod -n sample-domain1-ns -w
NAME                             READY   STATUS              RESTARTS   AGE
sample-domain1-admin-server      2/2     Running             0          28h
sample-domain1-managed-server1   2/2     Running             0          28h
sample-domain1-managed-server1   2/2     Running             0          28h
sample-domain1-managed-server2   0/2     Pending             0          0s
sample-domain1-managed-server2   0/2     Pending             0          0s
sample-domain1-managed-server2   0/2     ContainerCreating   0          0s
sample-domain1-managed-server3   0/2     Pending             0          0s
sample-domain1-managed-server3   0/2     Pending             0          0s
sample-domain1-managed-server3   0/2     ContainerCreating   0          0s
sample-domain1-managed-server3   1/2     Running             0          1s
sample-domain1-admin-server      2/2     Running             0          95m
sample-domain1-managed-server1   2/2     Running             0          94m
sample-domain1-managed-server2   2/2     Running             0          56s
sample-domain1-managed-server3   2/2     Running             0          55s
sample-domain1-managed-server4   1/2     Running             0          9s
sample-domain1-managed-server5   1/2     Running             0          9s
sample-domain1-managed-server5   2/2     Running             0          37s
sample-domain1-managed-server4   2/2     Running             0          42s
sample-domain1-managed-server5   1/2     Terminating         0          6m46s
sample-domain1-managed-server5   1/2     Terminating         0          6m46s
sample-domain1-managed-server4   1/2     Running             0          6m51s
sample-domain1-managed-server4   1/2     Terminating         0          6m53s
sample-domain1-managed-server4   1/2     Terminating         0          6m53s
sample-domain1-managed-server3   1/2     Running             0          7m40s
sample-domain1-managed-server3   1/2     Terminating         0          7m45s
sample-domain1-managed-server3   1/2     Terminating         0          7m45s
The graph in the Azure Monitor workspace looks similar to the following screenshot:

Clean up resources
To avoid Azure charges, you should clean up unnecessary resources. When you no longer need the cluster, use the az group delete command. The following commands remove the resource group, container service, container registry, and all related resources:
az group delete --name <wls-resource-group-name> --yes --no-wait
az group delete --name <ama-resource-group-name> --yes --no-wait
Next steps
Continue to explore the following references for more options to build autoscaling solutions and run WLS on Azure: