Note
Access to this page requires authorization. You can try signing in or changing directories.
Access to this page requires authorization. You can try changing directories.
To see what a Microsoft Foundry project costs, open the project's Monitor page and select the Cost tab. The tab shows the project's cost this month, a month-end forecast, the budget that applies, and the cost of each agent. From there, you can drill into an agent and the model deployments that it uses.
Developers and project leads use these views to find the agents and deployments that drive spending, and to check the limits before they scale up. All costs in these views come from Azure Cost Management, the same data as in the Azure portal, and appear 8 to 24 hours after usage. Token counts and runs come from Azure Monitor within minutes. To see costs across all projects in a subscription, see View subscription costs in the Foundry portal.
Important
Items marked preview in this article are currently in preview. This preview is provided without a service-level agreement, and Microsoft doesn't recommend it for production workloads. Certain features might not be supported or might have constrained capabilities. For more information, see Supplemental Terms of Use for Microsoft Azure Previews.
Prerequisites
A Foundry project with agents or model deployments that have usage in the date range that you want to view.
Access to the project, for example through the Foundry User role. All Foundry roles let you open the Monitor page and see usage, such as tokens and runs.
To see costs, Cost Management Reader, or another role with Cost Management read access, such as Reader, Owner, or Contributor. Foundry roles don't include it. Assign it on the resource group that contains the Foundry resource to see Latest billed cost and Month-end forecast. To also see the costs of agents and model deployments, assign it on the subscription. A role on only the project or the Foundry resource isn't enough, and the cost cards ask for access.
To see usage against cost controls, an Application Insights resource for the cost controls on the Foundry resource, and read access to it, for example through Monitoring Reader or Log Analytics Reader. Cost data doesn't need Application Insights.
For the permission behind each card, see Permissions for cost data and cost controls. To assign a role, see Assign Azure roles using the Azure portal.
Important
The Foundry RBAC roles were recently renamed. Foundry User, Foundry Owner, Foundry Account Owner, and Foundry Project Manager were previously named Azure AI User, Azure AI Owner, Azure AI Account Owner, and Azure AI Project Manager. You might still see the previous names in some places while the rename rolls out. The role IDs and core permissions are unchanged by the rename.
Open your project's costs
Open the Cost tab directly, or start from the Estimated cost card on the project's Overview tab.
-
Sign in to Microsoft Foundry. Make sure the New Foundry toggle is on. These steps refer to Foundry (new).

Select your project, for example from the project selector at the top left of the page.
Make sure that Build is selected in the upper-right navigation.
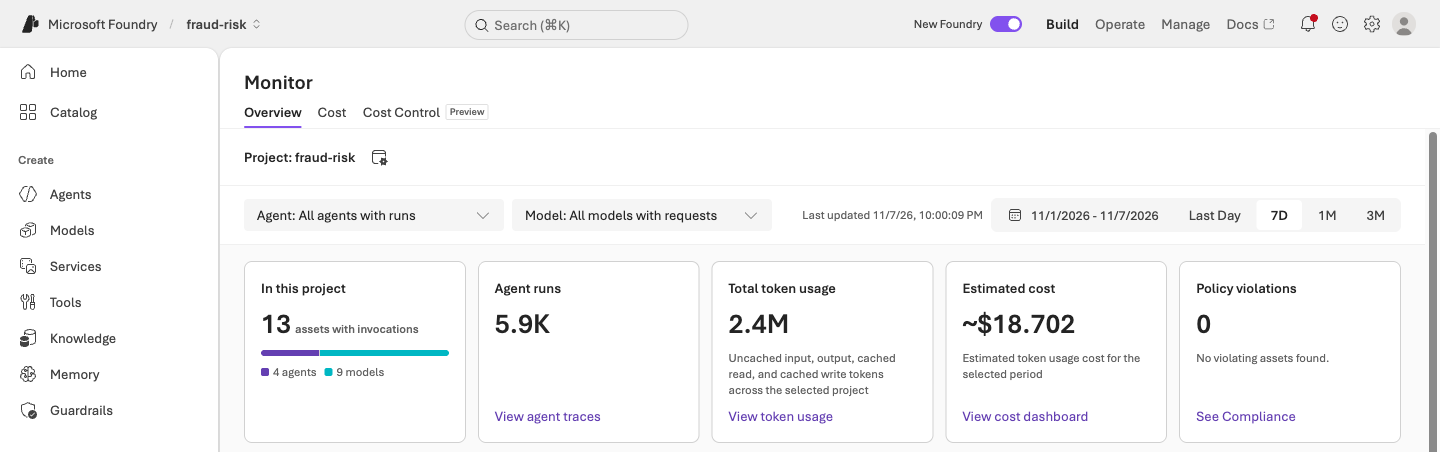
In the left pane, select Monitor. The Overview tab opens. It has Agent and Model filters and the cards In this project, Agent runs, Total token usage, Estimated cost, and Policy violations.
Note
The costs shown in the images in this article are examples only and don't reflect actual prices. For current prices, see Microsoft Foundry pricing.
Select the Cost tab. Or, on the Estimated cost card, select View cost dashboard.
Select a date range: Last Day, 7D, 1M, or 3M. To set custom dates, select the date range picker. Last updated shows when the data was last refreshed.
Understand the project cost view
The Cost tab shows five cards above the Cost by agent table. Azure Cost Management provides the costs, Azure Monitor provides the token and run counts, and Foundry cost controls provide the budget card.
| Card | What it shows |
|---|---|
| Latest billed cost | The project's cost so far this month, updated daily. |
| Month-end forecast | The project's projected cost at the end of the month. |
| Project budget | The budget of the cost control that applies to the project, if any. For details, see Check the limits that apply to your project. |
| Total token usage | Tokens in the selected period, broken down into uncached input, output, and cached read and write tokens. |
| Cost per successful run | The average cost of a successful agent run, and the number of successful runs. |
Latest billed cost and Month-end forecast cover only this project. They need billed usage and some billing history, so they can be empty for a new project.
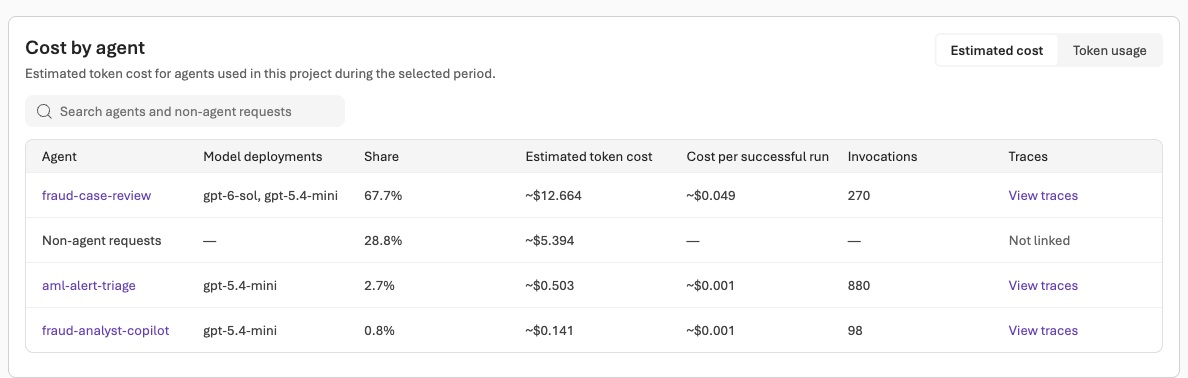
Cost by agent lists the cost of each agent that had usage in the selected period, across all its versions. Its columns are Agent, Model deployments, Share, Estimated token cost, Cost per successful run, Invocations, and Traces.
- Estimated token cost is the cost of the agent's model calls. When an agent calls a model, Foundry tags the usage with the agent's name, and the tagged cost counts toward the agent. It counts all agent runs, whether or not they're traced.
- The Non-agent requests row covers the project's model cost that isn't tagged with an agent, such as direct calls to a model deployment. Billing data includes agent names starting in November 2026, so earlier agent usage also appears in this row.
- To see tokens instead of cost, select Token usage. To switch back, select Estimated cost.
- To find an agent, enter its name in the search box.
Note
If an agent calls a model deployment in a different Foundry resource, those calls are billed to the other Foundry resource, and they aren't included in the agent's cost. To check their cost, open the model deployment's cost view in the other Foundry resource.
The tab might show this note: "External usage is reported by an asset that is hosted outside this Foundry project." That usage isn't included in the cards or in Cost by agent. To see it, open the trace view of the external agent.
View costs for an agent
An agent's cost view shows its cost over time and the cost of each model deployment that it uses, across all its versions. Like the Cost tab, it uses Azure Cost Management data, so cost appears 8 to 24 hours after usage.
On the Cost tab, in Cost by agent, select the agent's name. The agent's Monitor tab opens on its Cost view, with the same date range.
To start from the agent instead, select Agents in the left pane, select the agent, select Monitor, and then select Cost.
Review the cards: Agent cost, Model token usage, Agent runs, and Average Agent Cost / run.
In Agent cost breakdown, select Total cost, Token usage, Runs, or Cost per run to chart that measure over time.
In Deployment cost breakdown, review the cost of each model deployment that the agent uses. The table shows the Deployment, the Agent version values that use it, the Model, Total cost, Token usage, and input, output, cached read, and cached write tokens. To change the order, use Sort by, for example Total cost (High to low).
An agent's cost covers its model calls. Tools that bill on their own meters, hosted agent compute, and dependent resources such as Foundry IQ (Azure AI Search), aren't included. For details, see How agents are billed.
View costs for a model deployment
A model deployment's cost view shows its cost and which agents use it. As in the agent view, costs come from Azure Cost Management.
In the agent's Deployment cost breakdown, select a deployment name.
To start from the deployment instead, select Models in the left pane, select the deployment, select Monitor, and then select Cost.
Review the cards: Model cost, Model Token Usage, Requests, and Average cost / request. Times use your local time zone.
In Cost trend, select Model cost, Token usage, Requests, Cost per request, or Model cost per agent to chart that measure.
In Model deployment cost breakdown, review the deployment's Total cost, Token usage, input, output, and cached tokens, Requests, and Cost/request.
In Top consumers, see which agent versions use the deployment, with their Runs, Token usage, Estimated cost, and Cost share. Calls that don't come from an agent appear as Non-agent requests.
To see the Foundry resource's billed cost by meter, select the Azure Cost Management link at the bottom of the page.
Model router runs as a single model deployment, so you open its cost view the same way. Its cost view breaks down cost by the models that model router routes to.
Check the limits that apply to your project
A cost control sends an alert or blocks requests when spending or token usage reaches a budget. Before you scale up usage, check which limits apply to your project. Start with the Project budget card on the Cost tab, and then open the Cost Control tab.
The Project budget card shows Foundry cost controls, not Azure Cost Management budgets that you set in the Azure portal. It covers the project's own cost controls and the Foundry resource's cost controls that apply to the project:
| When | What the card shows |
|---|---|
| A cost control applies to the project. | The budget amount and period, how much is used, and the action, for example "Blocks at 100%." |
| Several cost controls apply. | The lowest budget, for example "Lowest of 2 cost controls," and a count of any budgets per agent or session. |
| No cost control applies. | "No project-level budget set" and a Create a cost control link. |
To see the cost controls behind the card, select Manage cost controls.
To see each cost control for the project and how close it is to its limit:
- On the Monitor page, select the Cost Control tab. The tab lists the project's cost controls and the Foundry resource's cost controls that apply to the project.
- Review each cost control's Policy name, Applies to, Budget, Start date, and End date. The Foundry resource's cost controls are marked with a badge, and you can view them but not edit them here.
- Check Closest to limit (estimated) and State. For what each state means, see Cost control states.
- If Closest to limit (estimated) shows Usage unavailable or Permission required, Application Insights isn't set up for the Foundry resource's cost controls, or you can't read it. Ask an admin of the Foundry resource to set it up, or to give you Monitoring Reader or Log Analytics Reader on it.
You don't need permission to create or edit cost controls to see the ones that apply to your project. All Foundry roles, and Reader, can view them. To create or change a cost control, see Create and manage cost controls.
Troubleshoot
| Symptom | Cause | Fix |
|---|---|---|
| Latest billed cost and Month-end forecast say that the request requires access on the resource group. | You don't have Cost Management read access on the resource group that contains the Foundry resource. A role on only the project or the Foundry resource isn't enough. | Ask an admin for Cost Management Reader on the subscription, or another role in Prerequisites assigned there. Then refresh the page. Usage stays available in the meantime. |
| Latest billed cost shows cost, but the costs of agents and model deployments don't load. | Your Cost Management read access is on the resource group. The Foundry portal reads the costs of agents and model deployments at the subscription. | Ask an admin for Cost Management Reader on the subscription, or another role in Prerequisites assigned there. |
| Latest billed cost says "No project-tagged billed usage this month yet." | Azure Cost Management has no cost tagged with this project for the current month yet. Cost appears 8 to 24 hours after usage. Usage of models that don't support project-level cost attribution isn't tagged with the project. | Check again later. To analyze untagged costs, see Analyze Foundry costs in Azure Cost Management. |
| Month-end forecast says "Not enough billing history to forecast yet." | The forecast is based on billing data, and a new project doesn't have enough yet. | Check again after more billed usage builds up. Meanwhile, use Latest billed cost and Cost by agent. |
| Cost by agent is empty, or recent runs are missing from it. | There was no agent usage in the date range, or cost for the most recent runs hasn't arrived yet. Cost appears 8 to 24 hours after usage. | Select a longer date range, or check again later. To see recent runs now, select Token usage. |
| An agent's cost looks too low, or it's missing. | The agent calls a model deployment in a different Foundry resource, or the usage happened before billing data included agent names, in November 2026. | Check the cost of the model deployment that the agent calls. If it's in another Foundry resource, check it there. |
| The cost on the Cost tab doesn't match a cost control's usage. | Cost controls estimate spending in real time, with a snapshot of your negotiated prices. During public preview, they aren't reconciled with your bill. The billed cost cards show Azure Cost Management data, 8 to 24 hours after usage. | No fix is needed. For details, see How cost controls price usage. |
| A Claude deployment shows token usage and requests, but no cost chart. | Existing Claude deployments that use per-model token billing don't show cost here. The chart is available for Claude deployments billed in Claude Consumption Units (CCU). | Use Azure Cost Management, which shows the cost for both billing types. For details, see Claude Consumption Units (CCU) billing in Microsoft Foundry. |
| Closest to limit (estimated) shows Usage unavailable or Permission required. | Application Insights isn't set up for the Foundry resource's cost controls, or you can't read it. | Ask an admin of the Foundry resource to select an Application Insights resource under Usage data, or to give you Monitoring Reader or Log Analytics Reader on it. |
Related content
- To see spending across all projects in a subscription, see View subscription costs in the Foundry portal.
- To set a budget that alerts on or blocks spending, see Create and manage cost controls.
- To reconcile cost, see Analyze Foundry costs in Azure Cost Management.
- To find the role for each card, see Permissions for cost data and cost controls.
- To reduce what your agents and models cost, see Cost optimization overview.