Diagnose failing load tests in Azure Load Testing
In this article, you learn how to diagnose and troubleshoot failing load tests in Azure Load Testing. Azure Load Testing provides several options to identify the root cause of a failing load test. For example, you can use the load test dashboard, or download the test results or test log files for an in-depth analysis. Alternately, configure server-side metrics to identify issues with application endpoint.
Azure Load Testing uses two indicators to determine the outcome of a load test:
Test status: indicates whether the load test was able to start successfully and run the test script until the end. For example, the test status is Failed if there's an error in the JMeter test script, or if the autostop listener interrupted the load test because too many requests failed.
Test result: indicates the result of evaluating the test fail criteria. If at least one of the test fail criteria was met, the test result is set to Failed.
Depending on the indicator, you can use a different approach to identify the root cause of a test failure.
Prerequisites
- An Azure account with an active subscription. If you don't have an Azure subscription, create a free account before you begin.
- An Azure load testing resource that has a completed test run. If you need to create an Azure load testing resource, see Create and run a load test.
Determine the outcome of a load test
Use the following steps to get the outcome of a load test:
In the Azure portal, and go to your load testing resource.
Select Tests in the left pane, to view the list of tests.
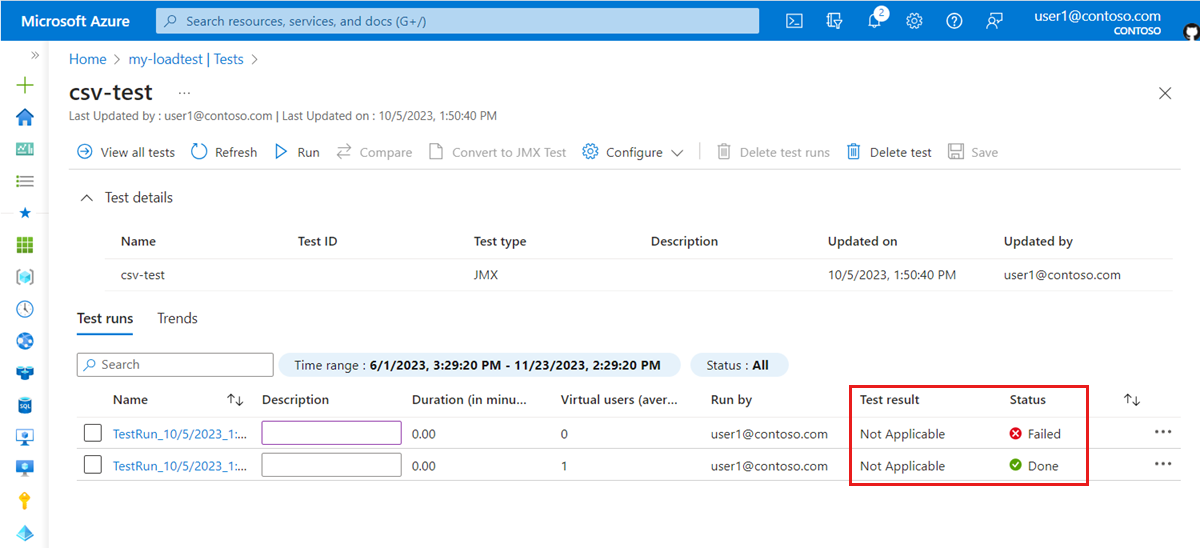
Select a test from the list to view all test runs for that test.
The list of test runs shows the Test result and Test status fields.
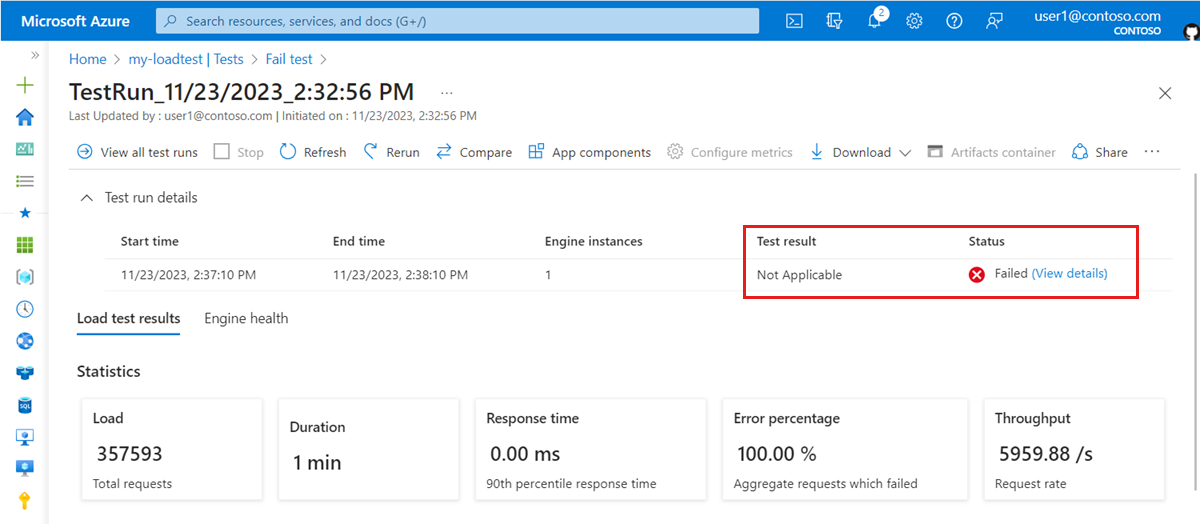
Alternately, select a test run to view the load test dashboard for the test run.


Diagnose test failures
You can use a different approach for diagnosing a load test failure based whether Azure Load Testing was able to run and complete the test script or not.
Load test failed to complete
When the load test fails to complete, the test status of the test run is set to Failed.
A load test can fail to complete because of multiple reasons. Examples of why a load test doesn't finish:
- There are errors in the JMeter test script.
- The test script uses JMeter features that Azure Load Testing doesn't support. Learn about the supported JMeter features.
- The test script references a file or plugin that isn't available on the test engine instance.
- The autostop functionality interrupted the load test because too many requests are failing and the error rate exceeds the threshold. Learn more about the autostop functionality in Azure Load Testing.
Use the following steps to help diagnose a test not finishing:
- Verify the error details on the load test dashboard.
- Download and analyze the test logs to identify issues in the JMeter test script.
- Download the test results to identify issues with individual requests.
Load test completed
A load test might run the test script until the end (test status equals Done), but might not pass all the test fail criteria. If at least one of the test criteria didn't pass, the test result of the test run is set to Failed.
Use the following steps to help diagnose a test failing to meet the test criteria:
- Review the test fail criteria in the load test dashboard.
- Review the sampler statistics in the load test dashboard to further identify which requests in the test script might cause an issue.
- Review the client-side metrics in the load test dashboard. Optionally, you can filter the charts for a specific request by using the filter controls.
- Download the test results to get error information for individual requests.
- Verify the test engine health metrics to identify possible resource contention on the test engines.
- Optionally, add app components and monitor server-side metrics to identify performance bottlenecks for the application endpoint.
Download Apache JMeter worker logs for your load test
When you run a load test, the Azure Load Testing test engines execute your Apache JMeter test script. During the load test, Apache JMeter stores detailed logging in the worker node logs. You can download these JMeter worker logs for each test run in the Azure portal. Azure Load Testing generates a worker log for each test engine instance.
Note
Azure Load Testing only records log messages with WARN or ERROR level in the worker logs.
For example, if there's a problem with your JMeter script, the load test status is Failed. In the worker logs you might find additional information about the cause of the problem.
To download the worker logs for an Azure Load Testing test run, follow these steps:
In the Azure portal, go to your Azure Load Testing resource.
Select Tests to view the list of tests, and then select your load test from the list.
From the list of test runs, select a test run to view the load test dashboard.
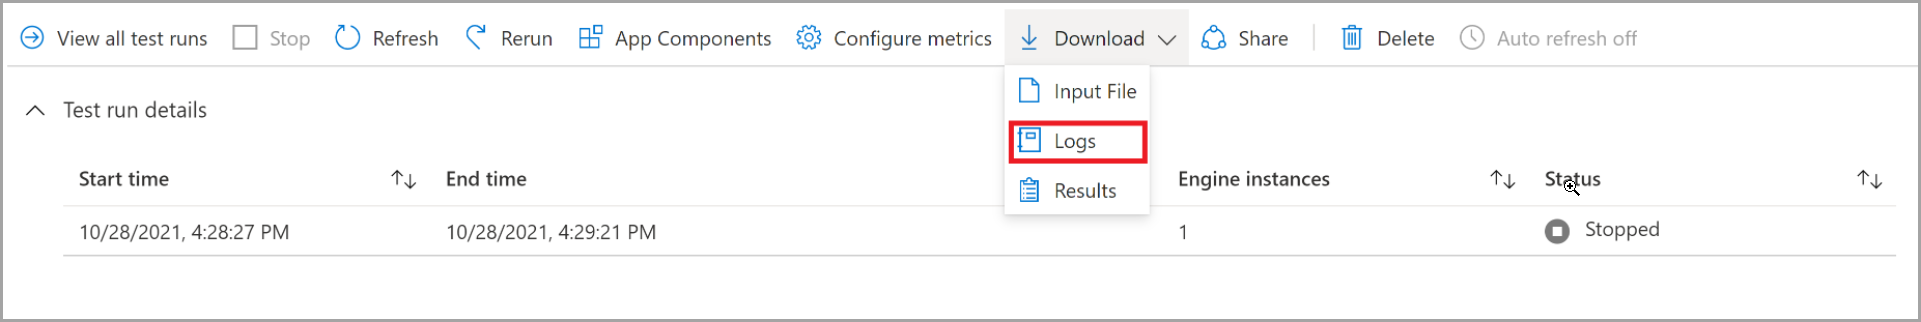
On the dashboard, select Download, and then select Logs.
The browser should now start downloading a zipped folder that contains the JMeter worker node log file for each test engine instance.
You can use any zip tool to extract the folder and access the log files.
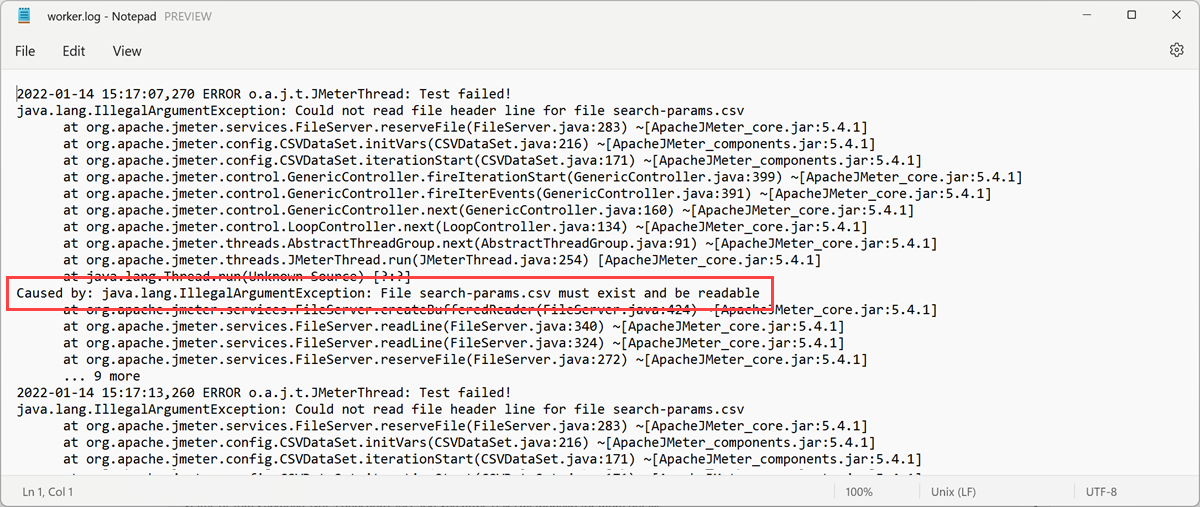
The worker.log file can help you diagnose the root cause of a failing load test. In the screenshot, you can see that the test failed because of a missing file.
Related content
- Learn how to export the load test result.
- Learn how to monitor server-side application metrics.
- Learn how to get detailed insights for Azure App Service based applications.
- Learn how to compare multiple load test runs.
Feedback
Coming soon: Throughout 2024 we will be phasing out GitHub Issues as the feedback mechanism for content and replacing it with a new feedback system. For more information see: https://aka.ms/ContentUserFeedback.
Submit and view feedback for