Note
Access to this page requires authorization. You can try signing in or changing directories.
Access to this page requires authorization. You can try changing directories.
Take advantage of threat intelligence produced by Microsoft to generate high-fidelity alerts and incidents with the Microsoft Defender Threat Intelligence Analytics rule. This built-in rule in Microsoft Sentinel matches indicators with Common Event Format (CEF) logs, Windows DNS events with domain and IPv4 threat indicators, syslog data, and more.
Prerequisites
You must install one or more of the supported data connectors to produce high-fidelity alerts and incidents. A premium Microsoft Defender Threat Intelligence license isn't required. Install the appropriate solutions from the Content hub to connect these data sources:
- Common Event Format (CEF) via Legacy Agent
- Windows DNS via Legacy Agent (Preview)
- Syslog via Legacy Agent
- Microsoft 365 (formerly, Office 365)
- Azure activity logs
- Windows DNS via AMA
- ASIM Network sessions
For example, depending on your data source, you might use the following solutions and data connectors:
Configure the matching analytics rule
Matching analytics is configured when you enable the Microsoft Defender Threat Intelligence Analytics rule.
Under the Configuration section, select the Analytics menu.
Select the Rule templates tab.
In the search window, enter threat intelligence.
Select the Microsoft Defender Threat Intelligence Analytics rule template.
Select Create rule. The rule details are read only, and the default status of the rule is enabled.
Select Review > Create.

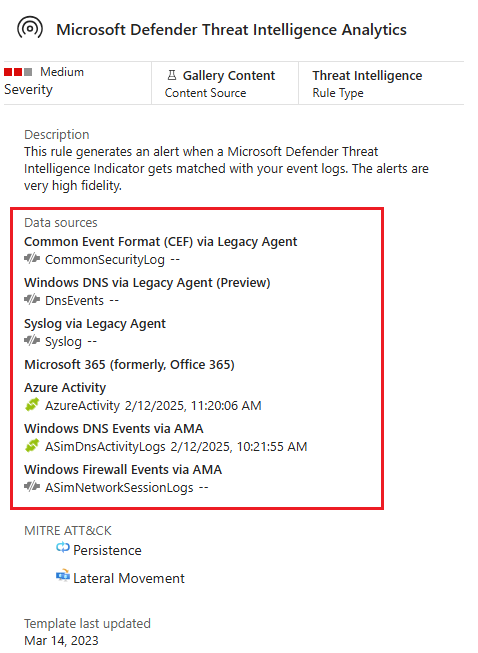
Data sources and indicators
Microsoft Defender Threat Intelligence Analytics matches your logs with domain, IP, and URL indicators in the following ways:
- CEF logs ingested into the Log Analytics
CommonSecurityLogtable match URL and domain indicators if populated in theRequestURLfield, and IPv4 indicators in theDestinationIPfield. - Windows DNS logs, where
SubType == "LookupQuery"ingested into theDnsEventstable matches domain indicators populated in theNamefield, and IPv4 indicators in theIPAddressesfield. - Syslog events, where
Facility == "cron"ingested into theSyslogtable matches domain and IPv4 indicators directly from theSyslogMessagefield. - Office activity logs ingested into the
OfficeActivitytable match IPv4 indicators directly from theClientIPfield. - Azure activity logs ingested into the
AzureActivitytable match IPv4 indicators directly from theCallerIpAddressfield. - ASIM DNS logs ingested into the
ASimDnsActivityLogstable match domain indicators if populated in theDnsQueryfield, and IPv4 indicators in theDnsResponseNamefield. - ASIM Network Sessions ingested into the
ASimNetworkSessionLogstable match IPv4 indicators if populated in one or more of the following fields:DstIpAddr,DstNatIpAddr,SrcNatIpAddr,SrcIpAddr,DvcIpAddr.
Triage an incident generated by matching analytics
If Microsoft's analytics finds a match, any alerts generated are grouped into incidents.
Use the following steps to triage through the incidents generated by the Microsoft Defender Threat Intelligence Analytics rule:
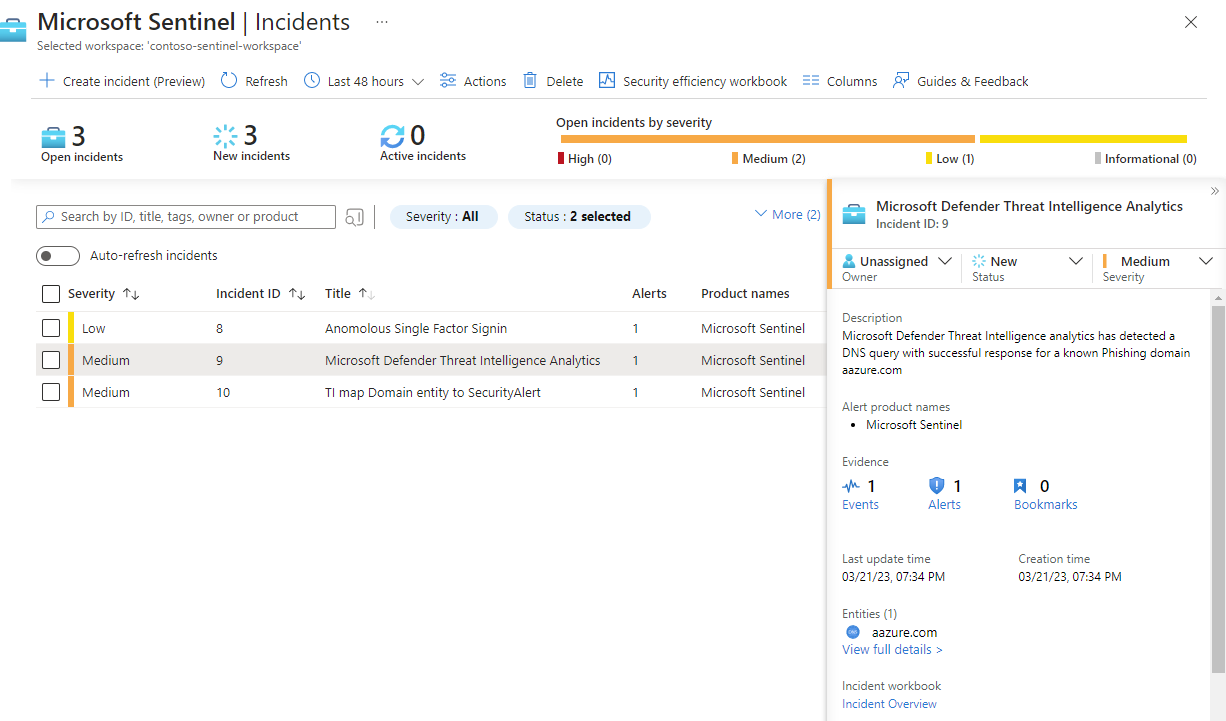
In the Microsoft Sentinel workspace where you enabled the Microsoft Defender Threat Intelligence Analytics rule, select Incidents, and search for Microsoft Defender Threat Intelligence Analytics.
Any incidents that are found appear in the grid.
Select View full details to view entities and other details about the incident, such as specific alerts.
Here's an example.
Observe the severity assigned to the alerts and the incident. Depending on how the indicator is matched, an appropriate severity is assigned to an alert from
InformationaltoHigh. For example, if the indicator is matched with firewall logs that allowed the traffic, a high-severity alert is generated. If the same indicator was matched with firewall logs that blocked the traffic, the generated alert is low or medium.Alerts are then grouped on a per-observable basis of the indicator. For example, all alerts generated in a 24-hour time period that match the
contoso.comdomain are grouped into a single incident with a severity assigned based on the highest alert severity.Observe the indicator information. When a match is found, the indicator is published to the Log Analytics
ThreatIntelligenceIndicatorstable, and it appears on the Threat Intelligence page. For any indicators published from this rule, the source is defined asMicrosoft Threat Intelligence Analytics.
Here's an example of the ThreatIntelligenceIndicators table.

Here's an example of searching for the indicators in the management interface.

Get more context from Microsoft Defender Threat Intelligence
Along with high-fidelity alerts and incidents, some Microsoft Defender Threat Intelligence indicators include a link to a reference article in Intel Explorer.
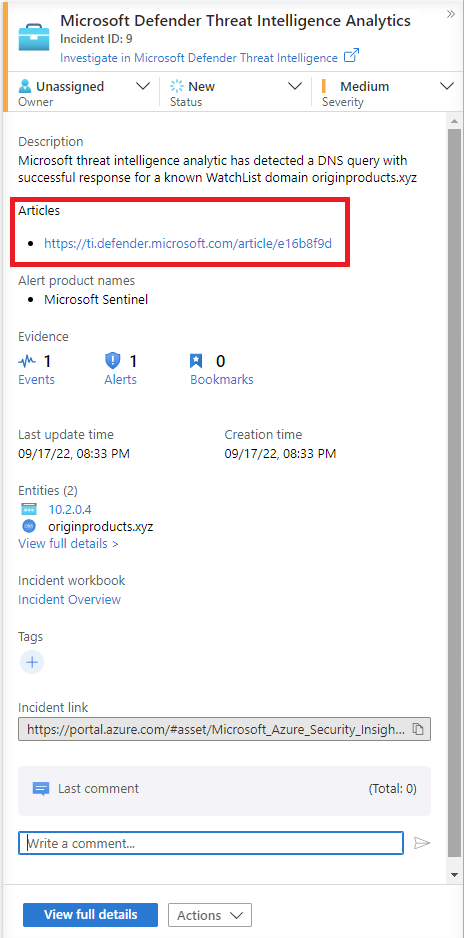
For more information, see Searching and pivoting with Intel Explorer.
Related content
In this article, you learned how to connect threat intelligence produced by Microsoft to generate alerts and incidents. For more information about threat intelligence in Microsoft Sentinel, see the following articles:
- Work with threat indicators in Microsoft Sentinel.
- Connect Microsoft Sentinel to STIX/TAXII threat intelligence feeds.
- Connect threat intelligence platforms to Microsoft Sentinel.
- See which TIP platforms, TAXII feeds, and enrichments can be readily integrated with Microsoft Sentinel.