Note
Access to this page requires authorization. You can try signing in or changing directories.
Access to this page requires authorization. You can try changing directories.
The no-code editor makes it easy to develop a Stream Analytics job to process your real-time streaming data. Use drag-and-drop functionality without writing any code. The experience provides a canvas where you can connect to input sources to quickly see your streaming data. Then you can transform it before writing to your destinations.
By using the no-code editor, you can easily:
- Modify input schemas.
- Perform data preparation operations like joins and filters.
- Approach advanced scenarios like time-window aggregations (tumbling, hopping, and session windows) for group-by operations.
After you create and run your Stream Analytics jobs, you can easily operationalize production workloads. Use the right set of built-in metrics for monitoring and troubleshooting purposes. Stream Analytics jobs are billed according to the pricing model when they're running.
Prerequisites
Before you develop your Stream Analytics jobs by using the no-code editor, make sure you meet these requirements:
- The streaming input sources and target destination resources for the Stream Analytics job must be publicly accessible and can't be in an Azure virtual network.
- You must have the required permissions to access the streaming input and output resources.
- You must maintain permissions to create and modify Azure Stream Analytics resources.
Note
The no-code editor isn't currently available in the China region.
Azure Stream Analytics job
A Stream Analytics job is built on three main components: streaming inputs, transformations, and outputs. You can include as many components as you want, such as multiple inputs, parallel branches with multiple transformations, and multiple outputs. For more information, see Azure Stream Analytics documentation.
Note
The following functionalities and output types aren't available when you use the no-code editor:
- User-defined functions.
- Query editing in Azure Stream Analytics query page. However, you can view the query generated by the no-code editor in query page.
- Adding inputs and outputs in Azure Stream Analytics input and output pages. However, you can view the inputs and outputs generated by the no-code editor in input and output page.
- The following output types aren't available: Azure Function, Azure Data Lake Storage Gen1, PostgreSQL DB, Service Bus queue/topic, Table storage.
To access the no-code editor for building your stream analytics job, use one of the following approaches:
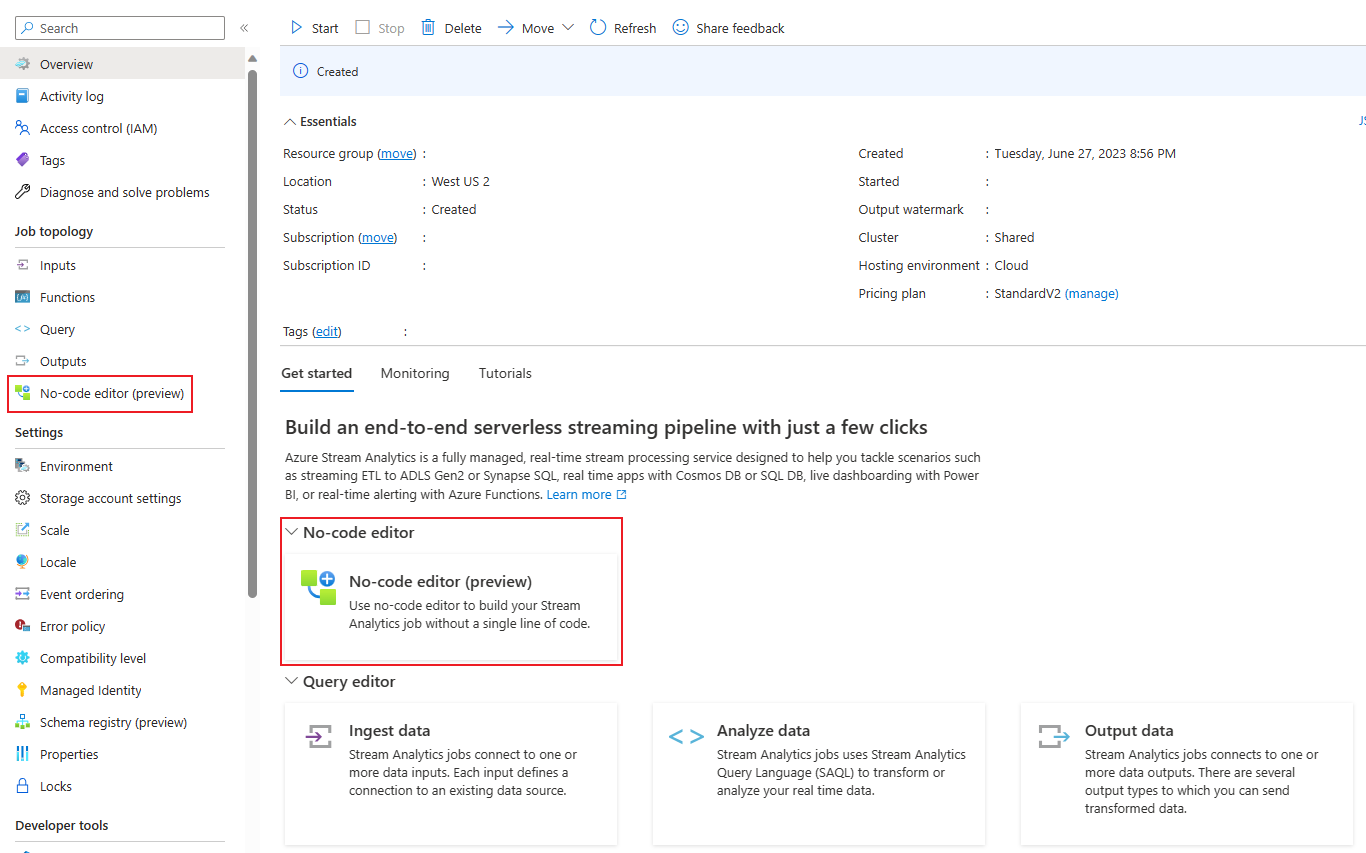
Through Azure Stream Analytics portal (preview): Create a Stream Analytics job, and then select the no-code editor in the Get started tab in Overview page, or select No-code editor in the left panel.
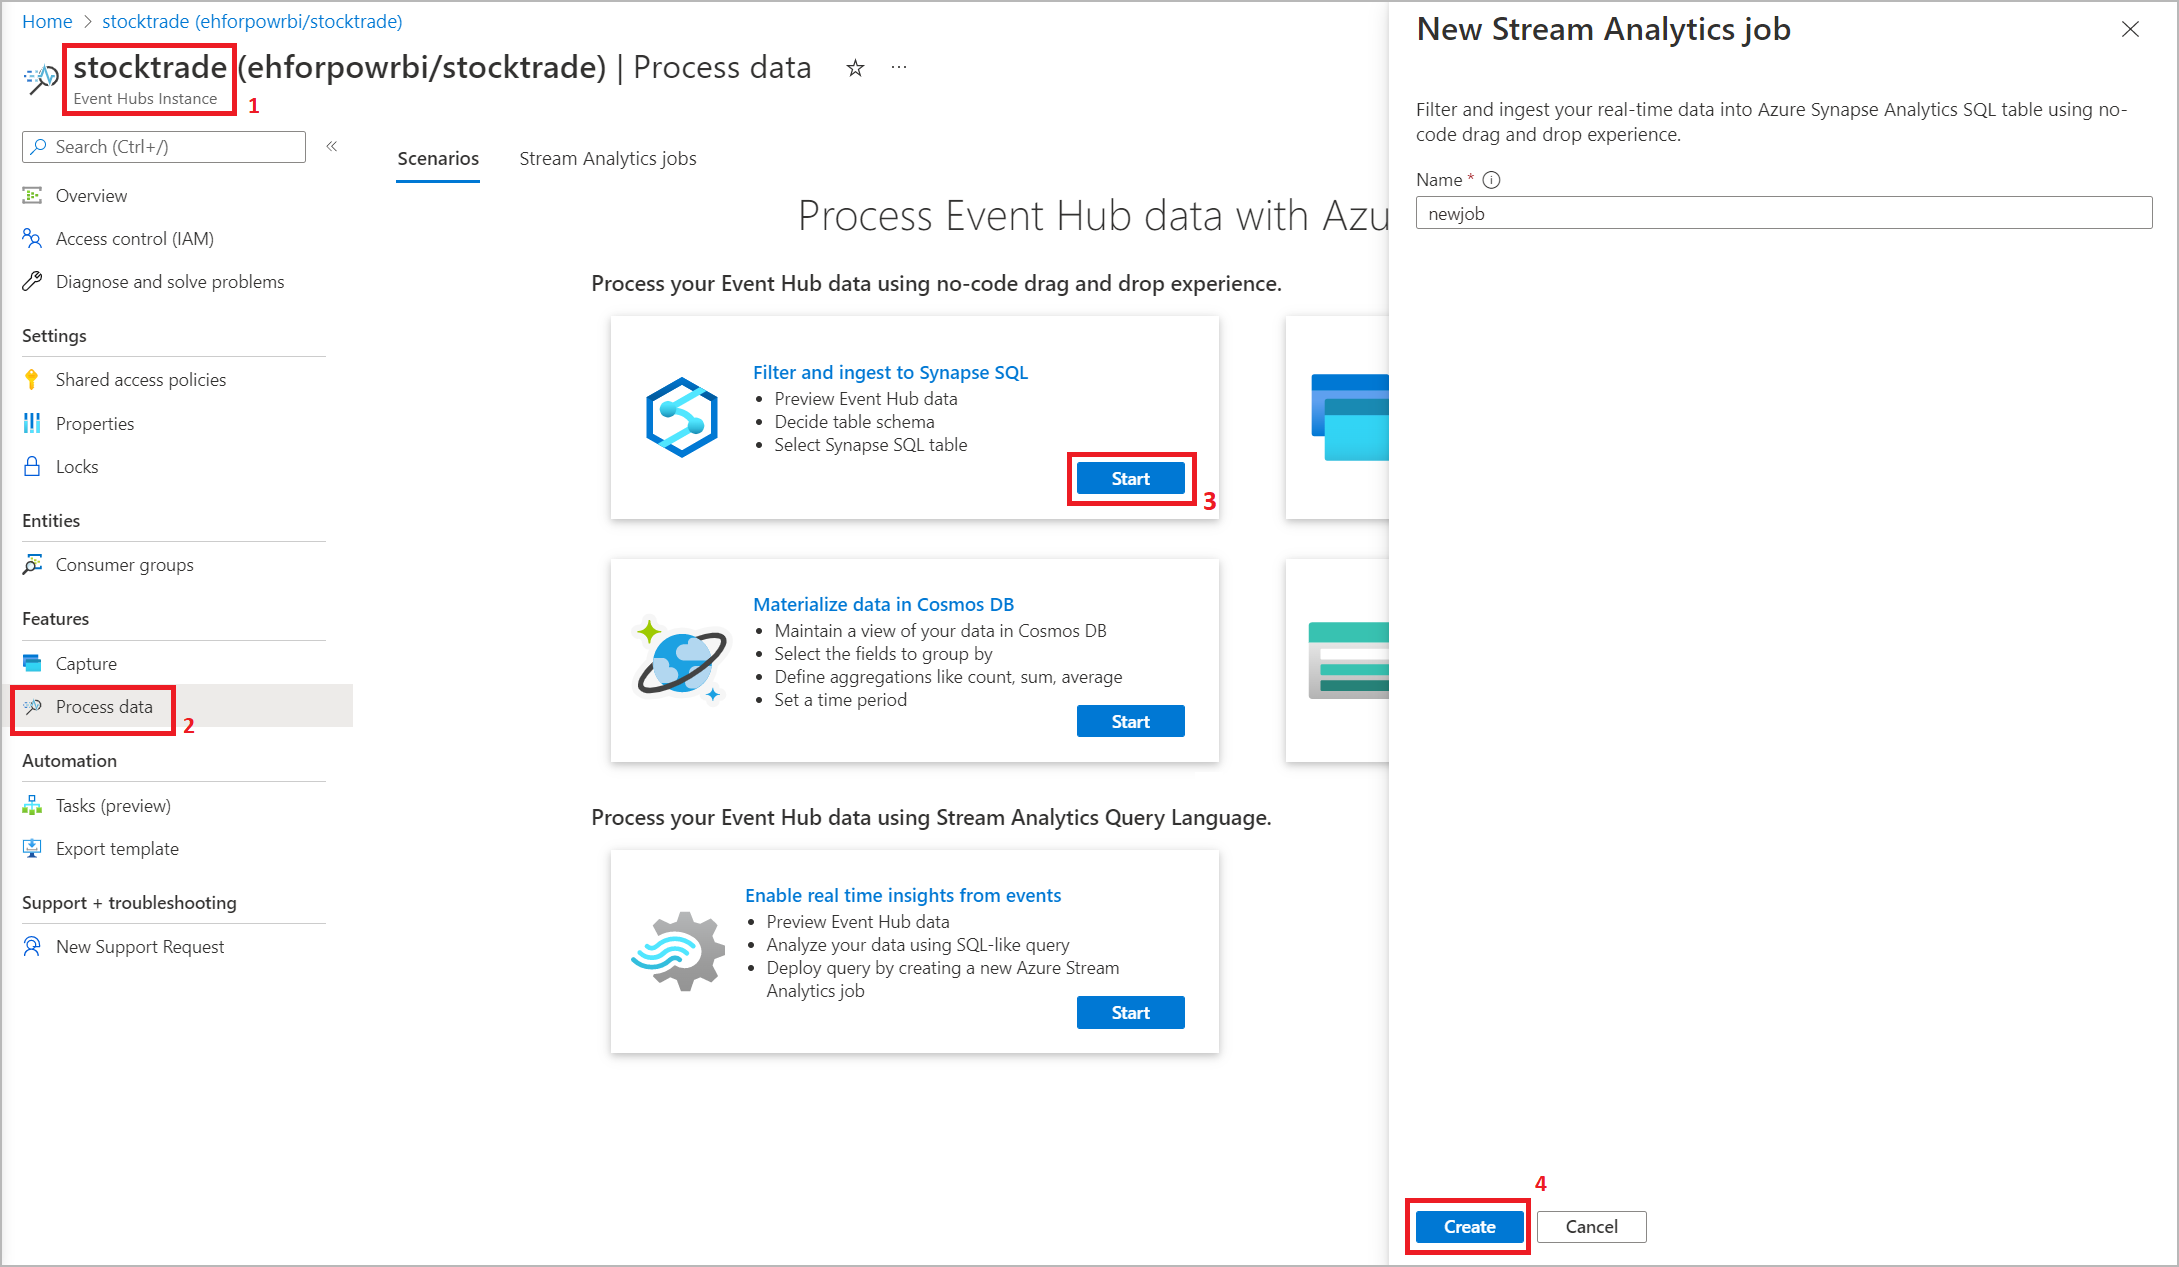
Through Azure Event Hubs portal: Open an Event Hubs instance. Select Process Data, and then select any predefined template.
The predefined templates can help you develop and run a job to address various scenarios, including:
- Capture data from Event Hubs in Delta Lake format (preview)
- Filtering and ingesting to Azure Synapse SQL
- Capturing your Event Hubs data in Parquet format in Azure Data Lake Storage Gen2
- Materializing data in Azure Cosmos DB
- Filter and ingest to Azure Data Lake Storage Gen2
- Enrich data and ingest to event hub
- Transform and store data to Azure SQL database
- Filter and ingest to Azure Data Explorer


The following screenshot shows a completed Stream Analytics job. It highlights all the sections available to you as you author.

- Ribbon: On the ribbon, sections follow the order of a classic analytics process: an event hub as input (also known as a data source), transformations (streaming Extract, Transform, and Load operations), outputs, a button to save your progress, and a button to start the job.
- Diagram view: This view is a graphical representation of your Stream Analytics job, from input to operations to outputs.
- Side pane: Depending on which component you select in the diagram view, you see settings to modify input, transformation, or output.
- Tabs for data preview, authoring errors, runtime logs, and metrics: For each tile, the data preview shows you results for that step (live for inputs; on demand for transformations and outputs). This section also summarizes any authoring errors or warnings that you might have in your job when it's being developed. Selecting each error or warning selects that transform. It also provides the job metrics for you to monitor the running job's health.
Streaming data input
The no-code editor supports streaming data input from three types of resources:
- Azure Event Hubs
- Azure IoT Hub
- Azure Data Lake Storage Gen2
For more information about the streaming data inputs, see Stream data as input into Stream Analytics.
Note
The no-code editor in the Azure Event Hubs portal only has Event Hub as an input option.

Azure Event Hubs as streaming input
Azure Event Hubs is a big-data streaming platform and event ingestion service. It can receive and process millions of events per second. You can transform and store data sent to an event hub through any real-time analytics provider or batching and storage adapter.
To configure an event hub as an input for your job, select the Event Hub icon. A tile appears in the diagram view, including a side pane for its configuration and connection.
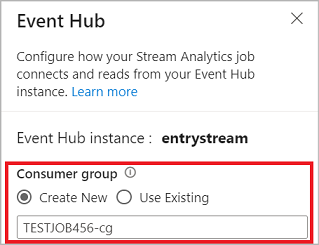
When you connect to your event hub in the no-code editor, create a new consumer group (which is the default option). This approach helps prevent the event hub from reaching the concurrent readers limit. To understand more about consumer groups and whether you should select an existing consumer group or create a new one, see Consumer groups.
If your event hub is in the Basic tier, you can use only the existing $Default consumer group. If your event hub is in a Standard or Premium tier, you can create a new consumer group.
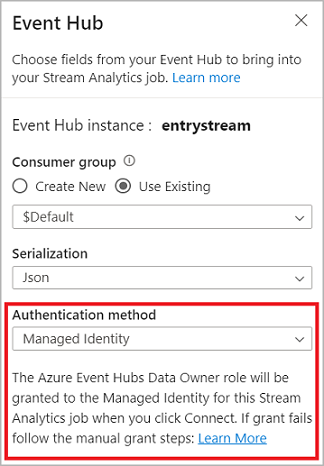
When you connect to the event hub, if you select Managed Identity as the authentication mode, the Azure Event Hubs Data Owner role is granted to the managed identity for the Stream Analytics job. To learn more about managed identities for an event hub, see Use managed identities to access an event hub from an Azure Stream Analytics job.
Managed identities eliminate the limitations of user-based authentication methods. These limitations include the need to reauthenticate because of password changes or user token expirations that occur every 90 days.
After you set up your event hub's details and select Connect, you can add fields manually by using + Add field if you know the field names. To instead detect fields and data types automatically based on a sample of the incoming messages, select Autodetect fields. Selecting the gear symbol allows you to edit the credentials if needed.
When Stream Analytics jobs detect the fields, you see them in the list. You also see a live preview of the incoming messages in the Data Preview table under the diagram view.
Modify input data
You can edit the field names, remove fields, change the data type, or change the event time (Mark as event time: TIMESTAMP BY clause if a datetime type field) by selecting the three-dot symbol next to each field. You can also expand, select, and edit any nested fields from the incoming messages, as shown in the following image.
Tip
This process also applies to the input data from Azure IoT Hub and Azure Data Lake Storage Gen2.

The available data types are:
- DateTime: Date and time field in ISO format.
- Float: Decimal number.
- Int: Integer number.
- Record: Nested object with multiple records.
- String: Text.
Azure IoT Hub as the streaming input
Azure IoT Hub is a managed service hosted in the cloud that acts as a central message hub for communication between an IoT application and its attached devices. You can use IoT device data sent to IoT hub as an input for a Stream Analytics job.
Note
You can use Azure IoT Hub input in the no-code editor on Azure Stream Analytics portal.
To add an IoT hub as a streaming input for your job, select the IoT Hub under Inputs from the ribbon. Then fill in the needed information in the right panel to connect IoT hub to your job. To learn more about the details of each field, see Stream data from IoT Hub to Stream Analytics job.

Azure Data Lake Storage Gen2 as streaming input
Azure Data Lake Storage Gen2 (ADLS Gen2) is a cloud-based, enterprise data lake solution. It's designed to store massive amounts of data in any format, and to facilitate big data analytical workloads. Stream Analytics can process the data stored in ADLS Gen2 as a data stream. To learn more about this type of input, see Stream data from ADLS Gen2 to Stream Analytics job.
Note
You can use Azure Data Lake Storage Gen2 input in the no-code editor on Azure Stream Analytics portal.
To add an ADLS Gen2 as a streaming input for your job, select the ADLS Gen2 under Inputs from the ribbon. Then fill in the needed information in the right panel to connect ADLS Gen2 to your job. To learn more about the details of each field, see Stream data from ADLS Gen2 to Stream Analytics job.

Reference data inputs
Reference data is static or changes slowly over time. Typically, you use it to enrich incoming streams and do lookups in your job. For example, you might join data stream input to reference data, much as you would perform a SQL join to look up static values. For more information about reference data inputs, see Use reference data for lookups in Stream Analytics.
The no-code editor now supports two reference data sources:
- Azure Data Lake Storage Gen2
- Azure SQL Database

Azure Data Lake Storage Gen2 as reference data
Model reference data as a sequence of blobs in ascending order of the date and time combination specified in the blob name. You can add blobs to the end of the sequence only by using a date and time greater than the one that the last blob specified in the sequence. Define blobs in the input configuration.
First, under the Inputs section on the ribbon, select Reference ADLS Gen2. To see details about each field, see the section about Azure Blob Storage in Use reference data for lookups in Stream Analytics.
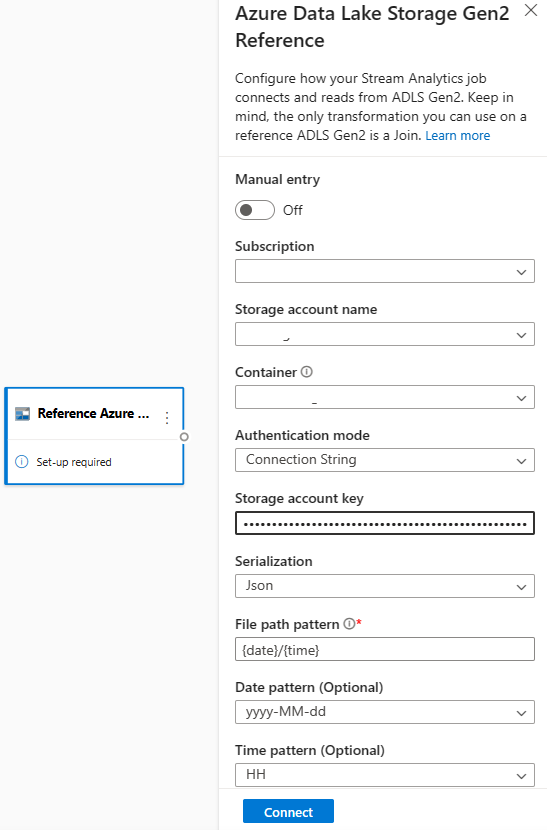
Then, upload a JSON array file. The system detects the fields. Use this reference data to perform transformation with streaming input data from Event Hubs.

Azure SQL Database as reference data
You can use Azure SQL Database as reference data for your Stream Analytics job in the no-code editor. For more information, see the section about SQL Database in Use reference data for lookups in Stream Analytics.
To configure SQL Database as reference data input, select Reference SQL Database under the Inputs section on the ribbon. Then fill in the information to connect your reference database and select the table with your needed columns. You can also fetch the reference data from your table by editing the SQL query manually.

Transformations
Streaming data transformations are inherently different from batch data transformations. Almost all streaming data has a time component, which affects any data-preparation tasks involved.
To add a streaming data transformation to your job, select the transformation symbol under the Operations section on the ribbon for that transformation. The respective tile is added to the diagram view. After you select it, you see the side pane for that transformation to configure it.

Filter
Use the Filter transformation to filter events based on the value of a field in the input. Depending on the data type (number or text), the transformation keeps the values that match the selected condition.

Note
Inside every tile, you see information about what else the transformation needs to be ready. For example, when you add a new tile, you see a Setup required message. If you're missing a node connector, you see either an Error message or a Warning message.
Manage fields
The Manage fields transformation allows you to add, remove, or rename fields coming in from an input or another transformation. The settings on the side pane give you the option of adding a new field by selecting Add field or adding all fields at once.

You can also add a new field by using the Built-in Functions to aggregate the data from upstream. Currently, the built-in functions supported are some functions in String Functions, Date and Time Functions, and Mathematical Functions. To learn more about the definitions of these functions, see Built-in Functions (Azure Stream Analytics).

Tip
After you configure a tile, the diagram view gives you a glimpse of the settings within the tile. For example, in the Manage fields area of the preceding image, you can see the first three fields being managed and the new names assigned to them. Each tile has information that's relevant to it.
Aggregate
Use the Aggregate transformation to calculate an aggregation (Sum, Minimum, Maximum, or Average) every time a new event occurs over a period of time. This operation also allows you to filter or slice the aggregation based on other dimensions in your data. You can include one or more aggregations in the same transformation.
To add an aggregation, select the transformation symbol. Then connect an input, select the aggregation, add any filter or slice dimensions, and select the period of time over which the aggregation is calculated. In this example, you're calculating the sum of the toll value by the state where the vehicle is from over the last 10 seconds.

To add another aggregation to the same transformation, select Add aggregate function. The filter or slice applies to all aggregations in the transformation.
Join
Use the Join transformation to combine events from two inputs based on the field pairs that you select. If you don't select a field pair, the join is based on time by default. The default is what makes this transformation different from a batch one.
As with regular joins, you have options for your join logic:
- Inner join: Include only records from both tables where the pair matches. In this example, that's where the license plate matches both inputs.
- Left outer join: Include all records from the left (first) table and only the records from the second one that match the pair of fields. If there's no match, the fields from the second input are blank.
To select the type of join, select the symbol for the preferred type on the side pane.
Finally, select the period over which you want the join to be calculated. In this example, the join looks at the last 10 seconds. The longer the period is, the less frequent the output is, and the more processing resources you use for the transformation.
By default, the output includes all fields from both tables. Prefixes left (first node) and right (second node) help you differentiate the source.

Group by
Use the Group by transformation to calculate aggregations across all events within a certain time window. You can group by the values in one or more fields. It's like the Aggregate transformation but provides more options for aggregations. It also includes more complex options for time windows. Also like Aggregate, you can add more than one aggregation per transformation.
The aggregations available in the transformation are:
- Average
- Count
- Maximum
- Minimum
- Percentile (continuous and discrete)
- Standard Deviation
- Sum
- Variance
To configure the transformation:
- Select your preferred aggregation.
- Select the field that you want to aggregate on.
- Select an optional group-by field if you want to get the aggregate calculation over another dimension or category. For example: State.
- Select your function for time windows.
To add another aggregation to the same transformation, select Add aggregate function. Keep in mind that the Group by field and the windowing function apply to all aggregations in the transformation.

A time stamp for the end of the time window appears as part of the transformation output for reference. For more information about time windows that Stream Analytics jobs support, see Windowing functions (Azure Stream Analytics).
Union
Use the Union transformation to connect two or more inputs. Add events that have shared fields (with the same name and data type) into one table. The output excludes fields that don't match.
Expand array
Use the Expand array transformation to create a new row for each value within an array.

Streaming outputs
The no-code drag-and-drop experience currently supports several output sinks to store your processed real-time data.

Azure Data Lake Storage Gen2
Data Lake Storage Gen2 makes Azure Storage the foundation for building enterprise data lakes on Azure. It's designed to service multiple petabytes of information while sustaining hundreds of gigabits of throughput. It allows you to easily manage massive amounts of data. Azure Blob Storage offers a cost-effective and scalable solution for storing large amounts of unstructured data in the cloud.
Under the Outputs section on the ribbon, select ADLS Gen2 as the output for your Stream Analytics job. Then select the container where you want to send the output of the job. For more information about Azure Data Lake Gen2 output for a Stream Analytics job, see Blob Storage and Azure Data Lake Gen2 output from Azure Stream Analytics.
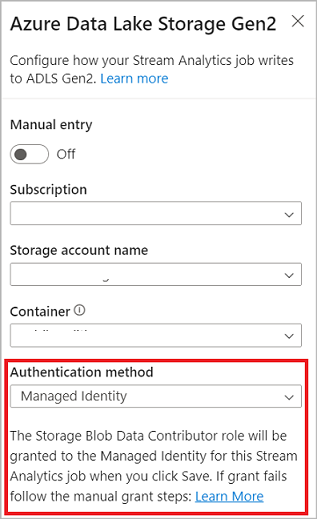
When you're connecting to Azure Data Lake Storage Gen2, if you select Managed Identity as the authentication mode, then the Storage Blob Data Contributor role is granted to the managed identity for the Stream Analytics job. To learn more about managed identities for Azure Data Lake Storage Gen2, see Use managed identities to authenticate your Azure Stream Analytics job to Azure Blob Storage.
Managed identities eliminate the limitations of user-based authentication methods. These limitations include the need to reauthenticate because of password changes or user token expirations that occur every 90 days.
Exactly once delivery (preview) is supported in the ADLS Gen2 as no code editor output. You can enable it in the Write mode section in ADLS Gen2 configuration. For more information about this feature, see Exactly once delivery (preview) in Azure Data Lake Gen2.

Write to Delta Lake table (preview) is supported in the ADLS Gen2 as no code editor output. You can access this option in section Serialization in ADLS Gen2 configuration. For more information about this feature, see Write to Delta Lake table.

Azure Synapse Analytics
Azure Stream Analytics jobs can send output to a dedicated SQL pool table in Azure Synapse Analytics and can process throughput rates up to 200 MB per second. Stream Analytics supports the most demanding real-time analytics and hot-path data processing needs for workloads like reporting and dashboarding.
Important
The dedicated SQL pool table must exist before you can add it as output to your Stream Analytics job. The table's schema must match the fields and their types in your job's output.
Under the Outputs section on the ribbon, select Synapse as the output for your Stream Analytics job. Then select the SQL pool table where you want to send the output of the job. For more information about Azure Synapse output for a Stream Analytics job, see Azure Synapse Analytics output from Azure Stream Analytics.
Azure Cosmos DB
Azure Cosmos DB is a globally distributed database service that offers limitless elastic scale around the globe. It also offers rich queries and automatic indexing over schema-agnostic data models.
Under the Outputs section on the ribbon, select CosmosDB as the output for your Stream Analytics job. For more information about Azure Cosmos DB output for a Stream Analytics job, see Azure Cosmos DB output from Azure Stream Analytics.
When you connect to Azure Cosmos DB, if you select Managed Identity as the authentication mode, the Contributor role is granted to the managed identity for the Stream Analytics job. To learn more about managed identities for Azure Cosmos DB, see Use managed identities to access Azure Cosmos DB from an Azure Stream Analytics job (preview).
The Azure Cosmos DB output in the no-code editor also supports the managed identities authentication method. This method provides the same benefits as it does in the ADLS Gen2 output.
Azure SQL Database
Azure SQL Database is a fully managed platform as a service (PaaS) database engine that helps you create a highly available and high-performance data storage layer for applications and solutions in Azure. By using the no-code editor, you can configure Azure Stream Analytics jobs to write the processed data to an existing table in SQL Database.
To configure Azure SQL Database as output, select SQL Database under the Outputs section on the ribbon. Then enter the information needed to connect to your SQL database and select the table that you want to write data to.
Important
The Azure SQL Database table must exist before you can add it as output to your Stream Analytics job. The table's schema must match the fields and their types in your job's output.
For more information about Azure SQL Database output for a Stream Analytics job, see Azure SQL Database output from Azure Stream Analytics.
Event Hubs
With real-time data coming through to ASA, the no-code editor can transform and enrich the data, and then output the data to another event hub. You can choose the Event Hubs output when you configure your Azure Stream Analytics job.
To configure Event Hubs as output, select Event Hub under the Outputs section on the ribbon. Then enter the information needed to connect to your event hub that you want to write data to.
For more information about Event Hubs output for a Stream Analytics job, see Event Hubs output from Azure Stream Analytics.
Azure Data Explorer
Azure Data Explorer is a fully managed, high-performance, big data analytics platform that makes it easy to analyze high volumes of data. You can also use Azure Data Explorer as an output for your Azure Stream Analytics job by using the no-code editor.
To configure Azure Data Explorer as an output, select Azure Data Explorer under the Outputs section on the ribbon. Then enter the required information to connect to your Azure Data Explorer database and specify the table that you want to write data to.
Important
The table must exist in your selected database and the table's schema must exactly match the fields and their types in your job's output.
For more information about Azure Data Explorer output for a Stream Analytics job, see Azure Data Explorer output from Azure Stream Analytics (Preview).
Power BI
Power BI offers a comprehensive visualization experience for your data analysis result. By using Power BI output to Stream Analytics, the processed streaming data is written to a Power BI streaming dataset, and then you can use it to build the near real-time Power BI dashboard.
To configure Power BI as an output, select Power BI under the Outputs section on the ribbon. Then enter the required information to connect to your Power BI workspace and provide the names for the streaming dataset and table that you want to write the data to. To learn more about the details of each field, see Power BI output from Azure Stream Analytics.
Data preview, authoring errors, runtime logs, and metrics
The no-code drag-and-drop experience provides tools to help you author, troubleshoot, and evaluate the performance of your analytics pipeline for streaming data.
Live data preview for inputs
When you connect to an input source, such as an event hub, and select its tile in the diagram view (the Data Preview tab), you see a live preview of incoming data if all the following conditions are true:
- Data is being pushed.
- The input is configured correctly.
- Fields are added.
As shown in the following screenshot, if you want to see or drill down into something specific, you can pause the preview (1). Or you can start it again if you're done.
You can also see the details of a specific record, a cell in the table, by selecting it and then selecting Show/Hide details (2). The screenshot shows the detailed view of a nested object in a record.

Static preview for transformations and outputs
After you add and set up any steps in the diagram view, you can test their behavior by selecting Get static preview.

When you select the button, the Stream Analytics job evaluates all transformations and outputs to make sure they're configured correctly. Stream Analytics then displays the results in the static data preview, as shown in the following image.

You can refresh the preview by selecting Refresh static preview (1). When you refresh the preview, the Stream Analytics job takes new data from the input and evaluates all transformations. Then it sends output again with any updates that you might have performed. The Show/Hide details option is also available (2).
Authoring errors
If you have any authoring errors or warnings, the Authoring errors tab lists them, as shown in the following screenshot. The list includes details about the error or warning, the type of card (input, transformation, or output), the error level, and a description of the error or warning.

Runtime logs
Runtime logs appear at the warning, error, or information level when a job is running. These logs are helpful when you want to edit your Stream Analytics job topology or configuration for troubleshooting. Turn on diagnostic logs and send them to Log Analytics workspace in Settings to get more insights into your running jobs for debugging.

In the following screenshot example, the user configures SQL Database output with a table schema that doesn't match the fields of the job output.

Metrics
If the job is running, you can monitor the health of your job on the Metrics tab. The four metrics shown by default are Watermark delay, Input events, Backlogged input events, and Output events. Use these metrics to understand if the events flow in and out of the job without any input backlog.

You can select more metrics from the list. To understand all the metrics in detail, see Azure Stream Analytics job metrics.
Start a Stream Analytics job
You can save the job anytime while creating it. After you configure the streaming inputs, transformations, and streaming outputs for the job, you can start the job.
Note
Although the no-code editor on Azure Stream Analytics portal is in preview, the Azure Stream Analytics service is generally available.

You can configure these options:
- Output start time: When you start a job, select a time for the job to start creating output.
- Now: This option makes the starting point of the output event stream the same as when the job starts.
- Custom: Choose the starting point of the output.
- When last stopped: This option is available when the job was previously started but was stopped manually or failed. When you choose this option, the last output time is used to restart the job, so no data is lost.
- Streaming units: Streaming units (SUs) represent the amount of compute and memory assigned to the job while it's running. If you're not sure how many SUs to choose, start with three and adjust as needed.
- Output data error handling: Policies for output data error handling apply only when the output event produced by a Stream Analytics job doesn't conform to the schema of the target sink. Configure the policy by choosing either Retry or Drop. For more information, see Azure Stream Analytics output error policy.
- Start: This button starts the Stream Analytics job.

Stream Analytics job list in Azure Event Hubs portal
To see a list of all Stream Analytics jobs that you created by using the no-code drag-and-drop experience in Azure Event Hubs portal, select Process data > Stream Analytics jobs.

Here are the elements of the Stream Analytics jobs tab:
- Filter: Filter the list by job name.
- Refresh: Currently, the list doesn't refresh itself automatically. Use the Refresh button to refresh the list and see the latest status.
- Job name: The name in this area is the one that you provide in the first step of job creation. You can't edit it. Select the job name to open the job in the no-code drag-and-drop experience, where you can stop the job, edit it, and start it again.
- Status: This area shows the status of the job. Select Refresh on top of the list to see the latest status.
- Streaming units: This area shows the number of streaming units that you select when you start the job.
- Output watermark: This area provides an indicator of liveliness for the data that the job produces. All events before the time stamp are already computed.
- Job monitoring: Select Open metrics to see the metrics related to this Stream Analytics job. For more information about the metrics that you can use to monitor your Stream Analytics job, see Azure Stream Analytics job metrics.
- Operations: Start, stop, or delete the job.
Next steps
Learn how to use the no-code editor to address common scenarios by using predefined templates: