Project Flash - Use Azure Resource Graph to monitor Azure Virtual Machine availability
Azure Resource Graph is one solution offered by Flash. Flash is the internal name for a project dedicated to building a robust, reliable, and rapid mechanism for customers to monitor virtual machine (VM) health.
This article covers the use of Azure Resource Graph to monitor Azure Virtual Machine availability. For a general overview of Flash solutions, see the Flash overview.
For documentation specific to the other solutions offered by Flash, choose from the following articles:
- Use Event Grid system topics to monitor Azure Virtual Machine availability
- Use Azure Monitor to monitor Azure Virtual Machine availability
- Use Azure Resource Health to monitor Azure Virtual Machine availability
Azure Resource Graph - HealthResources
This feature is currently generally available. It's useful for conducting large-scale investigations. It offers a highly user-friendly experience for information retrieval with its use of kusto query language (KQL). It can also serve as a central hub for resource information and allows easy retrieval of historical data.
In addition to already flowing VM availability states, we published VM availability annotations to Azure Resource Graph (ARG) for detailed failure attribution and downtime analysis, along with enabling a 14-day change tracking mechanism to trace historical changes in VM availability for quick debugging. With these new additions, we're excited to announce the general availability of VM availability information in the HealthResources dataset in ARG! With this offering users can:
- Efficiently query the latest snapshot of VM availability across all Azure subscriptions at once and at low latencies for periodic and fleetwide monitoring.
- Accurately assess the impact to fleetwide business SLAs and quickly trigger decisive mitigation actions, in response to disruptions and type of failure signature.
- Set up custom dashboards to supervise the comprehensive health of applications by joining VM availability information with resource metadata present in ARG.
- Track relevant changes in VM availability across a rolling 14-day window, by using the change-tracking mechanism for conducting detailed investigations.
Sample queries
- Azure Resource Graph sample queries for Azure Service Health - Azure Service Health | Microsoft Learn
- VM availability information in Azure Resource Graph - Azure Virtual Machines | Microsoft Learn
- List of sample Azure Resource Graph queries by table - Azure Resource Graph | Microsoft Learn
Get started
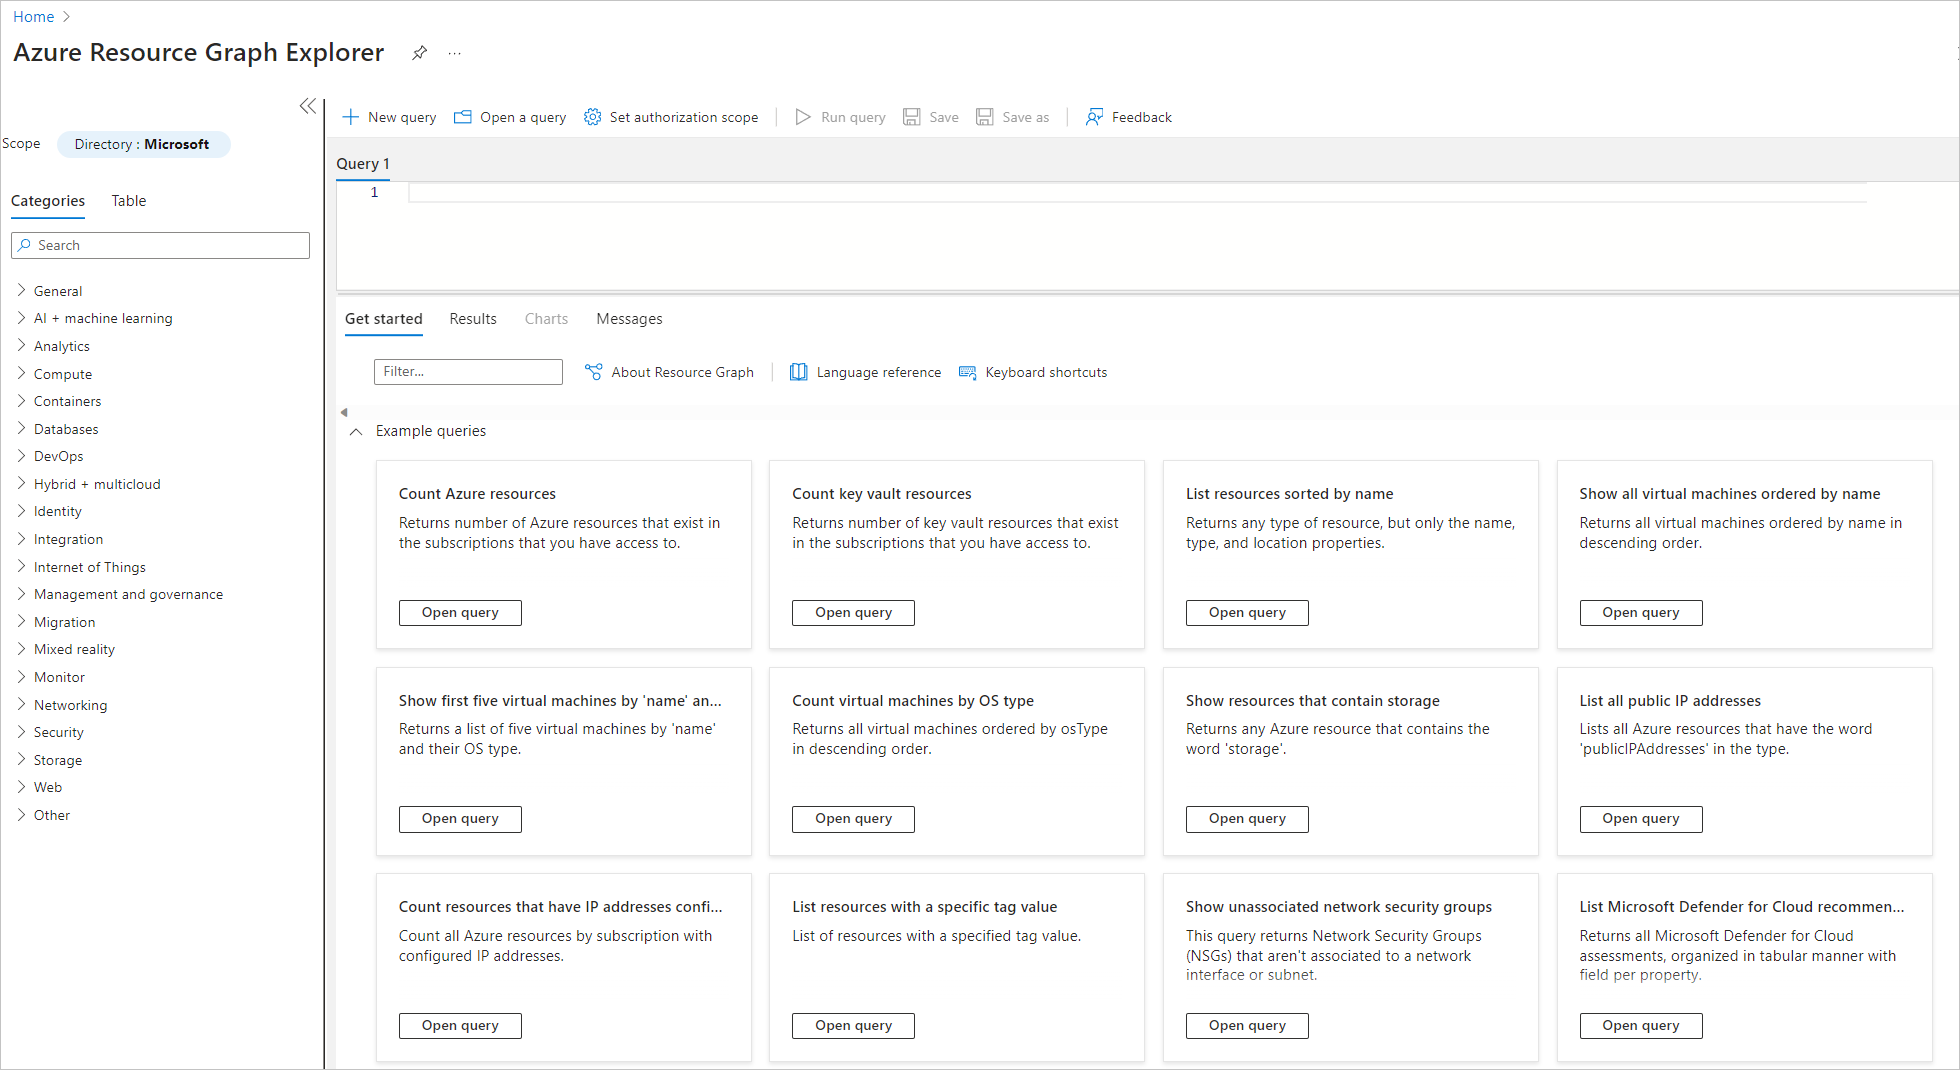
Users can query ARG via PowerShell, REST API, Azure CLI, or even the Azure portal. The following steps detail how data can be accessed from Azure portal.
Once on the Azure portal, navigate to Resource Graph Explorer.
Select the Table tab and (single) click on the HealthResources table to retrieve the latest snapshot of VM availability information (availability state and health annotations).
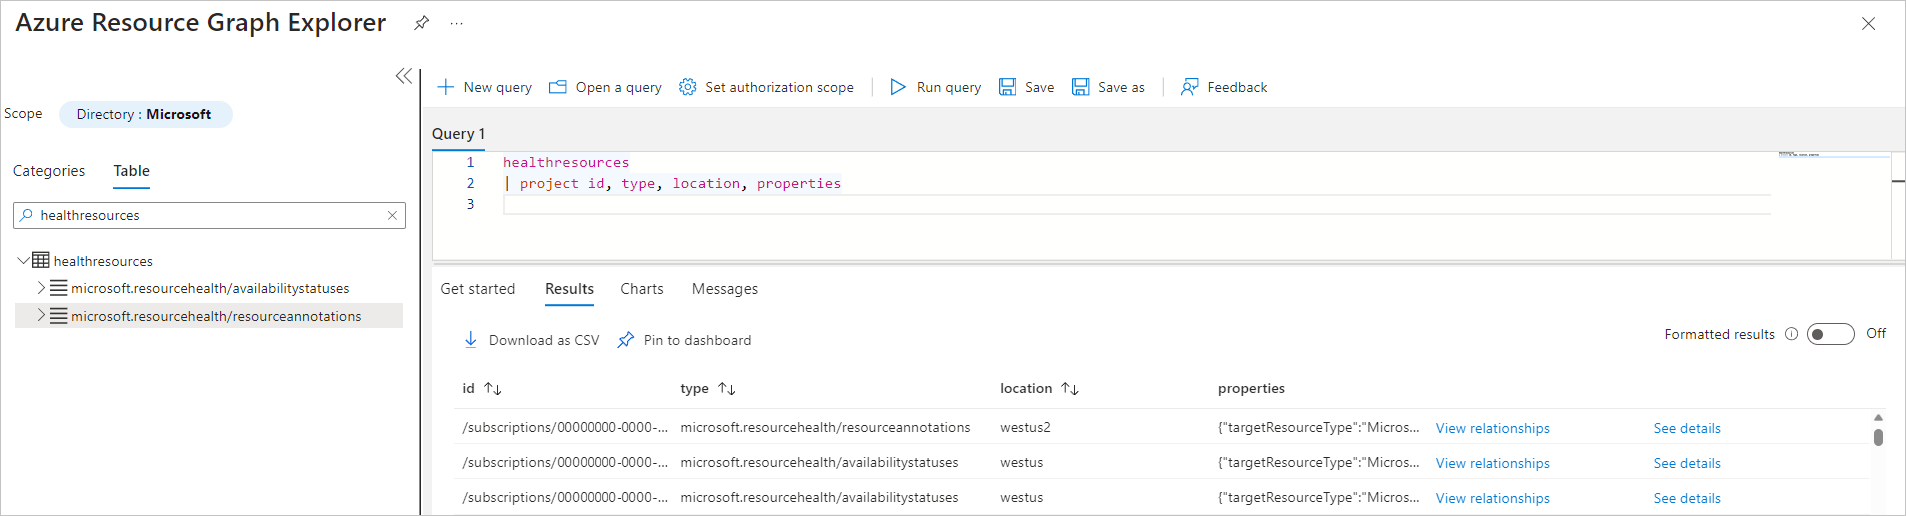


There are two types of events populated in the HealthResources table:

- resourcehealth/availabilitystatuses
This event denotes the latest availability status of a VM, based on the health checks performed by the underlying Azure platform. The availability states we currently emit for VMs are:
- Available: The VM is up and running as expected.
- Unavailable: We detected disruptions to the normal functioning of the VM, and therefore, applications won't run as expected.
- Unknown: The platform is unable to accurately detect the health of the VM. Users can usually check back in a few minutes for an updated state.
To poll the latest VM availability state, refer to the properties field, which contains the following details:
Sample
{
 "targetResourceType": "Microsoft.Compute/virtualMachines",
 "previousAvailabilityState": "Available",
 "targetResourceId": "/subscriptions//resourceGroups//providers/Microsoft.Compute/virtualMachines/",
 "occurredTime": "2022-10-11T11:13:59.9570000Z",
 "availabilityState": "Unavailable"
 }
Property description
| Property | Description | Corresponding resource health category (RHC) |
|---|---|---|
| targetResourceType | Type of resource for which health data is flowing | resourceType |
| targetResourceId | Resource ID | resourceId |
| occurredTime | Timestamp when the platform emits the latest availability state | eventTimestamp |
| previousAvailabilityState | Previous availability state of the VM | previousHealthStatus |
| availabilityState | Current availability state of the VM | currentHealthStatus |
See the HealthResources section of the samples queries documentation for a list of starter queries to further explore this data.
- resourcehealth/resourceannotations (NEWLY ADDED)
This event contextualizes any changes to VM availability, by detailing necessary failure attributes to help users investigate and mitigate the disruption as needed. See the full list of VM availability annotations emitted by the platform. These annotations can be broadly classified into three buckets:
- Downtime Annotations: These annotations are emitted when the platform detects VM availability transitioning to Unavailable. (For example, during unexpected host crashes, rebootful repair operations).
- Informational Annotations: These annotations are emitted during control plane activities with no impact to VM availability. (Such as VM allocation/Stop/Delete/Start). Usually, no further customer action is required in response.
- Degraded Annotations: These annotations are emitted when VM availability is detected to be at risk. (For example, when failure prediction models predict a degraded hardware component that can cause the VM to reboot at any given time). We strongly urge users to redeploy by the deadline specified in the annotation message, to avoid any unanticipated loss of data or downtime. You may receive an alert in Azure virtual machine scale sets Resource Health or Activity log in one of the following scenarios:
- VMs in the Azure virtual machine scale sets are in the process of being stopped, deallocated, deleted, or started.
- You performed scaling in or out operations on the virtual machine scale sets.
- The alert indicates that the aggregated platform health of the virtual machine scale sets is in a transient state of "Degraded."
To poll the associated VM availability annotations for a resource, if any, refer to the properties field, which contains the following details:
Sample
{
 "targetResourceType": "Microsoft.Compute/virtualMachines", "targetResourceId": "/subscriptions//resourceGroups//providers/Microsoft.Compute/virtualMachines/",
 "annotationName": "VirtualMachineHostRebootedForRepair",
 "occurredTime": "2022-09-25T20:21:37.5280000Z",
 "category": "Unplanned",
 "summary": "We're sorry, your virtual machine isn't available because an unexpected failure on the host server. Azure has begun the auto-recovery process and is currently rebooting the host server. No further action is required from you at this time. The virtual machine will be back online after the reboot completes.",
 "context": "Platform Initiated",
 "reason": "Unexpected host failure"
 }
Property description
| Property | Description | Corresponding RHC |
|---|---|---|
| targetResourceType | Type of resource for which health data is flowing | resourceType |
| targetResourceId | Resource ID | resourceId |
| occurredTime | Timestamp when the latest availability state is emitted by the platform | eventTimestamp |
| annotationName | Name of the Annotation emitted | eventName |
| reason | Brief overview of the availability impact observed by the customer | title |
| category | Denotes whether the platform activity that triggered the annotation was either planned maintenance or unplanned repair. This field isn't applicable to customer/VM-initiated events. Possible values: Planned, Unplanned, Not Applicable, Null | category |
| context | Denotes whether the activity that triggered the annotation was due to an authorized user or process (customer-initiated), the Azure platform (platform-initiated), or activity in the guest OS that resulted in availability impact (VM initiated). Possible values: Platform-initiated, User-initiated, VM-initiated, Not Applicable, Null | context |
| summary | Statement detailing the cause for annotation emission, along with remediation steps that users can take | summary |
See the HealthResources section of the samples queries documentation for a list of starter queries to further explore this data.
We have multiple enhancements planned for the annotation metadata that is surfaced in the HealthResources dataset. These enrichments give users access to richer failure attributes to decisively prepare a response to a disruption. In parallel, we aim to extend the duration of historical lookback to a minimum of 30 days so users can comprehensively track past changes in VM availability.
Next steps
To learn more about the solutions offered, proceed to corresponding solution article:
- Use Event Grid system topics to monitor Azure Virtual Machine availability
- Use Azure Monitor to monitor Azure Virtual Machine availability
- Use Azure Resource Health to monitor Azure Virtual Machine availability
For a general overview of how to monitor Azure Virtual Machines, see Monitor Azure virtual machines and the Monitoring Azure virtual machines reference.