Note
Access to this page requires authorization. You can try signing in or changing directories.
Access to this page requires authorization. You can try changing directories.
The Cloud discovery page provides a dashboard designed to give you more insight into how cloud apps are being used in your organization. The dashboard provides an at-a-glance view of the types of apps being used, your open alerts, and the risk levels of apps in your organization. It also shows who your top app users are, and provides an App headquarter location map.
Filter your Cloud discovery data to generate specific views, depending on what interests you most. For more information, see Discovered app filters.
Prerequisites
For information about roles required, see Manage admin access.
Review the cloud discovery dashboard
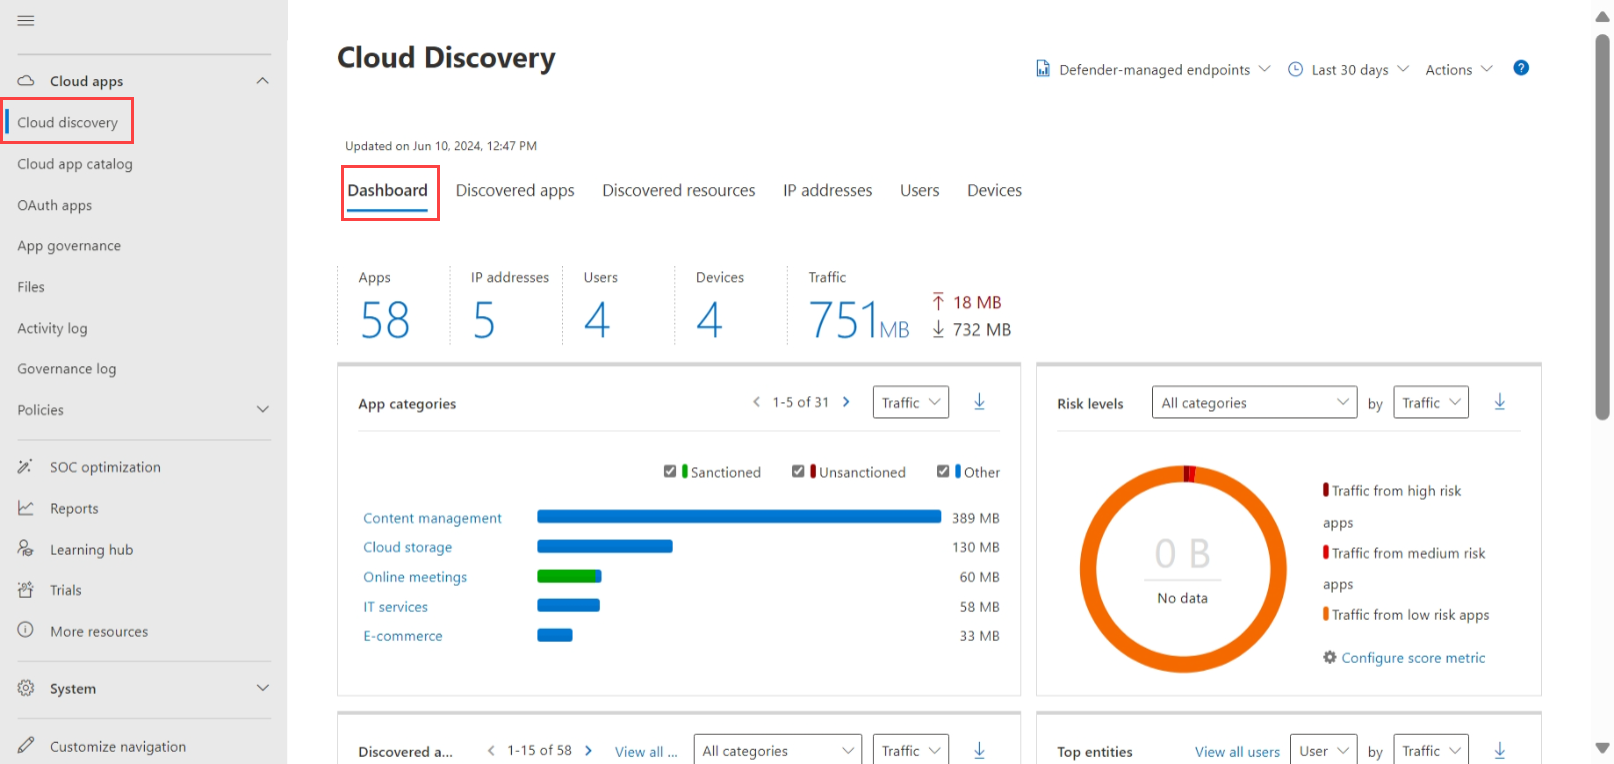
This procedure describes how to get an initial, general picture of your cloud discovery apps in the Cloud discovery dashboard.
In the Microsoft Defender portal, select Cloud apps > Cloud discovery.
For example:
Supported apps include Windows and macOS apps, which are both listed under the Defender - managed endpoints stream.
Review the following information:
Use the High-level usage overview to understand overall cloud app use in your organization.
Dive one level deeper to understand the top categories that used in your org for each of the different use parameters. Note how much of this usage is by sanctioned apps.
Use the Discovered apps tab to go even deeper and see all the apps in a specific category.
Check the top users and source IP addresses to identify which users are the most dominant users of cloud apps in your organization.
Use the App headquarters map to check how the discovered apps spread according to geographic location, according to their headquarter.
Use the App risk overview to understand the risk score of discovered apps, and check the discovery alerts status to see how many open alerts should you investigate.

Deep dive into discovered apps
To dive deeper in to cloud discovery data, use the filters to check for risky or commonly used apps.
For example, if you want to identify commonly used, risky cloud storage and collaboration apps, use the Discovered apps page to filter for the apps you want. Then, unsanction or block those apps as follows:
In the Microsoft Defender portal, under Cloud Apps, select Cloud discovery. Then choose the Discovered apps tab.
In the Discovered apps tab, under Browse by category select both Cloud storage and Collaboration.
Use the advanced filters to set Compliance risk factor to SOC 2 = No.
For Usage, set Users to greater than 50 users and Transactions to greater than 100.
Set the Security risk factor for Data at rest encryption equals Not supported. Then set Risk score equals 6 or lower.
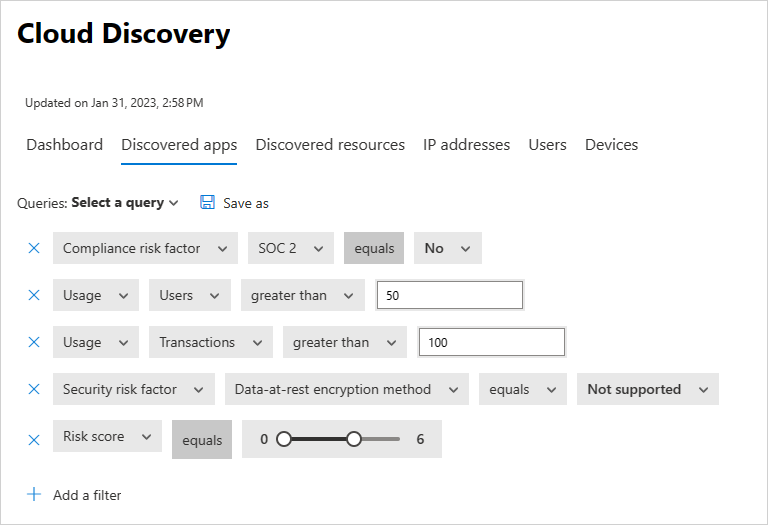

After the results are filtered, unsanction and block the filtered apps by using the bulk action checkbox to unsanction all of those apps in one action. Once the apps are unsanctioned, use a blocking script to block those apps from being used in your environment.
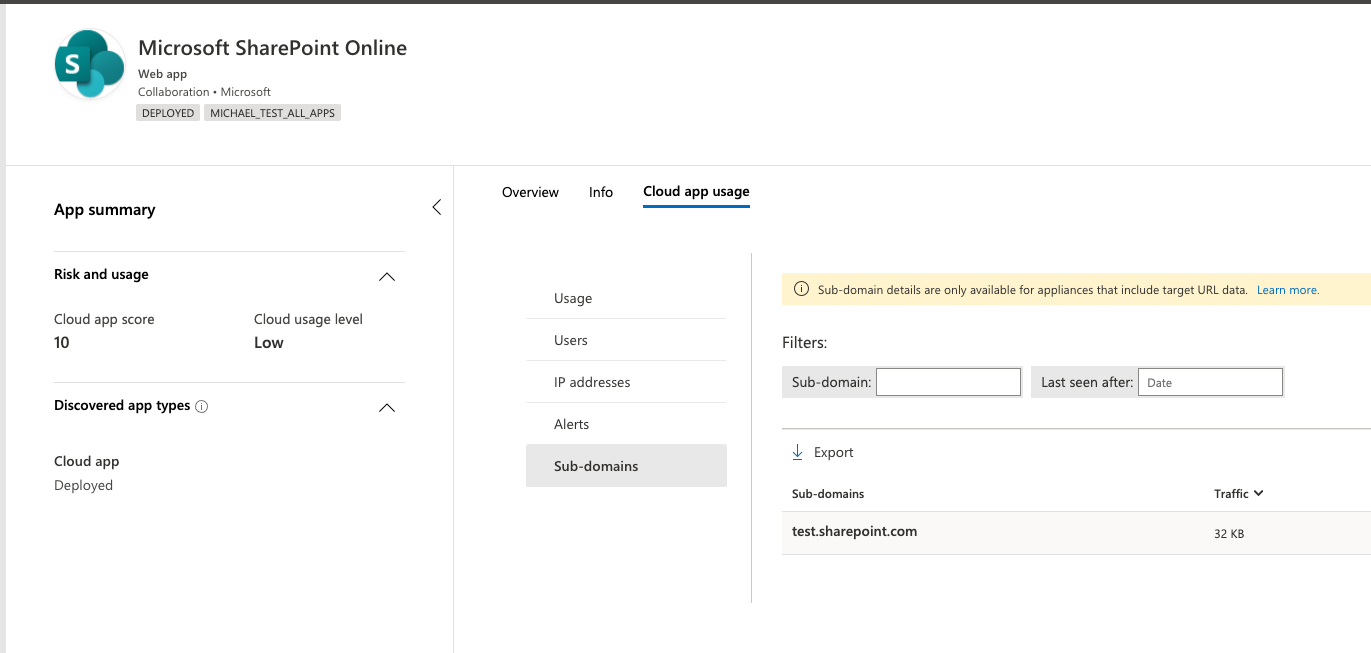
You also might want to identify specific app instances that are in use by investigating the discovered subdomains. For example, differentiate between different SharePoint sites:
Note
The feature of discovered subdomains will be deprecated by Dec 31st, 2025. Post this, no support for discovery subdomains will be provided.
Deep dives into discovered apps are supported only in firewalls and proxies that contain target URL data. For more information, see Supported firewalls and proxies.
If Defender for Cloud Apps can't match the subdomain detected in the traffic logs with the data stored in the app catalog, the subdomain is tagged as Other.
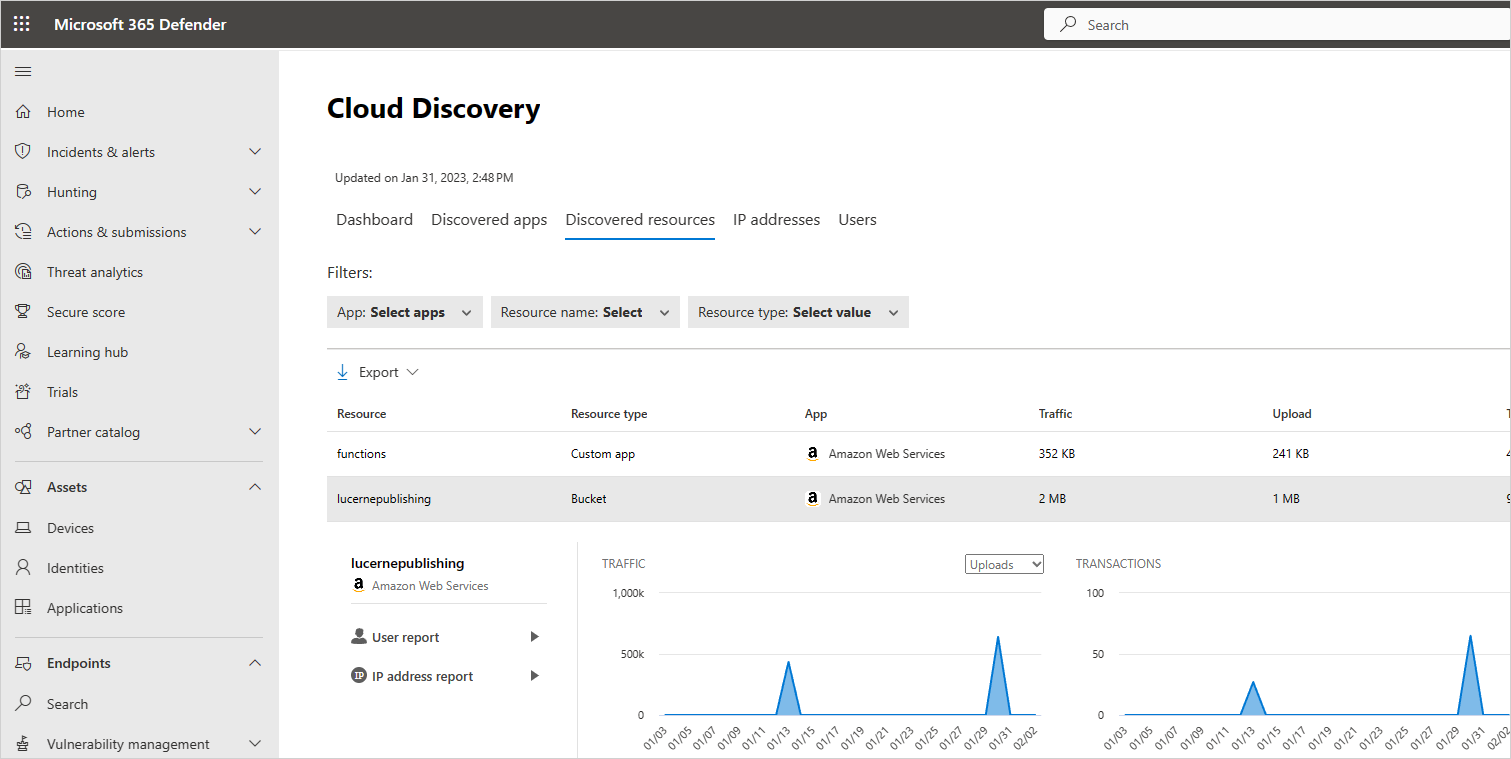
Discover resources and custom apps
Cloud discovery also enables you to dive into your IaaS and PaaS resources. Discover activity across your resource-hosting platforms, viewing access to data across your self-hosted apps and resources including storage accounts, infrastructure and custom apps hosted on Azure, Google Cloud Platform, and AWS. Not only can you see overall usage in your IaaS solutions, but you can get visibility into the specific resources that are hosted on each, and the overall usage of the resources, to help mitigate risk per resource.
For example, if a large amount of data is uploaded, discover which resource received the uploaded data, and drill down to see who performed the activity.
Note
Discovery of IaaS and PaaS resources is supported only in firewalls and proxies that contain target URL data. For more information, see the list of supported appliances in Supported firewalls and proxies.
To view discovered resources:
In the Microsoft Defender portal, under Cloud Apps, select Cloud discovery. Then choose the Discovered resources tab.
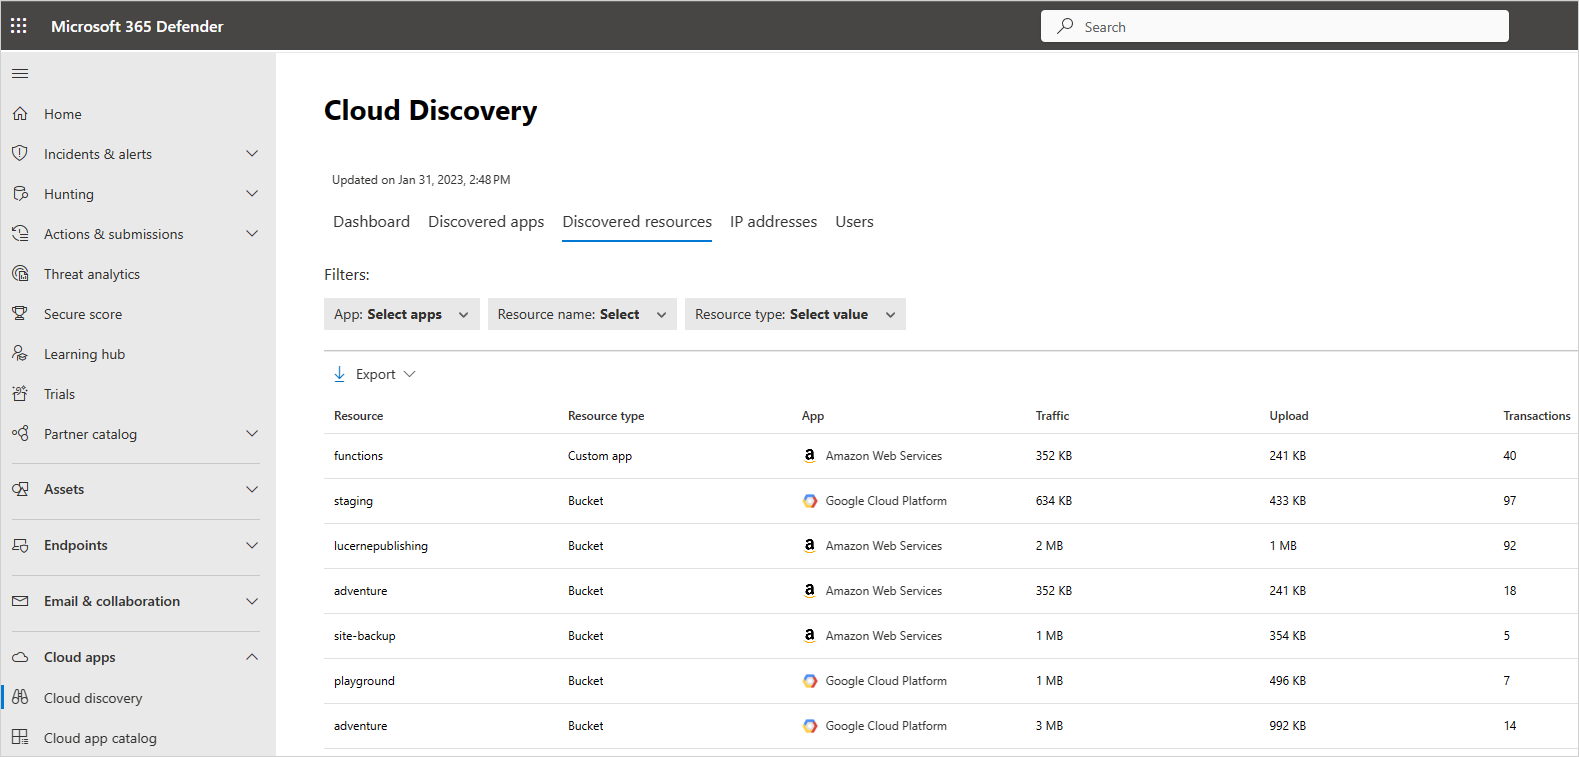
In the Discovered resources page, drill down into each resource to see what kinds of transactions occurred, who accessed it, and then drill down to investigate the users even further.
For custom apps, select the options menu at the end of the row and then select Add new custom app. This opens the Add this app dialog, where you can name and identify the app so it can be included in the cloud discovery dashboard.

Generate a cloud discovery executive report
The best way to get an overview of Shadow IT use across your organization is by generating a cloud discovery executive report. This report identifies the top potential risks and helps you plan a workflow to mitigate and manage risks until they're resolved.
To generate a cloud discovery executive report:
In the Microsoft Defender portal, under Cloud Apps, select Cloud discovery.
From the Cloud discovery page, select Actions > Generate Cloud Discovery executive report.
Optionally, change the report name, and then select Generate.
Note
The executive summary report is revamped to a six-pager report with a goal to provide a clear, concise & actionable overview while preserving the depth and integrity of the original analysis. Starting September 1, 2025, the Cloud Discovery Alerts data point will no longer be included in the Executive Summary Report.
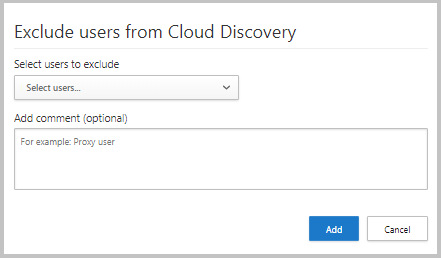
Exclude entities
If you have system users, IP addresses, or devices that are noisy but uninteresting, or entities that shouldn't be presented in the Shadow IT reports, you might want to exclude their data from the cloud discovery data that's analyzed. For example, you might want to exclude all information originating from a local host.
To create an exclusion:
In the Microsoft Defender portal, select Settings > Cloud Apps > Cloud Discovery > Exclude entities.
Select either the Excluded users, Excluded groups, Excluded IP addresses, or Excluded devices tab and select the +Add button to add your exclusion.
Add a user alias, IP address, or device name. We recommend adding information about why the exclusion was made.

Note
- All entity exclusions apply to newly received data only. Historical data of the excluded entities remains through the retention period (90 days).
- Entity exclusion is only supported for the Global report stream. Entities from Microsoft Defender for Endpoint and the Cloud App Security proxy stream aren't supported for exclusion.
Manage continuous reports
Custom continuous reports provide you with more granularity when monitoring your organization's cloud discovery log data. Create custom reports to filter on specific geographic locations, networks, and sites, or organizational units. By default, only the following reports appear in your cloud discovery report selector:
The Global report consolidates all the information in the portal from all the data sources you included in your logs. The global report doesn't include data from Microsoft Defender for Endpoint.
The Data source specific report displays only information from a specific data source.
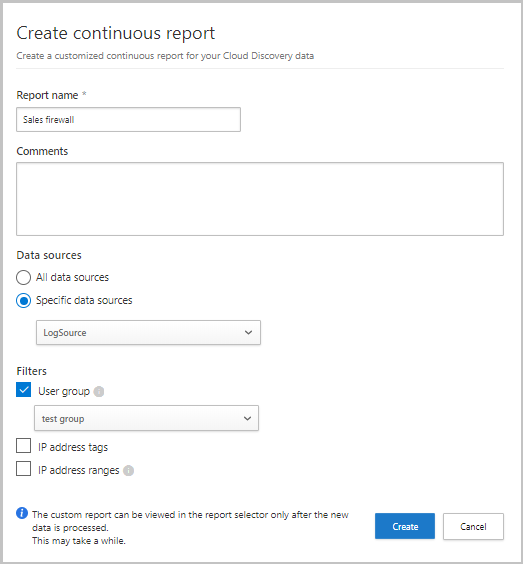
To create a new continuous report:
In the Microsoft Defender portal, select Settings > Cloud Apps > Cloud Discovery > Continuous report > Create report.
Enter a report name.
Select the data sources you want to include (all or specific).
Set the filters you want on the data. These filters can be User groups, IP address tags, or IP address ranges. For more information on working with IP address tags and IP address ranges, see Organize the data according to your needs.
Note
All custom reports are limited to a maximum of 1 GB of uncompressed data. If there's more than 1 GB of data, the first 1 GB of data will be exported into the report.
Deleting cloud discovery data
We recommend deleting cloud discovery data in the following cases:
If you manually uploaded log files, a long time passed since you updated the system with new log files, and you don't want old data affecting your results.
When you set a new custom data view, it applies only to new data from that point forward. In such cases, you might want to erase old data and then upload your log files again to enable the custom data view to pick up events in the log file data.
If many users or IP addresses recently started working again after being offline for some time, their activity is identified as anomalous and might give you false positive violations.
Important
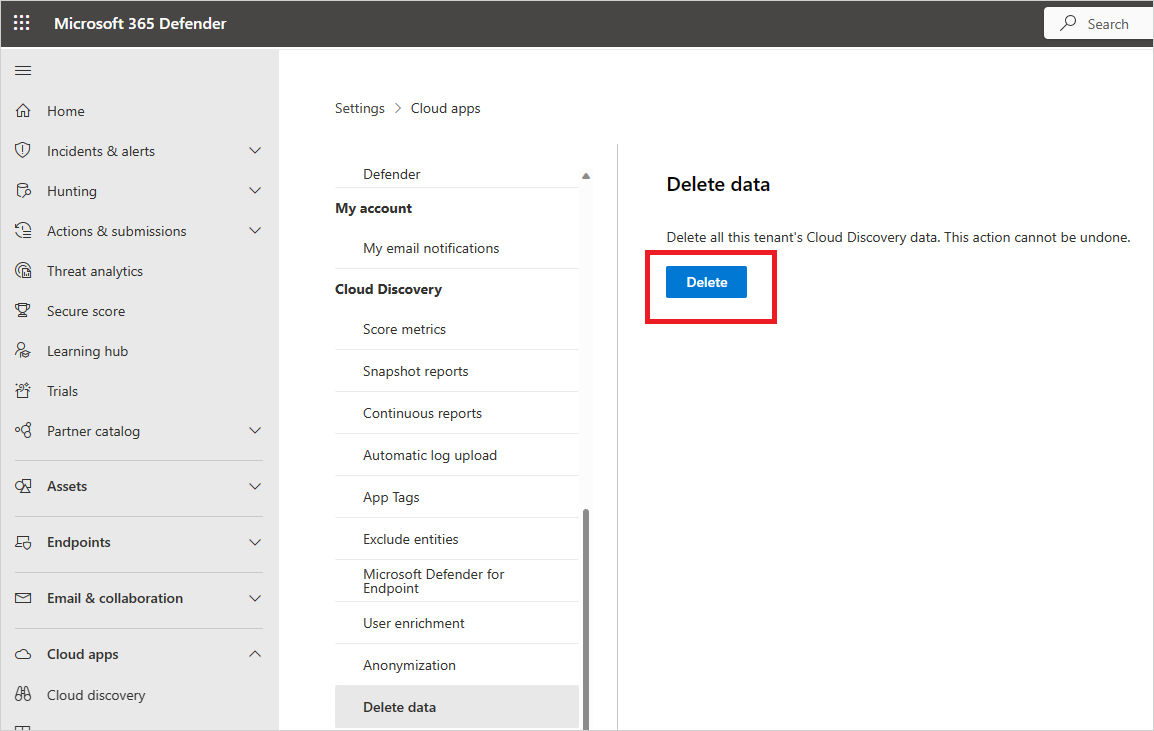
Make sure you want to delete data before doing so. Deleting cloud discovery data is irreversible and deletes all cloud discovery data in the system.
To delete cloud discovery data:
In the Microsoft Defender Portal, select Settings > Cloud Apps > Cloud Discovery > Delete data.
Select the Delete button.

Note
The deletion process takes a few minutes and isn't immediate.