Work order summary report
Operations managers are responsible for managing work orders in order to provide timely support for their customers. To better understand what actions might be needed for better field service performance, reports provide help to monitor key operational metrics.
Tip
As an alternative, Dynamics 365 offers various ways to visualize your data in Power BI. One option is to use the built-in visualization tool within Dynamics 365 to quickly generate insights. Learn more: Visualize your data quickly.
For more customized reporting, you can build your own reports using the Dataverse connector for Power BI. You can create tailored visualizations based on your specific data needs. Learn more: Create a Power BI report using data from Dataverse.
You can also embed Power BI reports directly within Dynamics 365. Learn more: Embed a Power BI report.
Before you start
A Field Service administrator must enable the report in Settings > Analytics and Insight > Settings > Field Service historical analytics > Manage.
Filters and slicers
- Date range: A relative date range.
- Customer: Customer accounts configured in Field Service.
- System status: Booking status of a work order.
- Work order type: Work order types in Field Service.
- Substatus: Custom substatuses related the booking status of a work order.
- Service territory: Territory defined in Field Service.
- Technician: Active bookable resources in Field Service.
Report metrics
To access the work order summary report, open the Field Service app, go to Analytics and Insights > Field Service historical analysis.
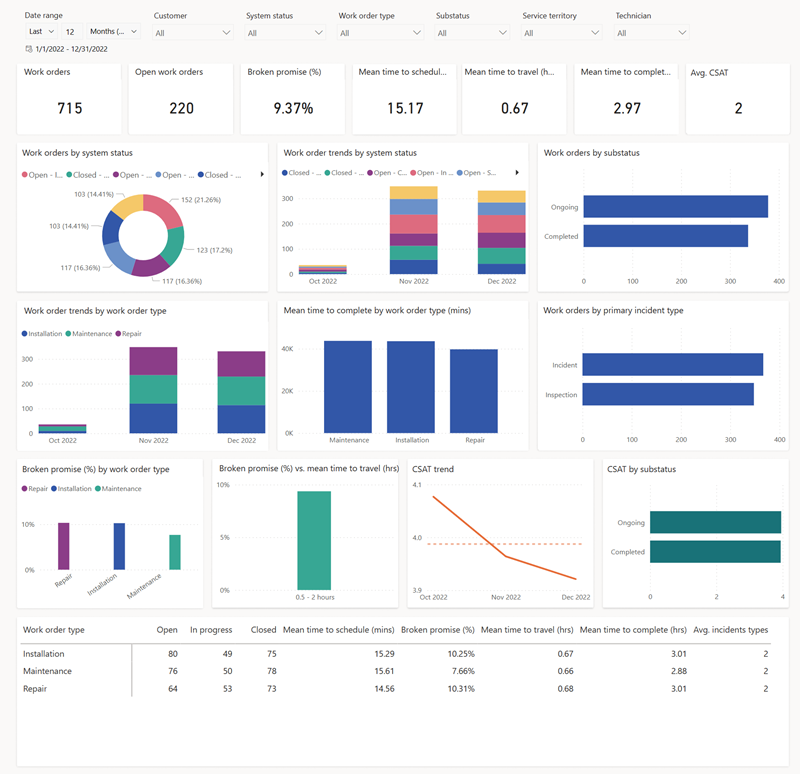
Work orders: Total number of work orders created for the selected filters.
Open work orders: Total number of currently open work orders.
Broken promise (%): Percentage of work orders that weren't completed within the promise window.
Mean time to schedule (mins): Average time to schedule from the time the work order was created to the time of the first booking.
Mean time to travel (hrs): Average time taken by an agent to travel to the customer. Calculated for all non-agreement work orders.
Mean time to complete (hrs): Average time taken to complete all the bookings for a specific work order from the date the work order was created.
Avg. CSAT: Average customer satisfaction rate.
Work orders by system status: Number of work orders by status.
Work order trends by system status: Work order status over time.
Work orders by substatus: Number of work orders by substatus.
Work order trends by work order type: Work order type over time.
Mean time to complete by work order type (mins): Average time to complete work order over time.
Work orders by primary incident type: Number of work orders by primary incident type.
Broken promise (%) by work order type: Represents the correlation between broken promise percentage and work order type.
Broken promise (%) vs mean time to schedule (mins): Correlation between broken promise percentage and average time to schedule in minutes.
Broken promise (%) vs mean time to travel (hrs): Correlation between broken promise percentage and average travel time in hours.
CSAT Trend: Average customer satisfaction score (CSAT) value per month over time.
CSAT by substatus: Number of work orders with CSAT rating by substatus.
Territory analysis: Number of bookings by territory on a map. The territory needs to be a physical geolocation to show on the map.