Note
Access to this page requires authorization. You can try signing in or changing directories.
Access to this page requires authorization. You can try changing directories.
Applies to:  External tenants (learn more)
Azure Monitor provides a comprehensive solution for collecting, analyzing, and responding to monitoring data from your cloud and on-premises environments. The diagnostic settings on the monitored resource specify what data to send and where to send it. For Microsoft Entra, you can send data to Azure Storage, Log Analytics, or Azure Event Hubs.
When you transfer external tenant logs to other monitoring solutions or storage locations, be aware that these logs might contain personal data. When processing personal data, use appropriate security measures to protect it. These measures should prevent unauthorized or unlawful processing by using appropriate technical and organizational safeguards.
This article describes how to configure Azure Monitor in an external tenant so you can collect and analyze data in your tenant. It also explains how to configure diagnostic settings to send logs and metrics to a Log Analytics workspace in your workforce tenant.
Deployment overview
External tenants use Microsoft Entra monitoring. Unlike workforce tenants, an external tenant can't have an associated subscription. To enable monitoring in an external tenant, sign in to your workforce tenant to authenticate the subscription during configuration.
You can also use Azure Lighthouse to enable diagnostic settings for a workforce tenant (the Customer) within your external tenant (the Service Provider).
In this configuration, you use a wizard. You can start the wizard from either of these entry points: the Diagnostic settings page or the Security Store page. This article covers both approaches.
Prerequisites
- An Azure subscription. If you don't have one, create a free account before you begin.
- A Microsoft Entra account with the Owner role in the Microsoft Entra subscription.
- An account in the external tenant that's been assigned the Security Administrator or the Application Administrator role.
Important
This feature supports only the new Azure Role-Based Access Control (RBAC) Owner role, not the classic administrator roles. For instructions on converting classic administrator roles to Azure RBAC, see Azure classic subscription administrators. After you complete the conversion, refresh the page to apply the changes.
Start the wizard to set up Azure Lighthouse
To configure Azure Lighthouse in an external tenant, start the wizard from either the Diagnostic settings page or the Security Store page. Choose one of the following tabs with the entry points to get started.
- Sign in to the Microsoft Entra admin center.
- If you have access to multiple tenants, use the Settings icon
 in the top menu and switch to your external tenant from the Directories + subscriptions menu.
 - Browse to Entra ID in your external tenant and select Monitoring & health > Diagnostic settings.
- Select Start set up to launch the wizard.

Set up the Azure Lighthouse configuration in the wizard
The following steps guide you through the wizard to set up Azure Lighthouse configuration in your external tenant.
Step 1: Sign in to your workforce tenant
To set up Azure Lighthouse, sign in with an account that has access to the subscription that owns the external configuration tenant.

Step 2: Fill out the project details
In this step, provide the details of your project. When you create a resource group and a Log Analytics workspace at the same time, you can select only one location. This location is limited to the regions available for both the resource group and the Log Analytics workspace. To access the full list of locations, create the resource group and the Log Analytics workspace separately beforehand.
- Select a Subscription from the dropdown.
- Use an existing Resource Group or create a new one.
- Provide a name for the new Log Analytics workspace. This name must be unique per resource group.
- Select an available Region.
- Select Next.

Step 3: Select user access
Choose the users or groups in your external tenant who can access the Log Analytics workspace. The selected users need at least the Security Administrator role to set up diagnostic settings.
Confirm your selection with the Select button. After you select the users or groups, assign a role to them. You can choose from the following roles:
- Contributor: Can read monitoring data and configuration.
- Log Analytics Contributor: Can read and write monitoring data and configuration.
- Monitoring Contributor: Can read all monitoring data and edit monitoring settings.
- Monitoring Policy Contributor: Can manage security-related features, including viewing and managing security alerts and reports.
After you select the users or groups and assign a role, select Next to continue.

Optional: Add tags to your Log Analytics workspace
You can add tags to your Log Analytics workspace. Tags are name/value pairs that help you categorize resources and view consolidated billing by applying the same tag to multiple resources and resource groups. For more information, see Use tags to organize your Azure resources.
Step 4: Review and create your Log Analytics workspace
Review your configuration. If you need to make changes, use the Back button to return to the previous steps. If everything looks correct, select Create to set up the Log Analytics workspace and assign the selected users or groups the specified role. Setting up the Log Analytics workspace and assigning roles might take a few minutes, so don't close the browser window.

When the setup is complete, you see a confirmation message. Select Done and configure diagnostic settings to start sending logs and metrics to your Log Analytics workspace.

Configure diagnostic settings
Diagnostic settings enable you to collect resource logs and send platform metrics and the activity log to different destinations. You can create up to five different diagnostic settings to send various logs and metrics to different destinations. Follow these steps to configure diagnostic settings in your external tenant.
- Select Add settings under Add diagnostic settings.
- If you select Review before adding settings, you can see the Subscription and Resource Group on the right hand side. These fields are read-only. To make changes, remove the existing service provider information and start the wizard again. If you're satisfied with the selection, select Done to continue to the next step. This step is optional.
Note
If you select Review before adding settings, the Subscription and Resource group appear on the right-hand side. These fields are read-only. To make changes, remove the existing service provider information and restart the wizard.
Keep the window open while the background subscription check runs. If you close or refresh the window before the check finishes, you might need to restart the wizard from Start setup.

- Select Add diagnostic setting to add a new setting or Edit setting to edit an existing one. You might need multiple diagnostic settings for a resource if you want to send data to multiple destinations of the same type.
- Give your setting a descriptive name.
- Logs and metrics to route: For logs, either choose a category group or select the individual checkboxes for each category of data you want to send to the destinations specified later. The list of categories varies for each Azure service. Select AllMetrics if you want to collect platform metrics.
- Destination details: Select the checkbox for each destination that should be included in the diagnostic settings and then provide the details for each. If you select Log Analytics workspace as a destination, then you might need to specify the collection mode. See Collection mode for details.
Visualize your data with log queries
Once you configure your diagnostic settings and data flows into your Log Analytics workspace, use log queries to analyze and visualize your data. Log queries are written in Kusto Query Language (KQL) and can help you gain insights from the logs and metrics collected. You can make these configurations in both your workforce and external tenant.
Create a query
Log queries help you get the most value from the data collected in Azure Monitor Logs. A powerful query language lets you join data from multiple tables, aggregate large sets of data, and perform complex operations with minimal code. You can answer virtually any question and perform analysis as long as you collect the supporting data and understand how to construct the right query. For more information, see Get started with log queries in Azure Monitor.
- Sign in to the Azure portal.
- If you have access to multiple tenants, select the Settings icon in the top menu to switch to your workforce tenant from the Directories + subscriptions menu.
- From Log Analytics workspace window, select Logs
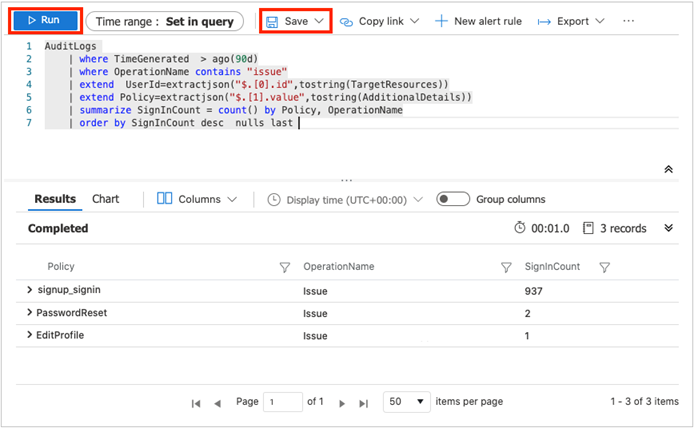
- In the query editor, paste the following Kusto Query Language query. This query shows policy usage by operation over the past x days. The default duration is set to 90 days (90d). Notice that the query is focused only on the operation where a token or code is issued by policy.
AuditLogs
| where TimeGenerated  > ago(90d)
| where OperationName contains "issue"
| extend  UserId=extractjson("$.[0].id",tostring(TargetResources))
| extend Policy=extractjson("$.[1].value",tostring(AdditionalDetails))
| summarize SignInCount = count() by Policy, OperationName
| order by SignInCount desc  nulls last
- Select Run. The query results are displayed at the bottom of the screen.
- To save your query for later use, select Save.
- Fill in the following details:
- Name - Enter the name of your query.
- Save as - Select
query. - Category - Select
Log.
- Select Save.
You can also change your query to visualize the data by using the render operator.
  AuditLogs
  | where TimeGenerated  > ago(90d)
  | where OperationName contains "issue"
  | extend  UserId=extractjson("$.[0].id",tostring(TargetResources))
  | extend Policy=extractjson("$.[1].value",tostring(AdditionalDetails))
  | summarize SignInCount = count() by Policy
  | order by SignInCount desc  nulls last
  | render  piechart

Change the data retention period
Azure Monitor Logs scale to support collecting, indexing, and storing massive amounts of data each day from any source in your enterprise or deployed in Azure. By default, logs are retained for 30 days, but you can increase the retention duration to up to two years. For more information, see manage usage and costs with Azure Monitor Logs. After you select the pricing tier, you can Change the data retention period.
Disable monitoring data collection
To stop collecting logs to your Log Analytics workspace, delete the diagnostic settings you created. You continue to incur charges for retaining log data you already collected into your workspace. If you no longer need the monitoring data you collected, you can delete your Log Analytics workspace and the resource group you created for Azure Monitor. Deleting the Log Analytics workspace deletes all data in the workspace and prevents you from incurring other data retention charges.
Using Microsoft Sentinel with External ID
Once External ID logs from an external tenant are sent to a Log Analytics workspace in a workforce tenant, you can ingest them into Microsoft Sentinel for monitoring, incident rules, alerts, and workbooks. You must configure Sentinel from the workforce tenant, as direct setup from the external tenant isn't supported. To use Sentinel:
Send logs to a Log Analytics workspace in a workforce tenant via Azure Monitor diagnostic settings. Direct configuration from the external tenant isn't supported.
In the Azure portal, add Microsoft Sentinel to the Log Analytics workspace. For more information, see Onboard to Microsoft Sentinel.
In the Defender Portal, open the Microsoft Sentinel Content Hub and install the Entra ID content pack.
Supported features
Analytics & Alerts: Configure incident rules using prebuilt templates; triggered alerts appear correctly.
Workbooks: Visualize and analyze collected logs using prebuilt workbooks.
For more information, see the Microsoft Sentinel Documentation.
These steps enable centralized monitoring, incident management, and visualization for External ID logs while using a supported, workforce-tenant setup.