Note
Access to this page requires authorization. You can try signing in or changing directories.
Access to this page requires authorization. You can try changing directories.
This tutorial walks you through implementing a medallion architecture by using materialized lake views in a Fabric lakehouse. By the end, you create an automated data transformation flow from bronze to silver to gold layers. This tutorial isn't a reference architecture, an exhaustive feature guide, or a prescriptive best-practices recommendation.
Prerequisites
Before you begin, complete these prerequisites:
- Sign in to your Power BI account, or sign up for a trial if you don't have one.
- Enable Microsoft Fabric in your tenant.
- Create a Fabric-enabled workspace.
- Create a Lakehouse with schemas enabled, and name it SalesLakehouse.
These prerequisites are used throughout this tutorial: the workspace and SalesLakehouse are required in the bronze, silver, and gold layer steps, and in scheduling and monitoring.
Scenario overview
This tutorial uses a fictional retail organization, Contoso, as the example scenario. Contoso organizes sales data in a medallion architecture to improve analytics outcomes by separating data into bronze (raw), silver (cleaned and enriched), and gold (aggregated and analyzed) layers.
The following diagram represents different entities in each layer of medallion architecture in SalesLakehouse:

Key entities in the scenario
The following entities correspond to the entities shown in the medallion architecture diagram in the previous section.
Orders: This entity includes details about each customer order, such as order date, shipment details, product category, and subcategory. Insights can be drawn to optimize shipping strategies, identify popular product categories, and improve order management.
Sales: By analyzing sales data, Contoso can assess key metrics like total revenue, profit margins, order priorities, and discounts. Correlations between these factors provide a clearer understanding of customer purchasing behaviors and the efficiency of discount strategies.
Location: This captures the geographical dimension of sales and orders, including cities, states, regions, and customer segments. It helps Contoso identify high-performing regions, address low-performing areas, and personalize strategies for specific customer segments.
Agent: With details on agents managing transactions, their commissions, and sales data, Contoso can evaluate individual agent performance, incentivize top performers, and design effective commission structures.
Agent commissions: Incorporating commission data ensures transparency and enables better cost management. Understanding the correlation between commission rates and agent performance helps refine incentive systems.
Sample data and notebooks
This tutorial uses a sample dataset from the Fabric samples repo. Download the full tutorial folder before you continue.
You use these assets to build the bronze layer first, and then create the silver and gold materialized lake views.
The downloaded tutorial folder contains:
- CSV folders:
agent,agent_commissions,location,orders, andsales. - Notebook file:
Notebook.
Create the medallion data flow
In this section, you create the bronze, silver, and gold layers for the medallion architecture in SalesLakehouse. These layers define the lineage-based data flow for your materialized lake views.
The high-level steps are as follows:
- Bronze Layer: Ingest raw data in the form of CSV files into the lakehouse. See Create bronze layer of sales analytics medallion architecture.
- Silver and Gold Layers: Cleanse data and curate data for analytics and reporting using materialized lake views. See Create silver and gold layers of medallion architecture.
Later in this tutorial, you schedule refresh for this lineage so the flow runs automatically.
Create bronze layer of sales analytics medallion architecture
In this section, you create the bronze layer by uploading the contents of the downloaded tutorial folder into SalesLakehouse. These files correspond to the entities described earlier in this tutorial.
In your workspace, open SalesLakehouse and go to the Files section.
Upload the contents of the downloaded
tutorialfolder, preserving the folder structure:agentagent_commissionslocationorderssales
After upload, a folder named tutorial is created under Files, and it contains these subfolders.
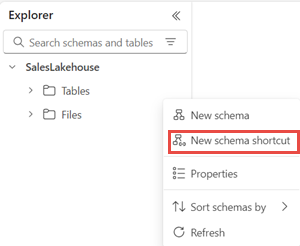
Next create a shortcut to it from the Tables section. Select ... next to the Tables section, and select New schema shortcut and then Microsoft OneLake. Choose the SalesLakehouse from the data source types. Expand the Files section and choose the tutorial folder and select Create. You can also use other alternate options to get data into the Lakehouse.
From the Tables section, rename the tutorial folder as bronze.

Create silver and gold layers of medallion architecture
From the downloaded
tutorialfolder, upload theNotebookfile to your workspace.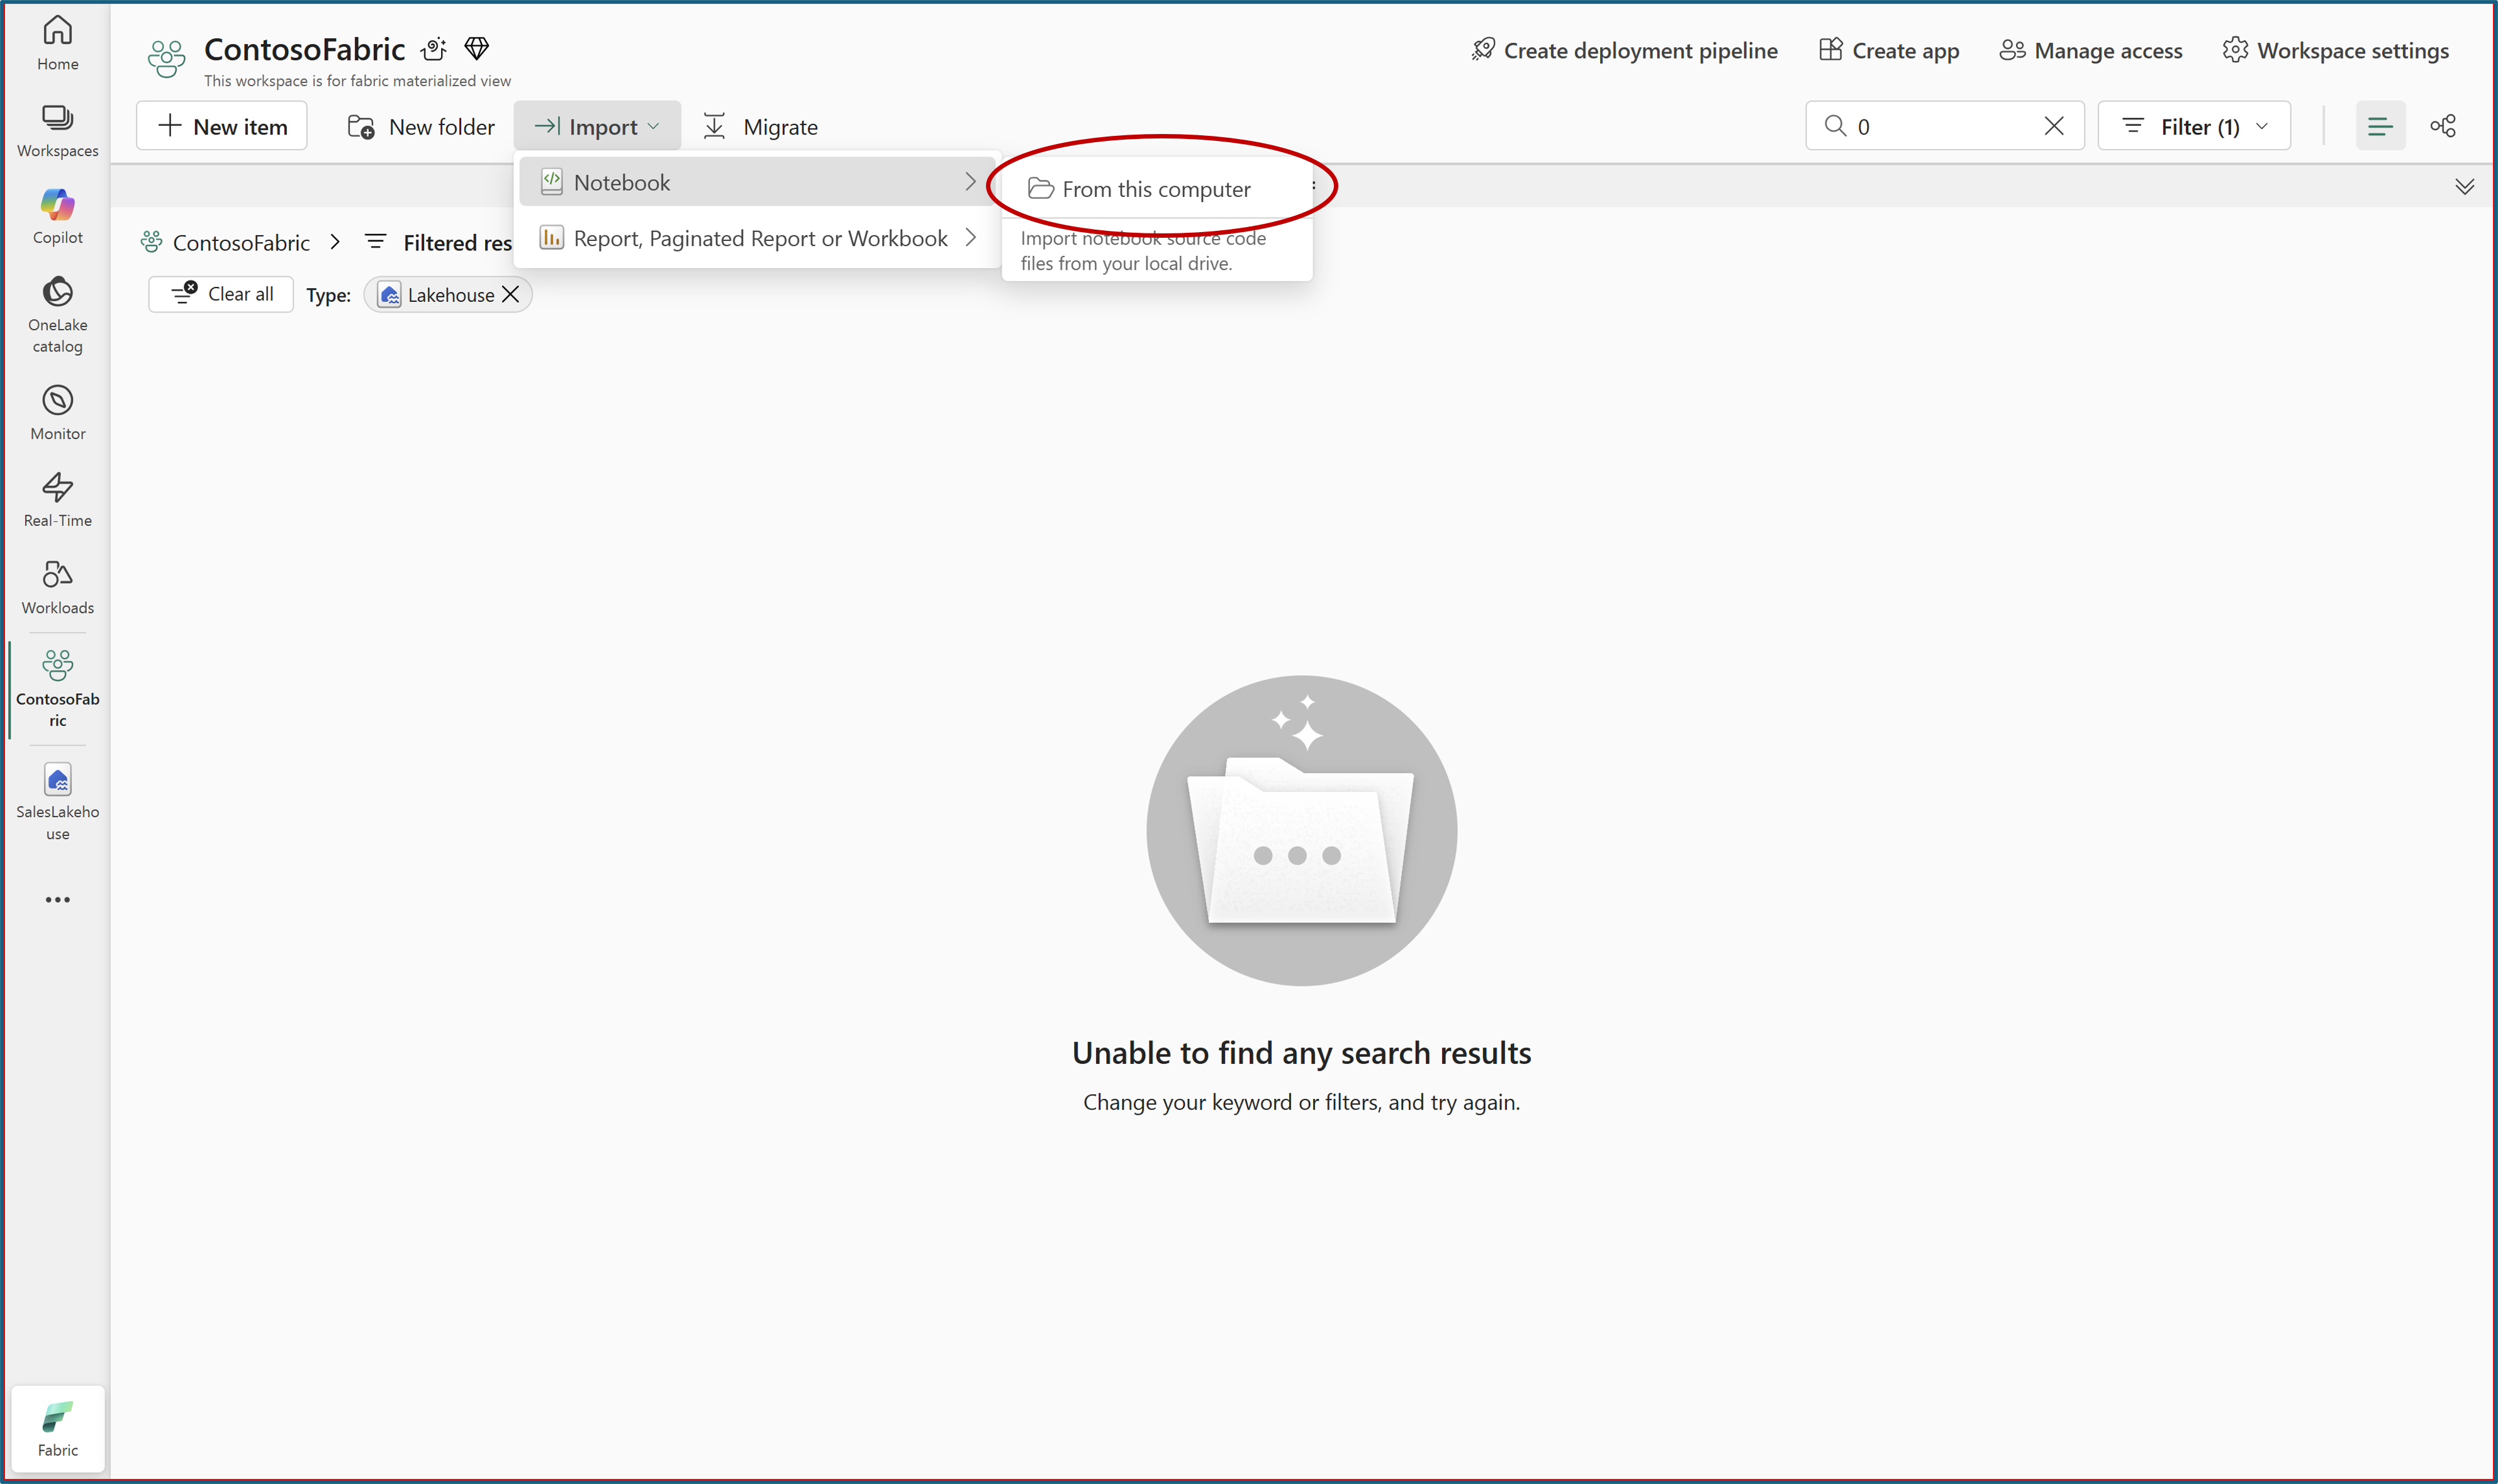
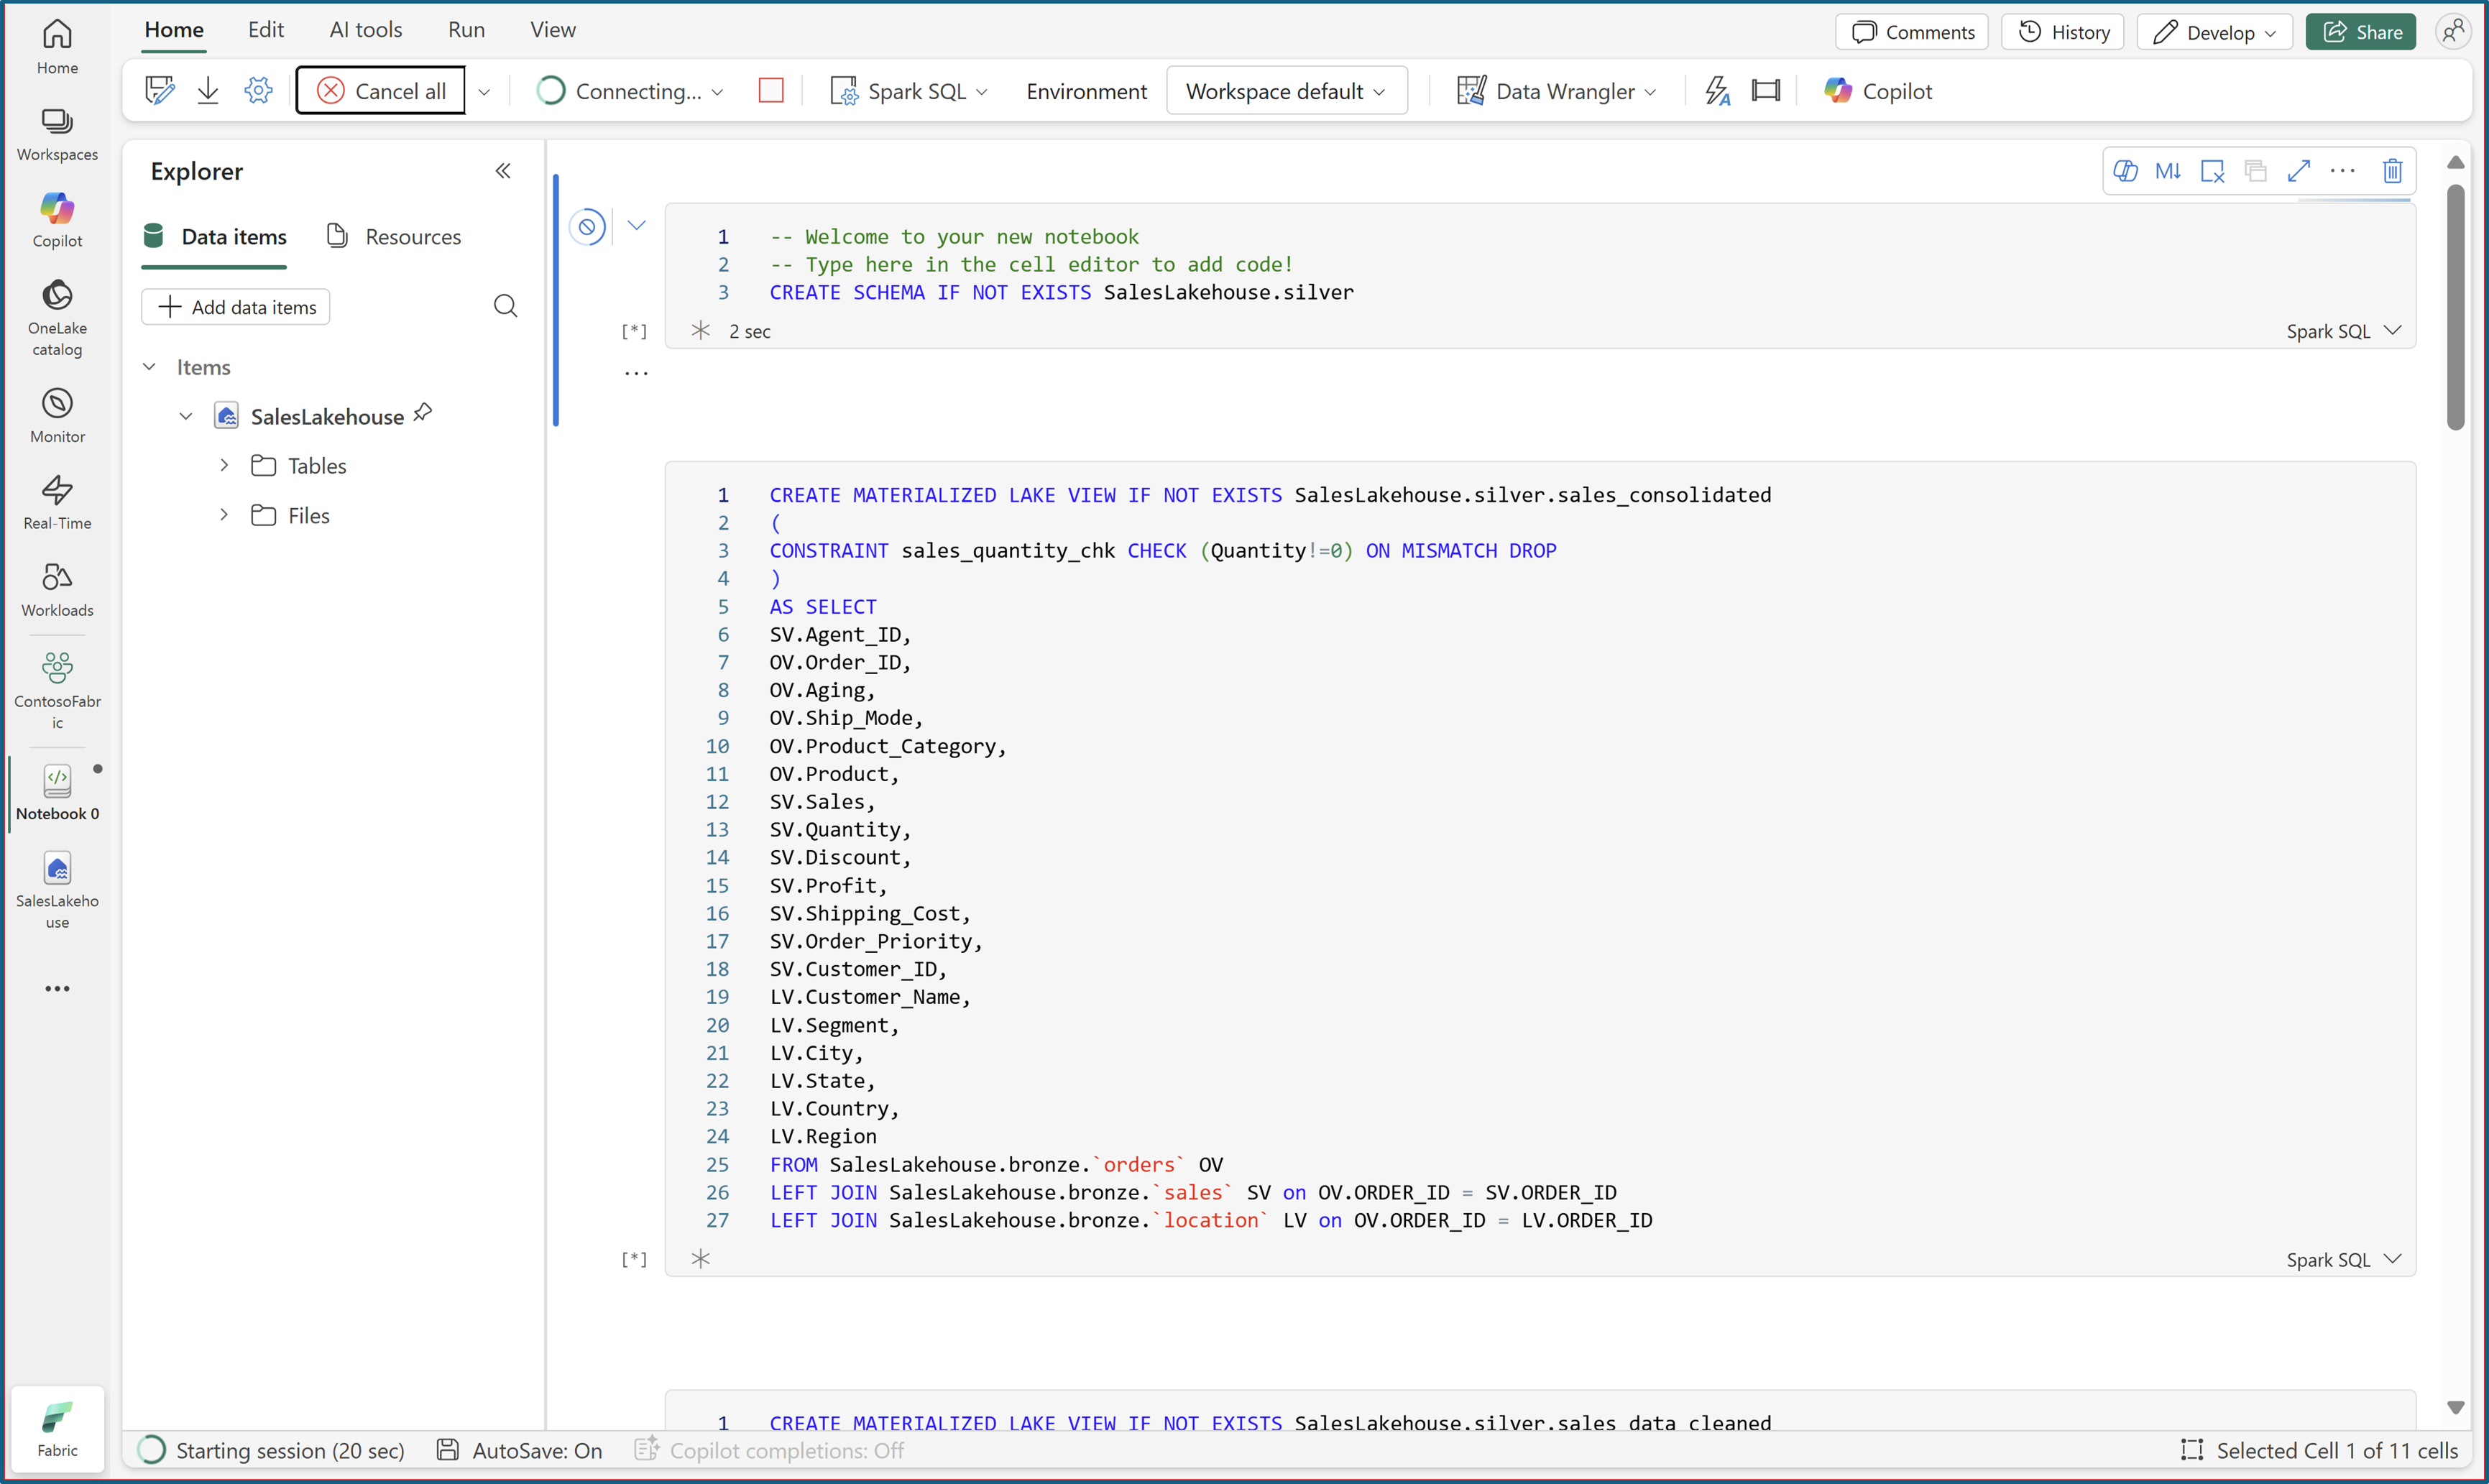
Open the uploaded notebook from SalesLakehouse. For more information, see Explore the lakehouse data with a notebook.
Run all notebook cells by using Spark SQL to create the materialized lake views with data quality constraints.
After all cells run successfully, refresh SalesLakehouse to view the new materialized lake views under the silver and gold schemas.


Schedule refresh
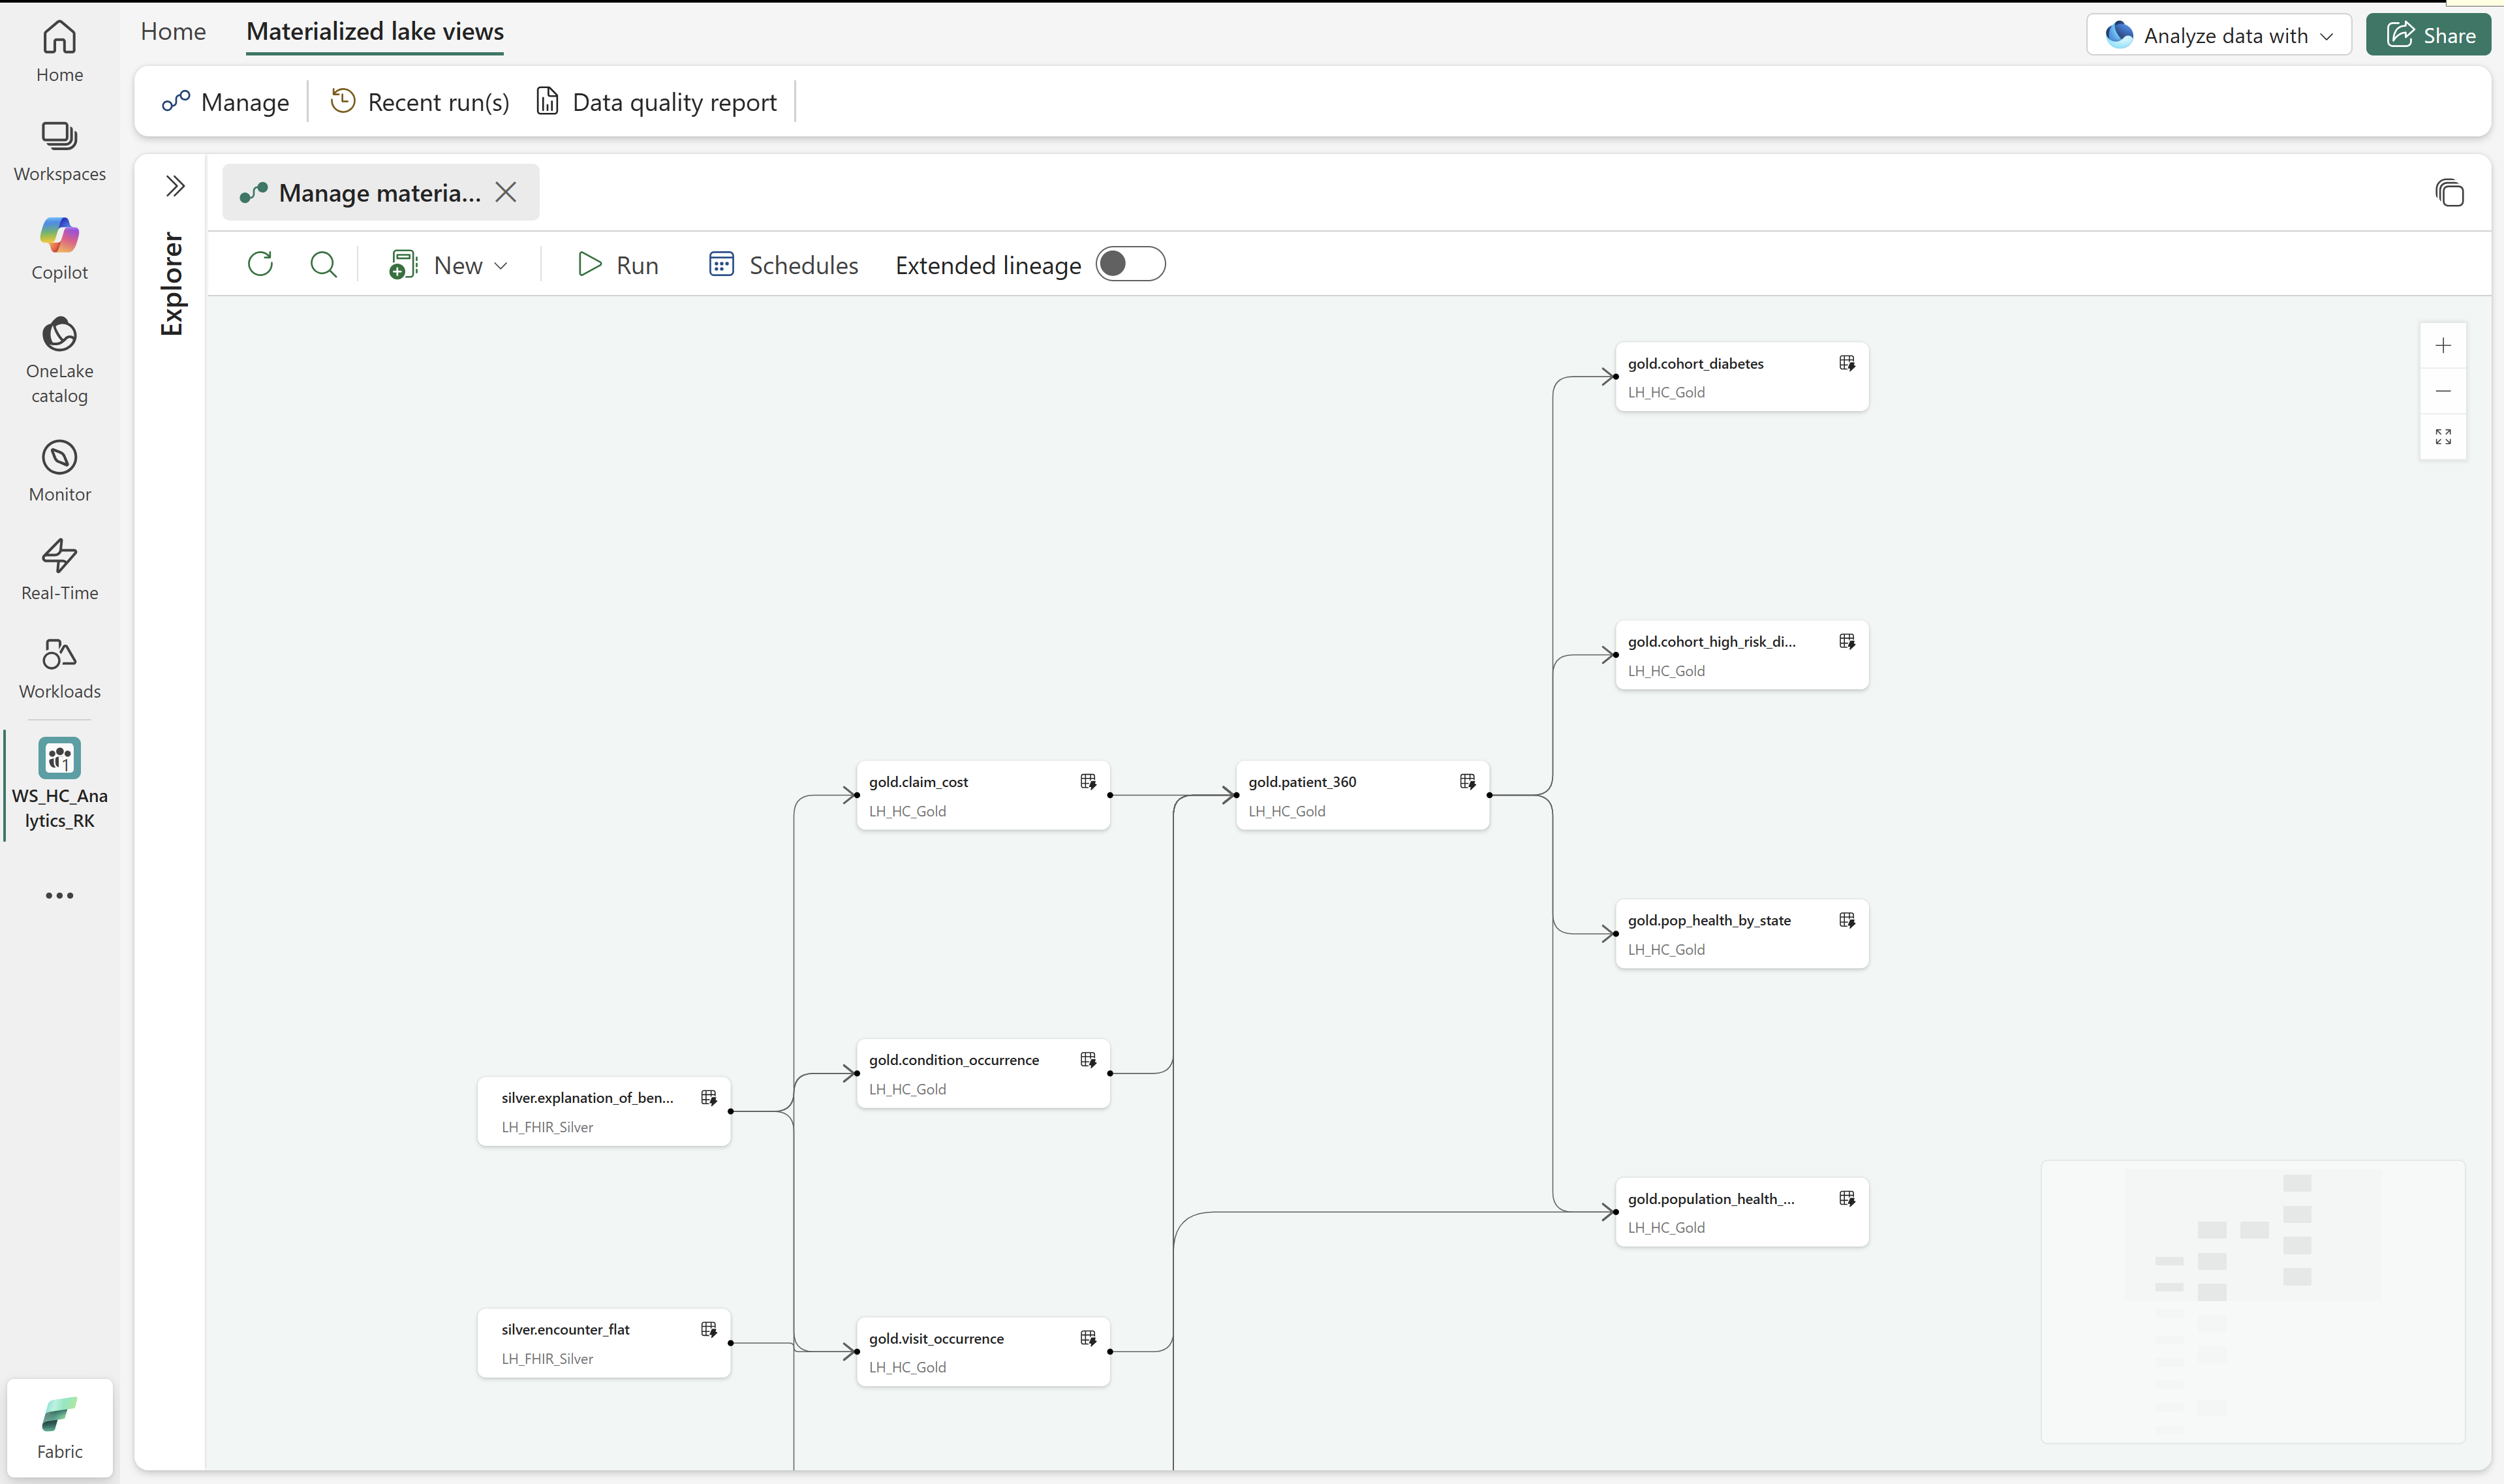
In SalesLakehouse, open the Materialized lake views tab and select Manage to open lineage.
The lineage view shows the autogenerated dependency graph, where each dependent materialized lake view appears as a node.
Select Schedule on the ribbon, and then select New schedule in the schedules pane.
Turn on the schedule, provide a name, and select the materialized lake views to refresh.
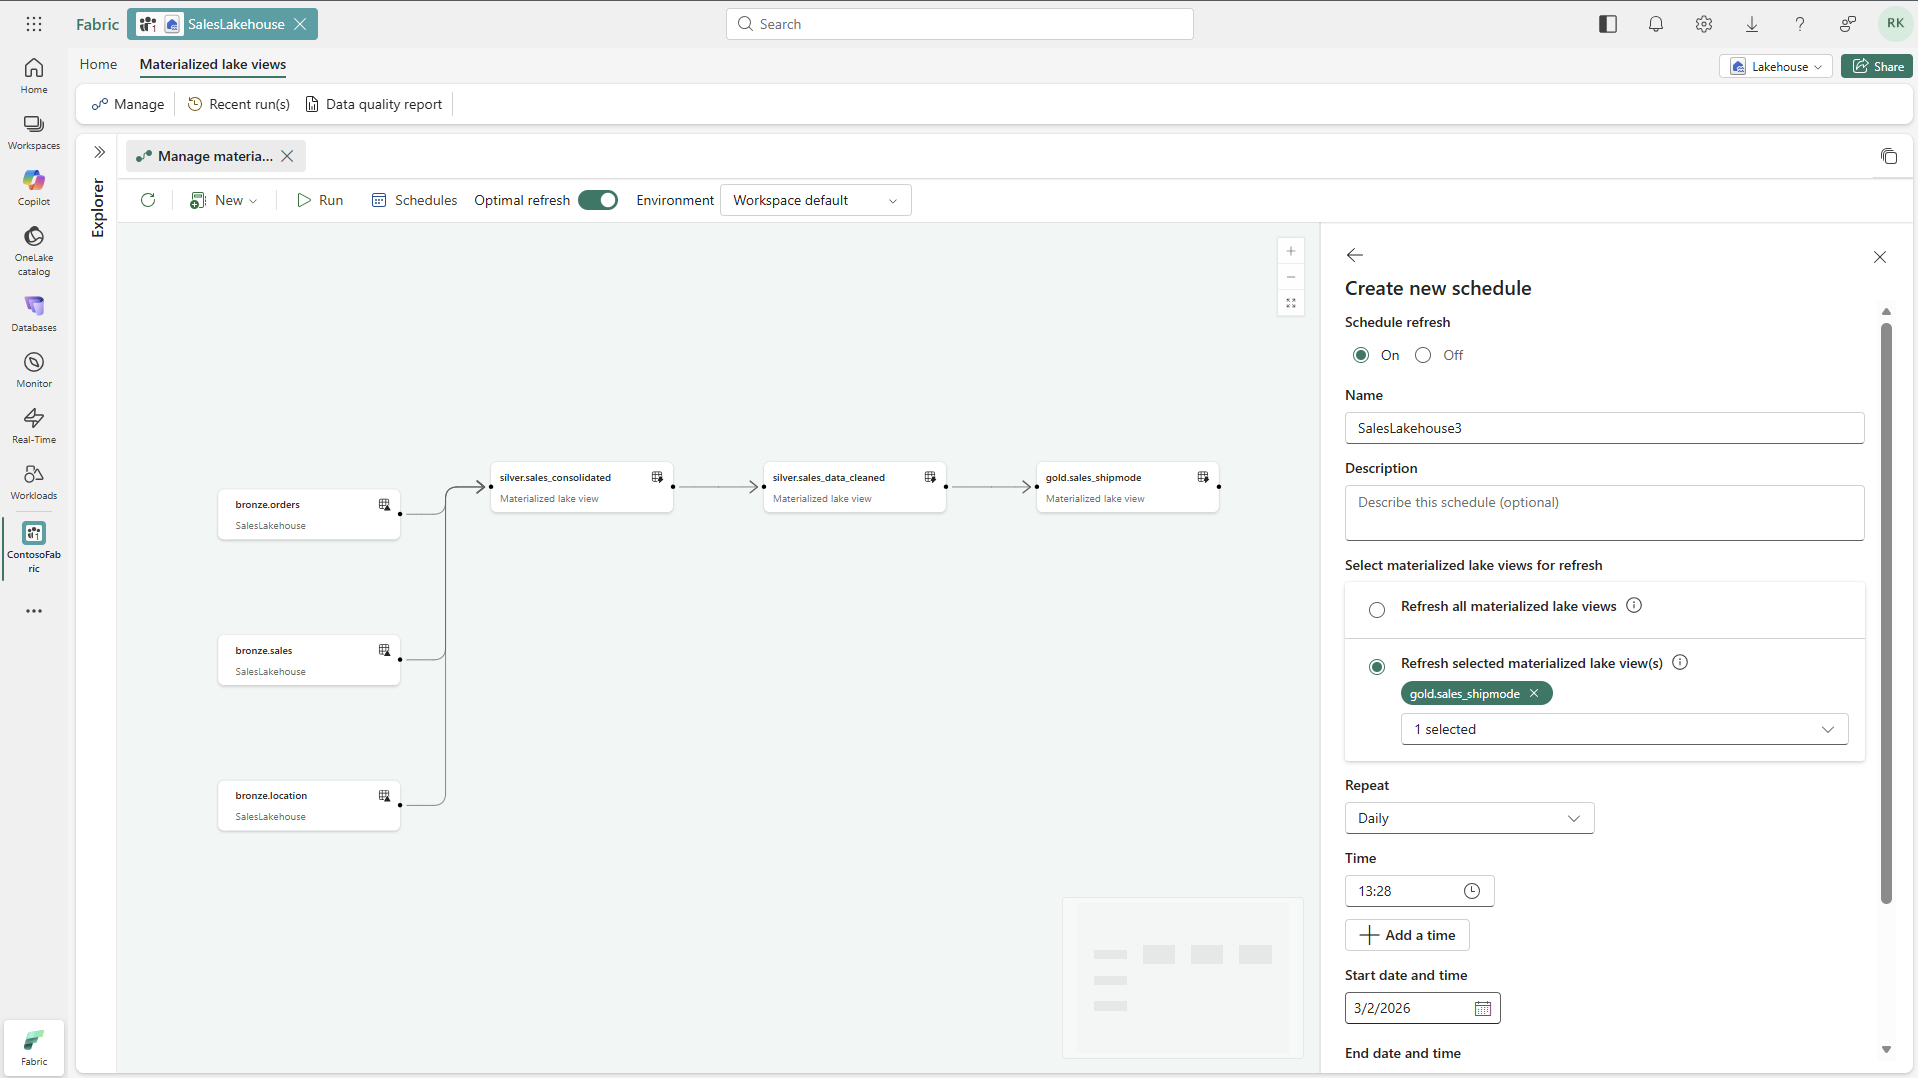
Set the schedule frequency, and then select Apply.
To run the schedule immediately, select Run on the created schedule from schedule pane.


Monitoring and troubleshooting
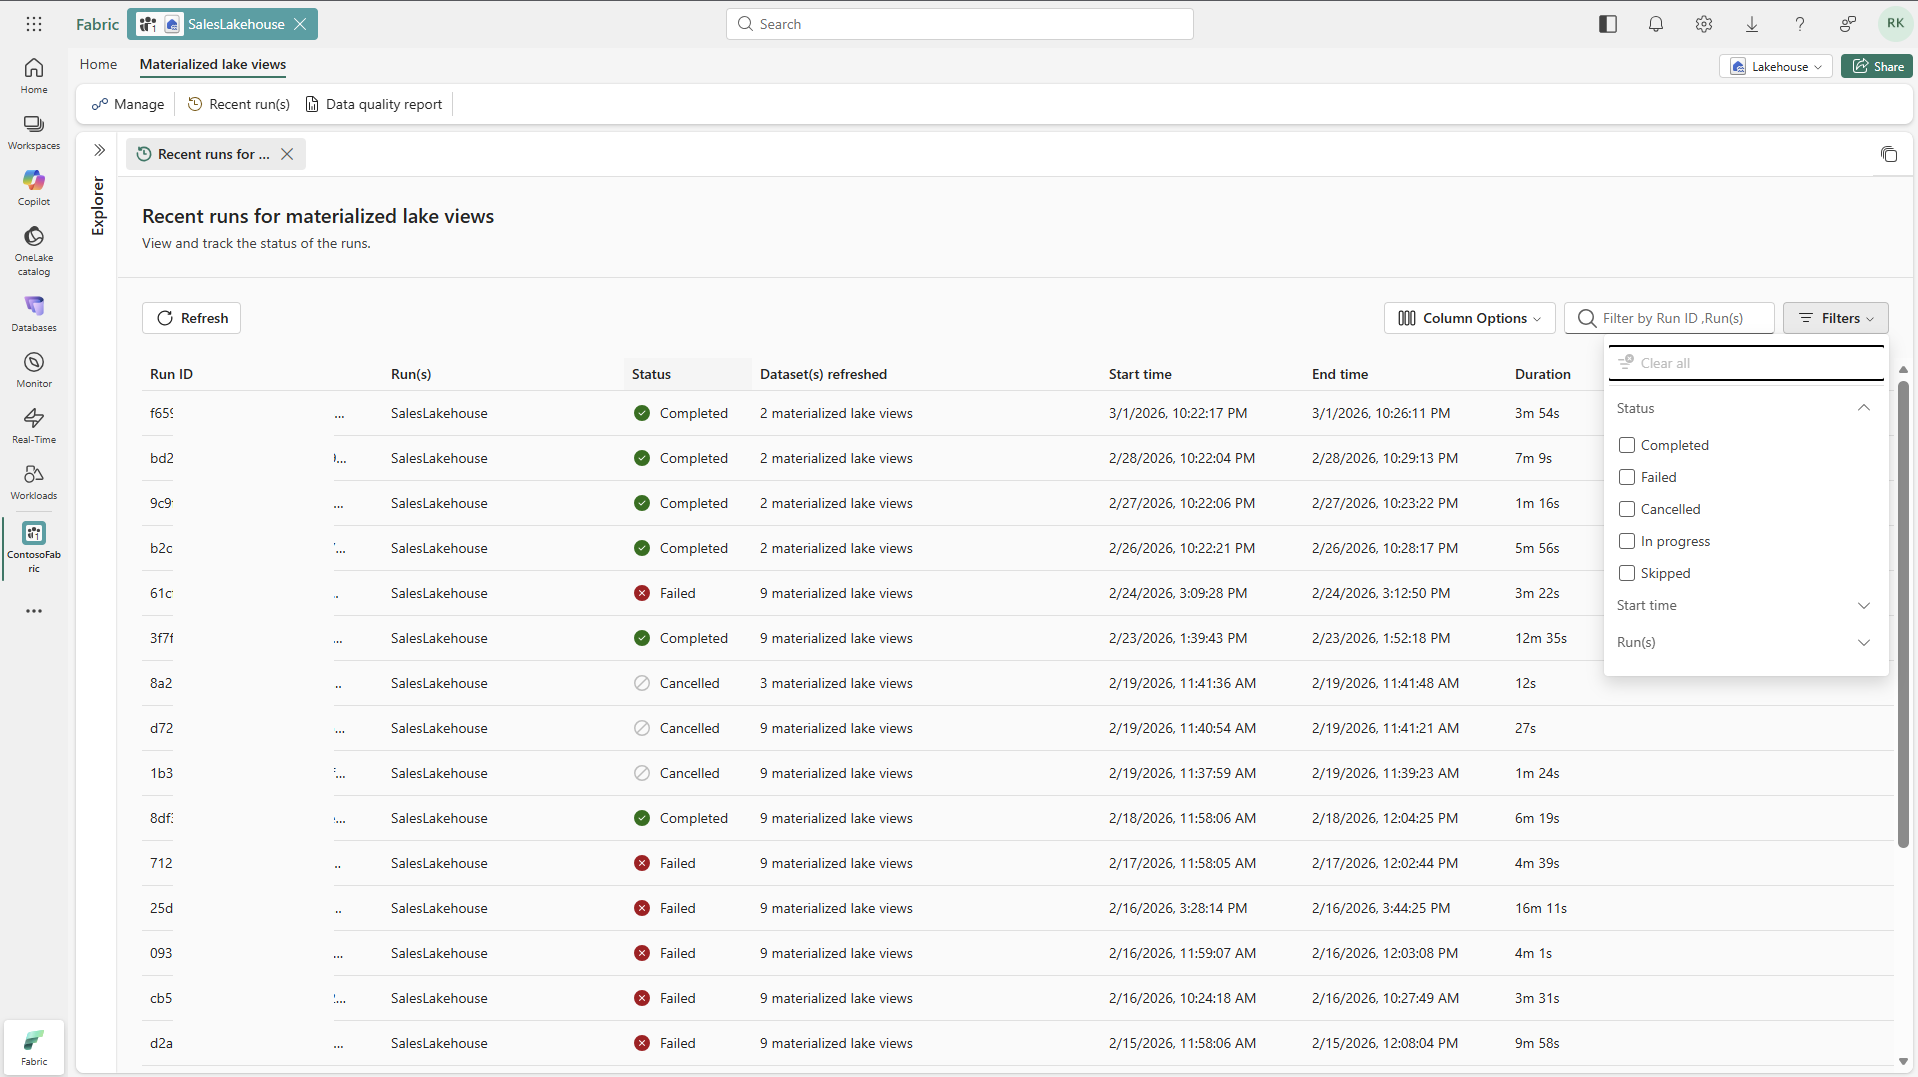
In the Recent run(s) tab, review run statuses.
Select a Run ID to open details for that run.
In the run details tab, review the right-side details panel and the bottom activity panel for execution status.
Select a materialized lake view node in lineage to see execution details, its ABFS path, and a link to detailed logs.
If a node status is Failed, review the displayed error message.
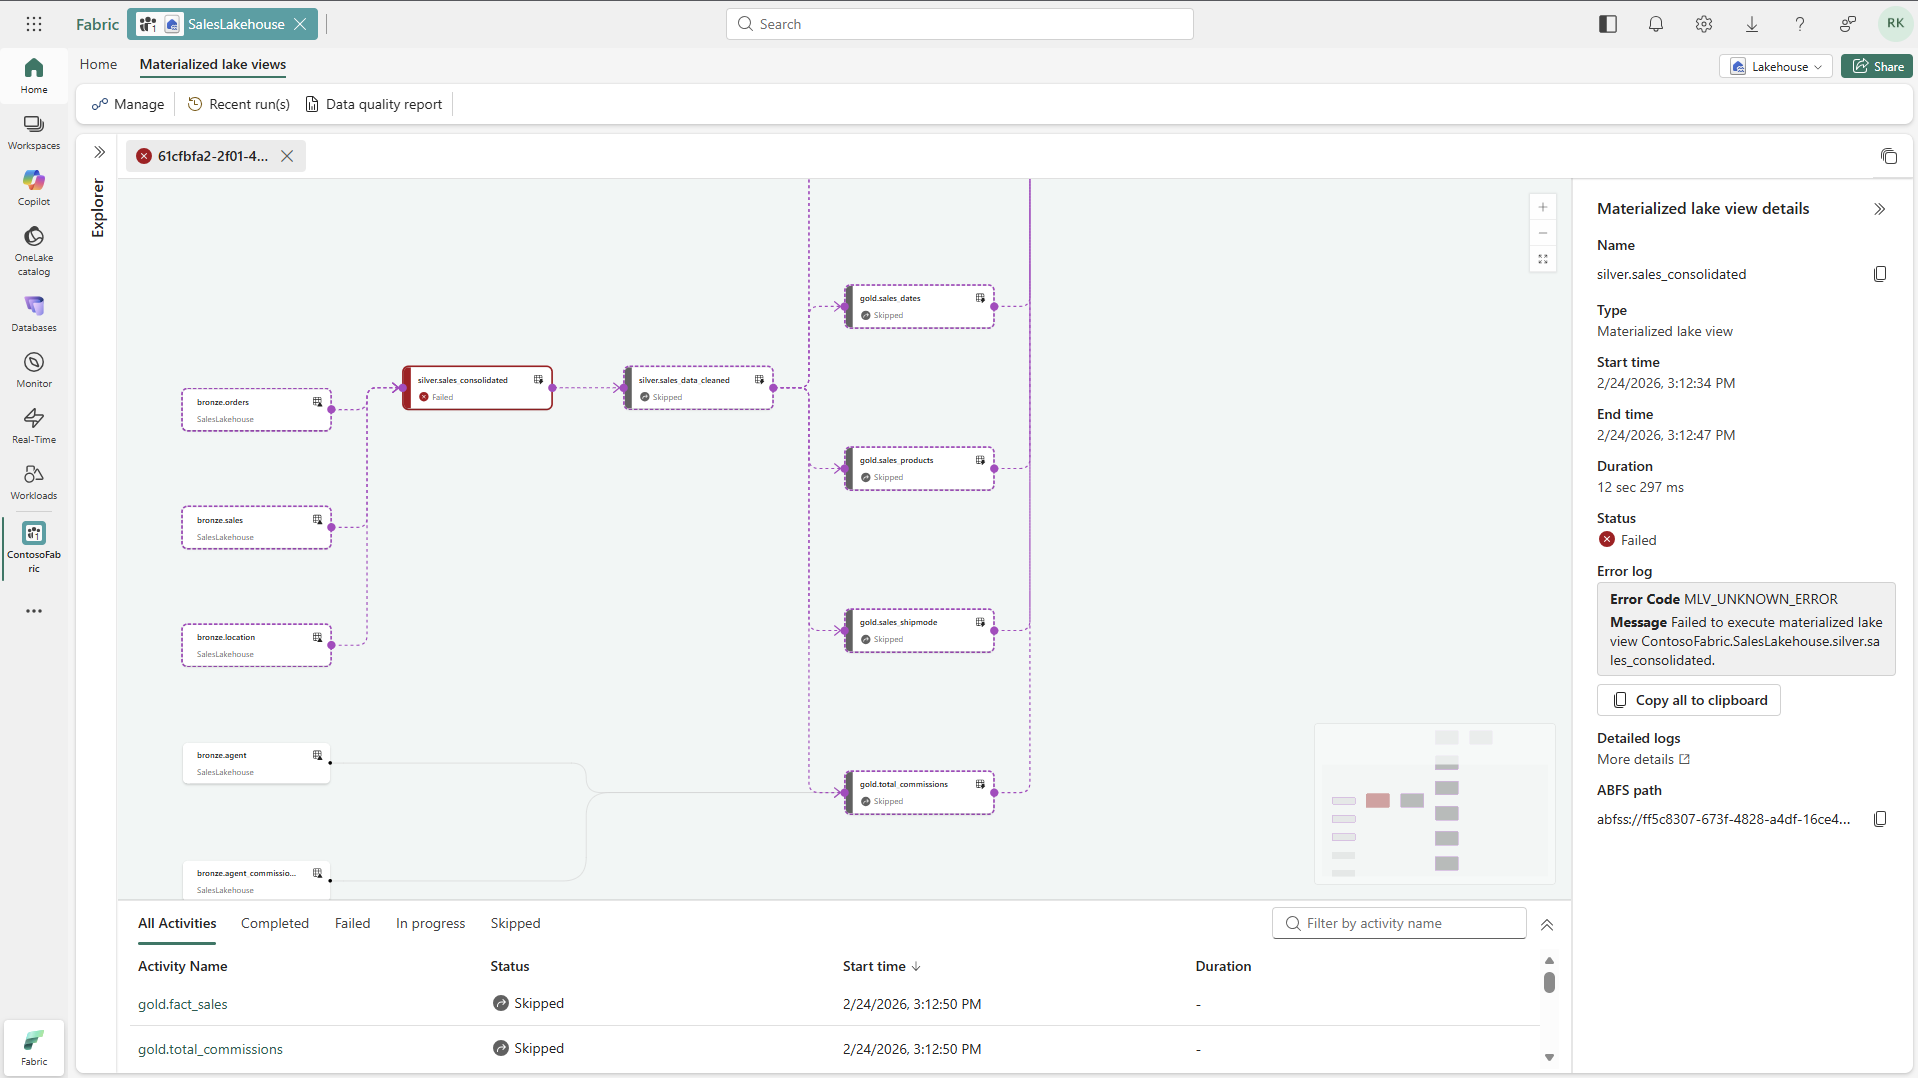
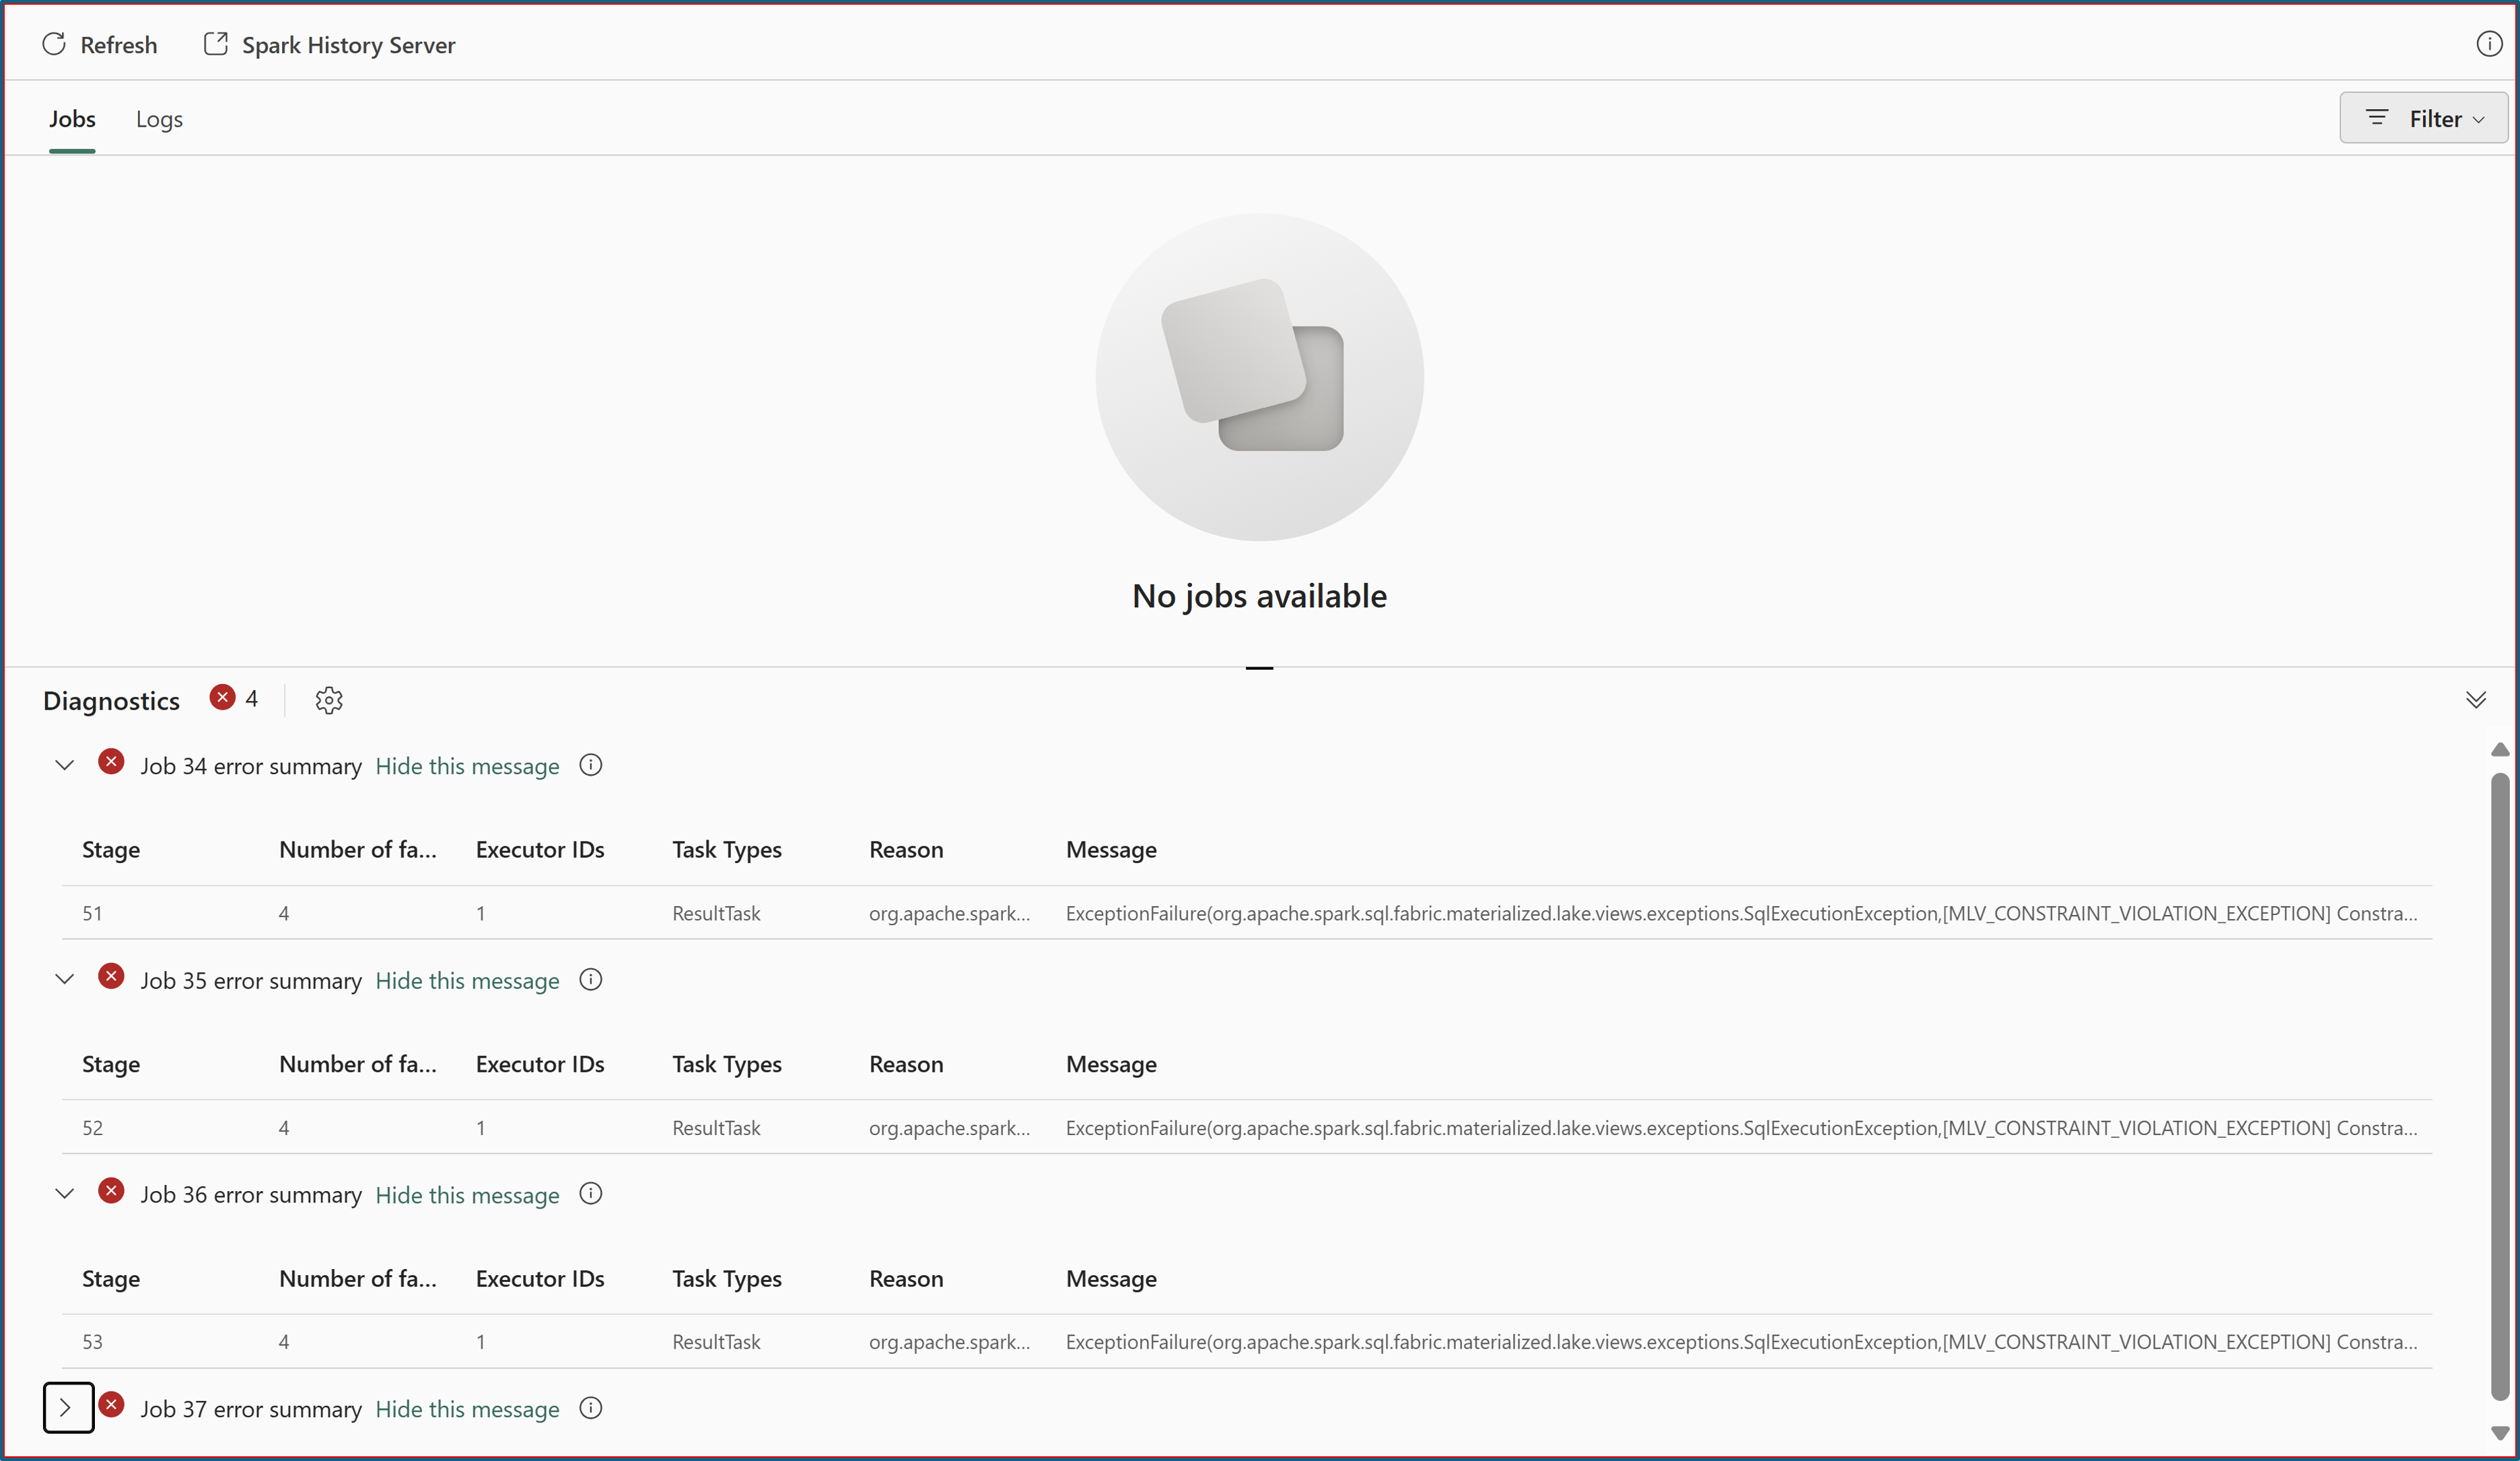
Select Detailed logs to open Monitor Hub and review Spark error logs.
Select the Data quality report tab of Materialized lake views to create or view an autogenerated data quality report.


