Model data in the default Power BI semantic model in Microsoft Fabric
Applies to: ✅ SQL analytics endpoint, Warehouse, and Mirrored Database in Microsoft Fabric
The default Power BI semantic model inherits all relationships between entities defined in the model view and infers them as Power BI semantic model relationships, when objects are enabled for BI (Power BI Reports). Inheriting the warehouse's business logic allows a warehouse developer or BI analyst to decrease the time to value towards building a useful semantic model and metrics layer for analytical business intelligence (BI) reports in Power BI, Excel, or external tools like Tableau that read the XMLA format.
While all constraints are translated to relationships, currently in Power BI, only one relationship can be active at a time, whereas multiple primary and foreign key constraints can be defined for warehouse entities and are shown visually in the diagram lines. The active Power BI relationship is represented with a solid line and the rest is represented with a dotted line. We recommend choosing the primary relationship as active for BI reporting purposes.
Automatic translation of constraints to relationships in the default Power BI semantic model is only applicable for tables in the Warehouse in Microsoft Fabric, not currently supported in the SQL analytics endpoint.
Note
Microsoft has renamed the Power BI dataset content type to semantic model. This applies to Microsoft Fabric as well. For more information, see New name for Power BI datasets.
Data modeling properties
The following table provides a description of the properties available when using the model view diagram and creating relationships:
| Column name | Description |
|---|---|
| FromObjectName | Table/View name "From" which relationship is defined. |
| ToObjectName | Table/View name "To" which a relationship is defined. |
| TypeOfRelationship | Relationship cardinality, the possible values are: None, OneToOne, OneToMany, ManyToOne, and ManyToMany. |
| SecurityFilteringBehavior | Indicates how relationships influence filtering of data when evaluating row-level security expressions and is a Power BI specific semantic. The possible values are: OneDirection, BothDirections, and None. |
| IsActive | A Power BI specific semantic, and a boolean value that indicates whether the relationship is marked as Active or Inactive. This defines the default relationship behavior within the semantic model. |
| RelyOnReferentialIntegrity | A boolean value that indicates whether the relationship can rely on referential integrity or not. |
| CrossFilteringBehavior | Indicates how relationships influence filtering of data and is Power BI specific. The possible values are: 1 - OneDirection, 2 - BothDirections, and 3 - Automatic. |
Add or remove objects to the default Power BI semantic model
In Power BI, a semantic model is always required before any reports can be built, so the default Power BI semantic model enables quick reporting capabilities on top of the warehouse. Within the warehouse, a user can add warehouse objects - tables or views to their default Power BI semantic model. They can also add other semantic modeling properties, such as hierarchies and descriptions. These properties are then used to create the Power BI semantic model's tables. Users can also remove objects from the default Power BI semantic model.
- Open a warehouse in your Fabric workspace.
- Navigate to Model view by selecting the Model view icon.
To add objects such as tables or views to the default Power BI semantic model, you have options:
- Manually enable the Sync the default Power BI semantic model setting that will automatically add objects to the semantic model. For more information, see Sync the default Power BI semantic model.
- Manually add objects to the semantic model.
The auto detect experience determines any tables or views and opportunistically adds them.
The manually detect option in the ribbon allows fine grained control of which object(s), such as tables and/or views, should be added to the default Power BI semantic model:
- Select all
- Filter for tables or views
- Select specific objects
To remove objects, a user can use the manually select button in the ribbon and:
- Un-select all
- Filter for tables or views
- Un-select specific objects
Tip
We recommend reviewing the objects enabled for BI and ensuring they have the correct logical relationships to ensure a smooth downstream reporting experience.
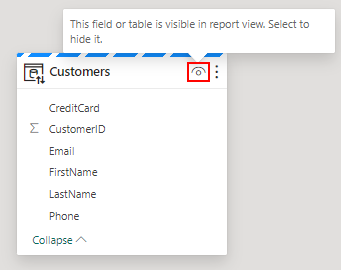
Hide elements from downstream reporting
You can hide elements at the table or column level of your warehouse from downstream reporting by using the Model layout canvas options, as shown in the following image.