Note
Access to this page requires authorization. You can try signing in or changing directories.
Access to this page requires authorization. You can try changing directories.
In this tutorial, you build a semantic view to analyze sales by region. You load sample sales, store, and product data, describe three tables and two relationships, add revenue metrics, and query the results.
Important
This feature is in preview.
In this tutorial, you learn how to:
- Upload sample CSV files and load them into lakehouse tables.
- Create a semantic view in a lakehouse.
- Describe your tables and relationships in a schema file.
- Define DAX metrics in a metrics file.
- Connect reports and agents to the generated model.
- Query the model to verify your sales metrics.
Prerequisites
- A Fabric-enabled workspace where you have the Contributor role or higher.
- A lakehouse with schemas enabled that you have Write permission on. Create a new lakehouse named
lakehouse_salesfor this tutorial to avoid conflicts with existing tables.
In this preview, use a workspace without deployment pipeline, Git, or Power Platform solution connections and without workspace-level private links enabled. Check the workspace restrictions before preparing the sample data.
Prepare the sample data
Use the following CSV files from the Microsoft Fabric samples repository. You don't need a notebook, pipeline, or dataflow.
| Sample file | Destination table in the dbo schema |
Rows |
|---|---|---|
| FactSales.csv | factsales |
6 |
| DimStore.csv | dimstore |
3 |
| DimProducts.csv | dimproducts |
3 |
- Open each sample file link and select Download raw file to save the CSV file.
- Open
lakehouse_sales. Under Files, create a folder namedsemantic-view-samples. - Select the folder's ellipsis (...), select Upload > Upload files, and upload the three CSV files.
- For each uploaded file, open its context menu and select Load to tables > New table.
- Select the
dboschema and enter the destination table name from the preceding table. Select Column header, use a comma (,) as the separator, and select Load. - Under Tables, expand
dboand confirm thatfactsales,dimstore, anddimproductsexist. Preview each table and check the row counts and columns.
For more information about these steps, see Upload a CSV file to a lakehouse and Load to Delta Lake tables.
The examples use these columns:
| Dataset name in YAML | Columns used in this tutorial |
|---|---|
sales |
SaleId, StoreId, ProductId, Units, RevenueUSD |
stores |
StoreId, Region |
products |
ProductId, Category |
Note
If you use your own data instead, substitute your table and column names throughout the tutorial. The expected results in this article apply only to these sample files.
Step 1: Create the view
Open
lakehouse_sales.On the ribbon, select New semantic view.

Enter
salesin Semantic view name, and then select Create.

The Semantic Views folder and the sales folder are created at Context/Semantic Views/sales/. The process adds a starter file named sales_semantic_view.yaml with commented examples.

Step 2: Describe your tables
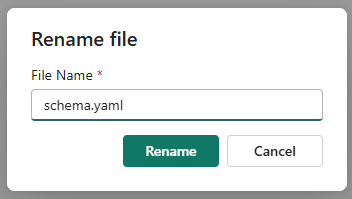
In the Explorer pane, right-click the starter file, select Rename, and rename it to schema.yaml. Open the file and replace its contents with the following definition. It declares three datasets and the two relationships that connect them.
For supported YAML properties, see Semantic view YAML syntax reference.
version: 0.2.0.dev0
name: sales
description: Sales semantic view tutorial.
datasets:
  - name: sales
    source: dbo.factsales
    description: One row per sales transaction line.
  - name: stores
    source: dbo.dimstore
    description: One row per store, including its region.
  - name: products
    source: dbo.dimproducts
    description: One row per product, including its category.
relationships:
  - name: sales_to_stores
    from: sales
    to: stores
    from_columns:
      - StoreId
    to_columns:
      - StoreId
  - name: sales_to_products
    from: sales
    to: products
    from_columns:
      - ProductId
    to_columns:
      - ProductId
Select Save.

Saving writes the YAML file only. Publishing validates the view's definitions and creates or updates the semantic model that reports and agents query. You publish after adding the metrics in this tutorial. For details, see Publish a semantic view.
Step 3: Define your metrics
In DAX, use each dataset's YAML name, not its underlying source. For example, reference 'sales'[RevenueUSD] for the dataset named sales, whose source is dbo.factsales.
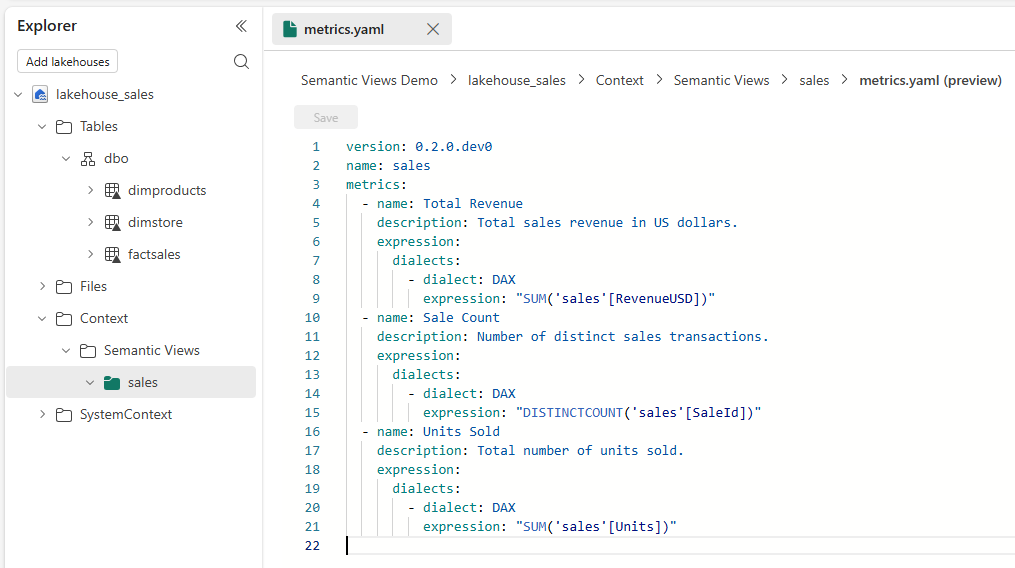
Create a local file named metrics.yaml with the following content, and then upload it to the same view folder. Publishing merges the schema and metrics files into one view.
This tutorial keeps schema and metrics in separate files so you can maintain table and relationship definitions separately from calculations. A single file is also supported. To share schema and metrics independently through OneLake shortcuts, place them in separate subfolders. See Organize the view folder for layouts and sharing options.
This example keeps the model-level description in the schema file. See Document and model for rules when combining files.
version: 0.2.0.dev0
name: sales
metrics:
  - name: Total Revenue
    description: Total sales revenue in US dollars.
    expression:
      dialects:
        - dialect: DAX
          expression: "SUM('sales'[RevenueUSD])"
  - name: Sale Count
    description: Number of distinct sales transactions.
    expression:
      dialects:
        - dialect: DAX
          expression: "DISTINCTCOUNT('sales'[SaleId])"
  - name: Units Sold
    description: Total number of units sold.
    expression:
      dialects:
        - dialect: DAX
          expression: "SUM('sales'[Units])"
Uploaded files are saved automatically.
Step 4: Publish the view
In the Explorer pane, expand
Context>Semantic Views.Right-click the
salesfolder, and then select Publish.
In the confirmation dialog, select Publish.

Publishing combines both files and creates the sales semantic model.
The first publish might take a while. Wait for the publish result before continuing.

If publishing fails, manually correct the reported errors in the source files, save, and retry Publish. Review any warnings before continuing. For details, see Check the result.
Step 5: Check the model
Inspect the generated model. Opening web modeling requires model Write permission. The model inherits this permission from the lakehouse Write permission required for this tutorial. The model opens for inspection, not editing.
Expand
SystemContext>Semantic Views.Right-click the
salesfolder, and then select Open in model view.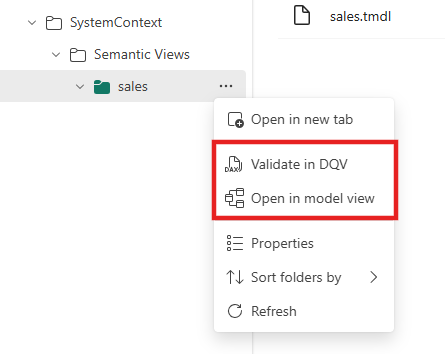
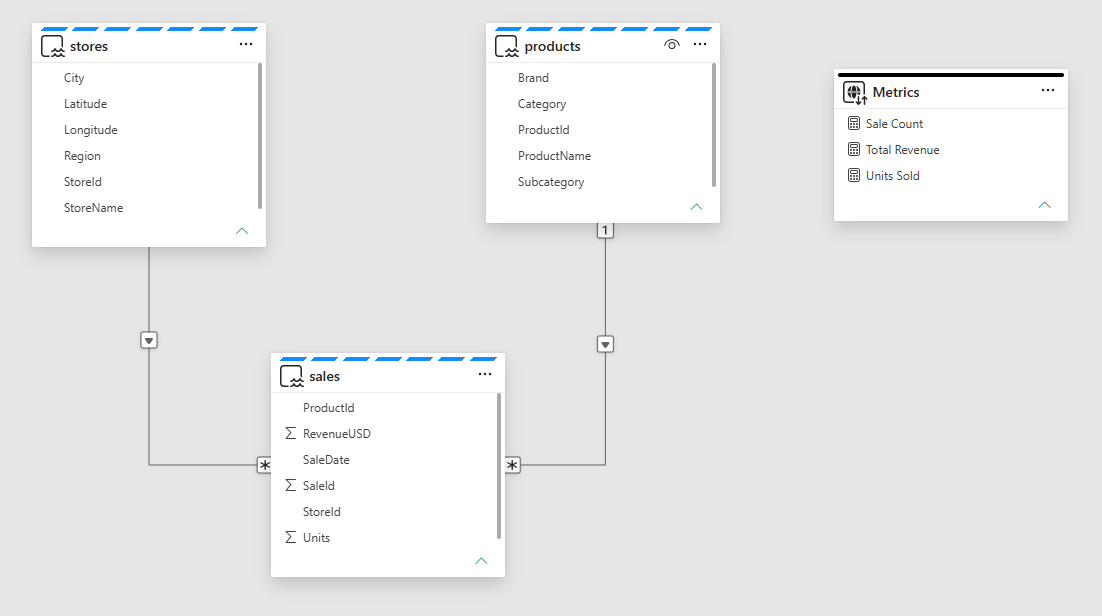
Confirm three tables, two relationships, and a Metrics table that contains your three measures.
To test a metric in DAX query view (DQV), select Validate in DQV on the same folder and run a query:
EVALUATE
SUMMARIZECOLUMNS(
    'stores'[Region],
    "Revenue", [Total Revenue],
    "Sales", [Sale Count],
    "Units", [Units Sold]
)
ORDER BY 'stores'[Region]
Confirm that the results match the sample data.
| Region | Revenue | Sales | Units |
|---|---|---|---|
| France | 302 | 2 | 56 |
| Germany | 290 | 2 | 53 |
| Netherlands | 263 | 2 | 49 |
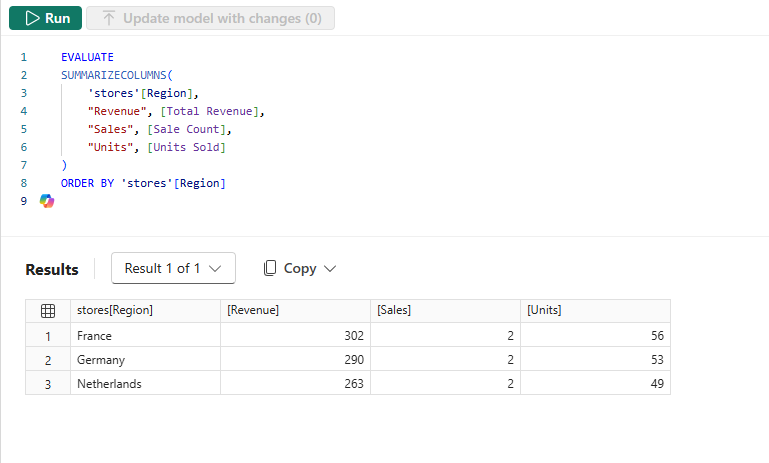
To check the product relationship, replace 'stores'[Region] with 'products'[Category] in both the grouping and the ORDER BY clause. The expected results are:
| Category | Revenue | Sales | Units |
|---|---|---|---|
| Ice Cream | 747 | 5 | 140 |
| Sorbet | 108 | 1 | 18 |
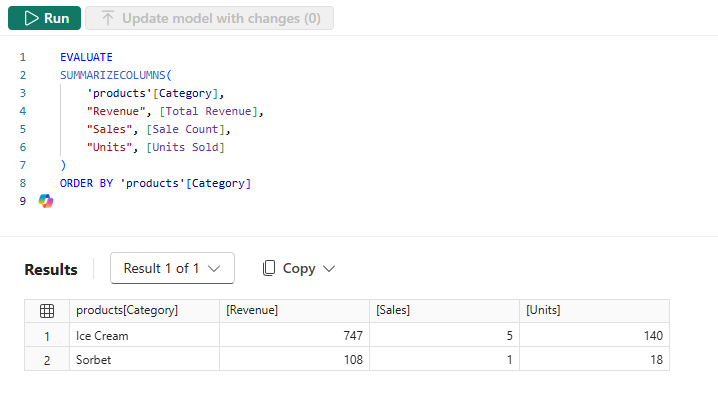
If results don't match, check the loaded row counts, numeric column types, and relationship columns before continuing.
Step 6: Query the view
The generated semantic model is what reports and agents connect to.
- From a data agent, select Add data source, then select the
salessemantic model. - From Power BI, create a live connection to the model and build a report on the published metrics.
For details on both paths, see Consume semantic views.
Step 7: Change a metric
Add another metric and publish the updated definition:
Open
metrics.yamlin the view folder and add the following entry under the existingmetricslist:- name: Average Revenue per Sale description: Revenue in US dollars divided by the number of sales. expression: dialects: - dialect: DAX expression: "DIVIDE([Total Revenue], [Sale Count])"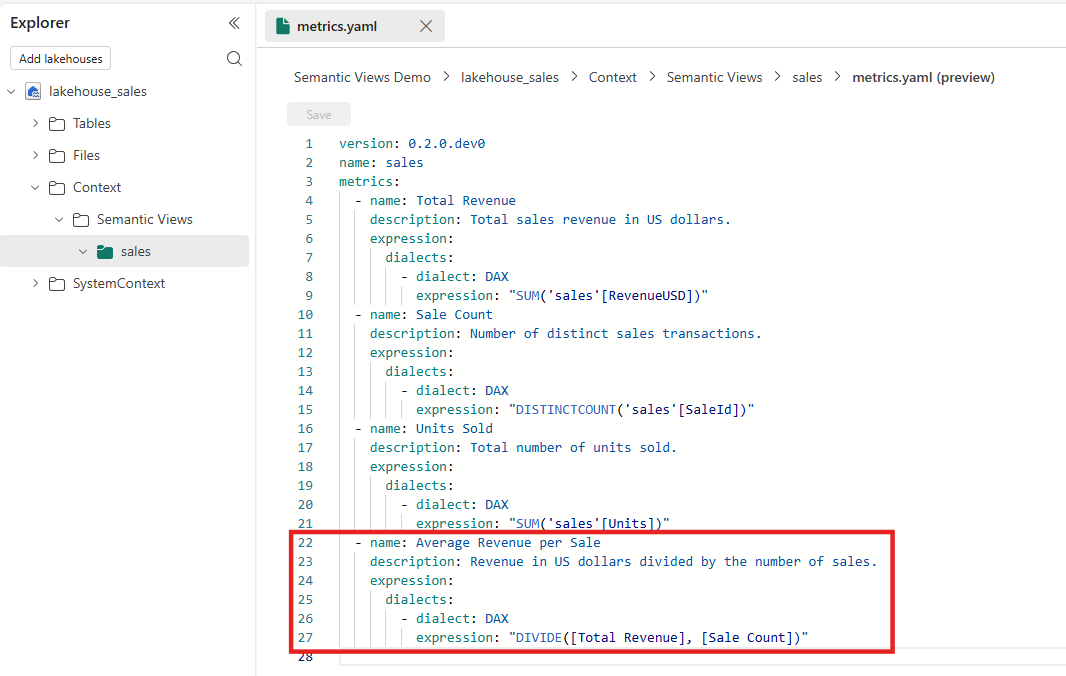
Select Save.
Right-click the view folder under
Context, select Publish, then confirm Publish in the dialog.
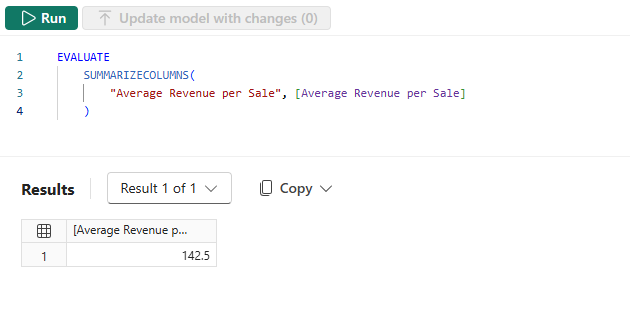
Confirm that Average Revenue per Sale appears in the model. Select Validate in DQV and run:
EVALUATE
SUMMARIZECOLUMNS(
    "Average Revenue per Sale", [Average Revenue per Sale]
)
With no filters, its value is 142.5 (855 divided by 6). Reports and agents connected to this model can now use it.
Clean up resources
If you don't want to keep what you built, delete both pieces:
- Delete the
salesfolder underContext/Semantic Views. - Delete the
salessemantic model from the workspace.
Deleting the folder alone doesn't delete the model or immediately remove its generated output in SystemContext. For generated-output cleanup and the limitation when deleting the last view in a lakehouse, see Delete a semantic view.
If you created lakehouse_sales only for this tutorial, delete the lakehouse when you're finished. If you used an existing lakehouse instead, delete only the sample tables and the semantic-view-samples folder you created for this tutorial. Don't delete tables or files used by other workloads.