Note
Access to this page requires authorization. You can try signing in or changing directories.
Access to this page requires authorization. You can try changing directories.
Turning raw data into actionable insights is a key step in the data lifecycle. Microsoft Fabric combines Power BI, Real-Time Intelligence, and Fabric IQ to help business analysts explore, visualize, and respond to data in near real time. Using semantic models, streaming data, and AI-enhanced analytics, you can create governed reports, dashboards, and operational alerts that drive informed decision-making.
In this article, you'll learn about:
- Creating Power BI reports and translytical taskflows for interactive analysis
- Using Real-Time Intelligence to monitor and act on streaming data
- Applying Fabric IQ business semantics, ontologies, and graph models to unify enterprise data
Explore and share insights with Power BI
Power BI reports use semantic models as the analytical backbone. These models centralize business logic, calculations, and governance, ensuring consistency across reports and teams. Business analysts can build interactive dashboards, drill into metrics, and share insights securely across the organization. Use Power BI when you need structured, reusable, and governed analytics built on semantic models stored in OneLake.
You can distribute and embed Power BI reports across Microsoft 365 applications:
- Pin reports in Microsoft Teams channels or chats for collaborative analysis.
- Embed reports in SharePoint pages using the Power BI web part.
- Insert live reports into PowerPoint presentations.
- Connect to Power BI datasets from Excel to create PivotTables and charts on top of semantic models.
Take action from reports with translytical taskflows
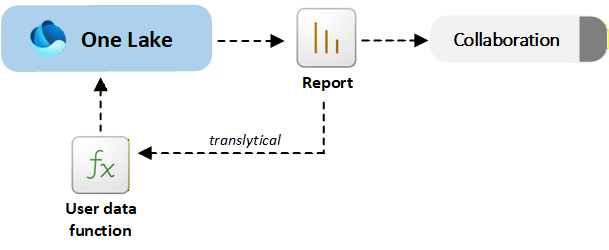
Translytical taskflows allow you to move from insight to action directly inside a Power BI report. You can invoke user data functions to update records, trigger workflows, or write back to OneLake without leaving the report interface. Use translytical taskflows when insights and operational updates must happen together, such as adjusting inventory, updating sales forecasts, or resolving support cases.
The following diagram shows how Power BI reports and translytical taskflows combine analytics and action in a single, governed experience:
Monitor and analyze real-time data
The Real-Time Intelligence workload in Microsoft Fabric enables you to ingest, process, analyze, and act on streaming data with minimal latency. It combines capabilities from the following services:
Ingest streaming data with Eventstream
Eventstream ingests streaming data from sources such as Azure Event Hubs, Kafka, IoT devices, or REST APIs. It applies real-time transformations and routes data into services like Eventhouse or Lakehouse.
Eventstream supports routing and schema alignment, timestamp normalization, partitioning, and integration with Activator. As Eventstreams feed high-velocity data into Fabric, Activator continuously monitors these streaming events against defined rules in near real time.
Analyze events with Eventhouse
Eventhouse is optimized for high-volume event and time-series analytics. It automatically indexes and partitions data and uses Kusto Query Language for fast filtering, aggregation, joins, and anomaly investigation. Use Eventhouse when you need scalable analysis of telemetry, operational metrics, or log data.
Integration with Activator happens through KQL querysets, which let you define reusable queries that continuously evaluate conditions on Eventhouse data. Activator can subscribe to these query outputs and apply rules based on the query results. When a KQL query detects a condition (for example, CPU usage exceeds 90% or a trend indicates failure risk), Activator triggers automated actions like sending alerts, launching Power Automate flows, or executing Fabric pipelines. This combination of KQL's analytical power with Activator's orchestration enables real-time, data-driven automation across business scenarios.
Visualize live metrics with real-time dashboards
Real-time dashboards provide live, interactive visualizations of streaming data, enabling you to monitor key metrics and operational signals as they happen. Built on top of Eventhouse (KQL databases), these dashboards let you query and display time-series data with minimal latency, offering insights into system performance, customer behavior, or sensor activity in real time. They support dynamic filtering, auto-refresh, and alerting capabilities, making them ideal for use cases like IT monitoring, manufacturing telemetry, financial transaction tracking, and customer support analytics. Real-time dashboards also integrate with Activator, so you can not only observe but also respond to critical events directly from the dashboard interface, turning insights into action without delay.
Real-time dashboards differ from regular Power BI reports primarily in their ability to visualize and respond to live streaming data with minimal latency. Power BI reports are typically built on imported datasets refreshed on a schedule and are best for historical analysis and interactive exploration. Real-time dashboards, on the other hand, are designed for operational monitoring and immediate insight.
Anomaly detection
The anomaly detector automatically identifies unusual patterns or outliers in streaming or time-series data. It works by analyzing data ingested into Eventhouse (KQL databases) and applying statistical models or machine learning techniques to detect deviations from expected behavior. These anomalies could represent system failures, fraud, performance degradation, or other critical events that require attention. Unlike static threshold-based alerts, the anomaly detector adapts to the data's historical trends and seasonality, making it more effective at identifying subtle or context-sensitive issues.
When an anomaly is detected, it can trigger downstream actions through Activator, such as sending alerts, updating dashboards, or launching automated workflows. This capability supports operational scenarios where early detection of anomalies can prevent downtime, financial loss, or customer dissatisfaction. It enables you to move from reactive monitoring to proactive intervention across business processes.
Use anomaly detection when static thresholds are not sufficient and patterns must be evaluated dynamically.
Automate responses with Activator
Activator continuously monitors streaming or event data and evaluates rules you define. It supports simple threshold rules and stateful pattern detection. For example, when a metric becomes critical or decreases over time. This capability enables you to automate decisions and operational tasks in near real time, bridging live data insights to instant actions. Use Activator to bridge real-time insights to automated operational responses.
When conditions are met, Activator can:
- Send alerts to Microsoft Teams or email
- Trigger Power Automate flows
- Launch Fabric pipelines or other Fabric items
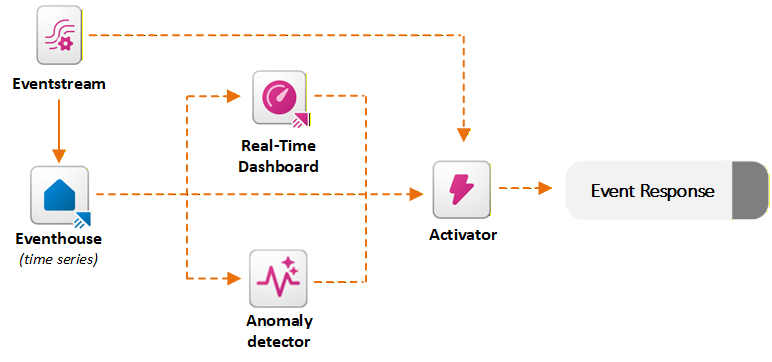
The following diagram shows how Real-Time Intelligence in Fabric ingests streaming data, analyzes events, and triggers actions with low latency:
Apply business semantics with Fabric IQ
Fabric IQ provides a shared business context layer across your data estate. It maps data in Lakehouses, Warehouses, Eventhouses, and semantic models to a unified ontology.
Fabric Ontology is a shared, machine-understandable vocabulary of your business that defines the key entities (for example, Customer, Product, or Plane), their relationships, properties, business rules, and possible actions while maintaining all terms in the language of the business. It brings together a live, connected representation of how your business operates, mapped directly to the underlying data in OneLake. This model lets users and agents see not just tables, but also relationships like "Customers place Orders for Products," "Flights have Segments and Crews," and "Delayed shipments impact Revenue." This data-centric context is critical for any AI that's expected to make decisions or analyses about the business.
When you define an ontology element (such as an entity "Flight" with properties like Status or Delay), you map it to the table and fields in an Eventhouse, Lakehouse, or Warehouse that contain that information, without copying or moving the data. After the data lands in OneLake, it becomes part of the live ontology.
Beyond business entities and relationships, ontologies can also define actionable rules, such as "If inventory < threshold, trigger replenishment." Operations Agents use these rules to trigger workflows in Activator. When an Operations Agent invokes Activator to run a Power Automate flow, it passes parameters derived from ontology properties, such as CustomerID and OrderStatus. This approach ensures that automation flows operate with full business context, not just raw IDs.
This semantic layer enables consistent analytics, AI reasoning, and automation.
Explore connected data with graph models
Graph models provide a connected network of ontology-defined entities and relationships. They enable multi-hop reasoning, impact analysis, and advanced algorithms such as shortest path and community detection. This integration lets AI agents and analytics tools query complex relationships efficiently. It offers real-time insights into dependencies and cascading effects that traditional relational models struggle to handle. You can interrogate graph models by using GraphQL queries through Fabric APIs.