Note
Access to this page requires authorization. You can try signing in or changing directories.
Access to this page requires authorization. You can try changing directories.
These are the latest features in the Stable release of Microsoft Edge DevTools.
Tip
The Microsoft Build 2021 conference was on May 25-27. Here's a video from Build about the updates to DevTools: Microsoft Edge | State of the Platform - Microsoft Edge brings a compelling and consistent platform with tools for developers. As our legacy browsers phase out of support, Edge will soon be the only supported browser from Microsoft on Windows 10 or later. Join us to learn about the latest across the Edge platform, tools, and web apps.
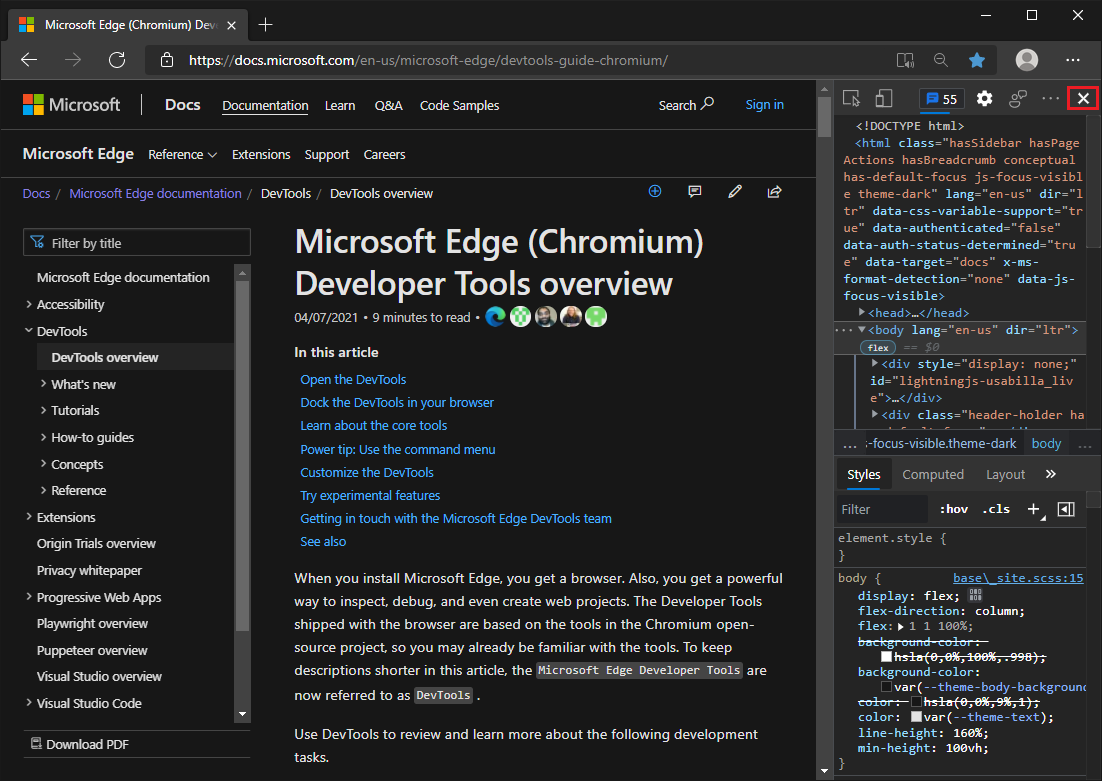
The Close button is no longer hidden when DevTools is narrow
In Microsoft Edge version 91 or earlier, the Close button to close DevTools isn't displayed when the DevTools viewport is narrow. In Microsoft Edge version 92, the Close button in the DevTools is always present, regardless of the DevTools viewport width.
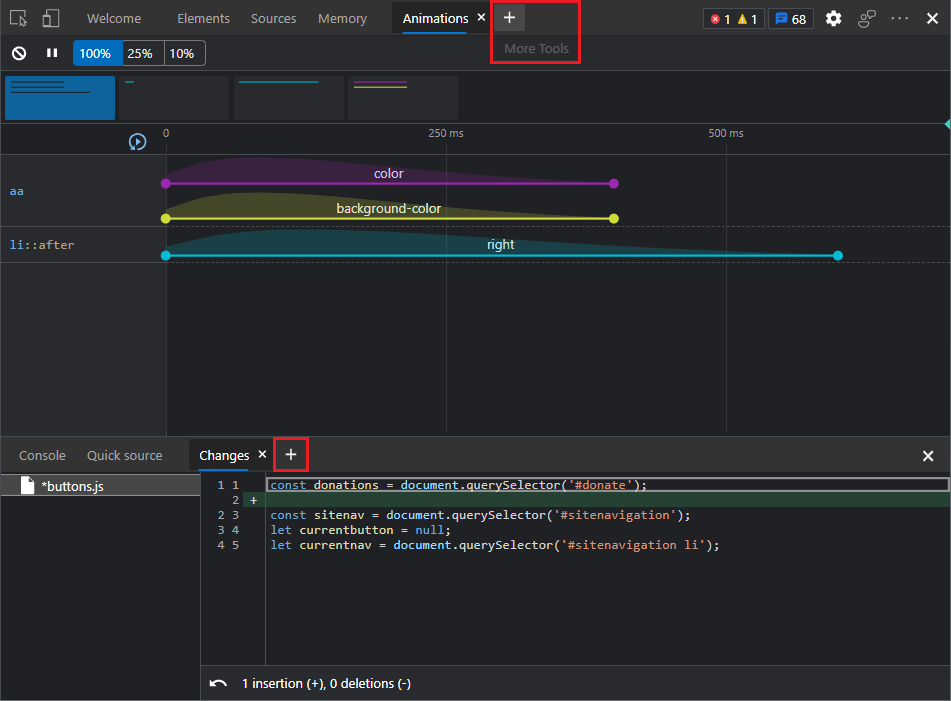
Add tools quickly with the new More Tools button
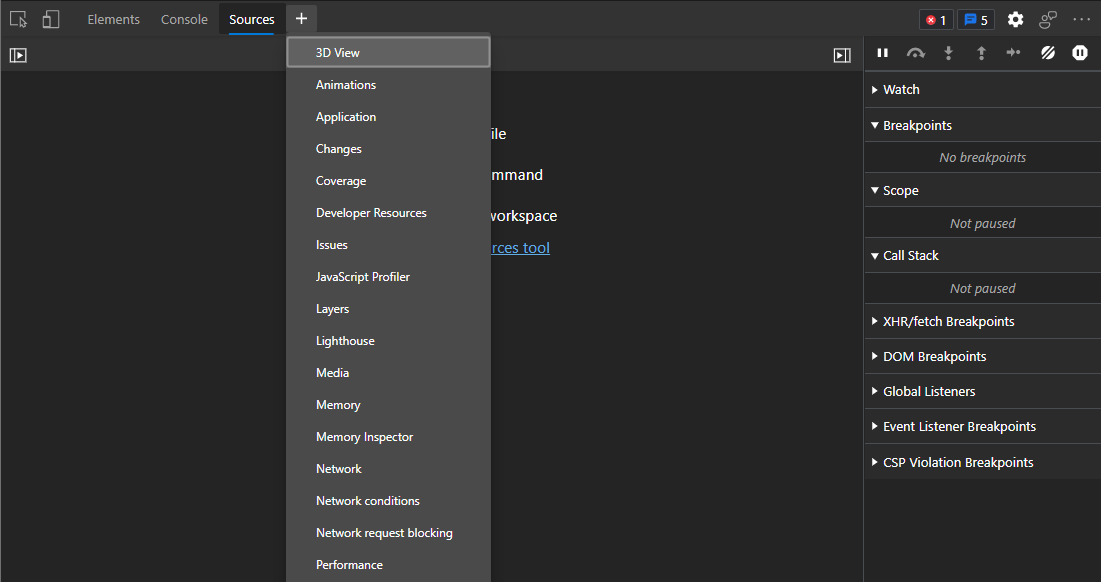
There's a new way to open more tools in Microsoft Edge DevTools: the More Tools (+) menu. The More Tools menu appears on the toolbar in the main panel and on the toolbar of the Drawer (now Quick View panel). Selecting a tool from the More Tools menu adds the tool to the toolbar.
To reorder the tabs on either toolbar, select and drag the tabs.
The More Tools menu was available as an experiment in Microsoft Edge version 89, and is now always present.
See also:
- More tools in About the list of tools
Improvements for hovering, selecting, and closing tools
Tabs for each tool have been reformatted to reduce the chance of accidentally closing a tool. On each tab in the main toolbar and in the toolbar of the Drawer (now Quick View panel), the following have been added:
- Spacing around the tab.
- Spacing around the close (
x) button in the tab. - A background color when hovering over the tab.
- A tooltip for the close (
x) button of the tab. - Higher contrast for the close (
x) button of the tab.
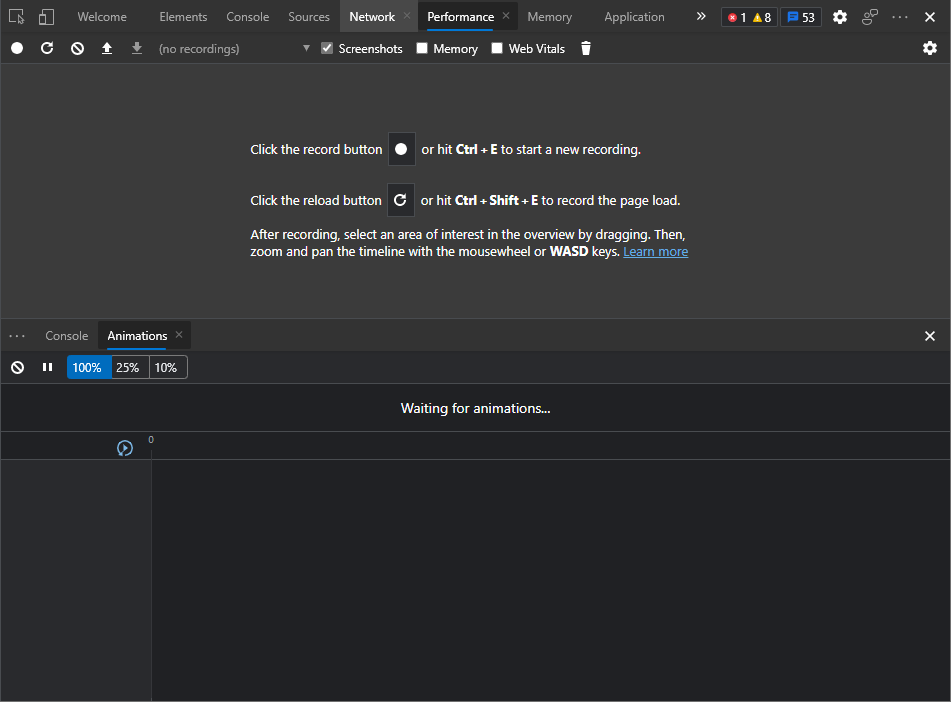
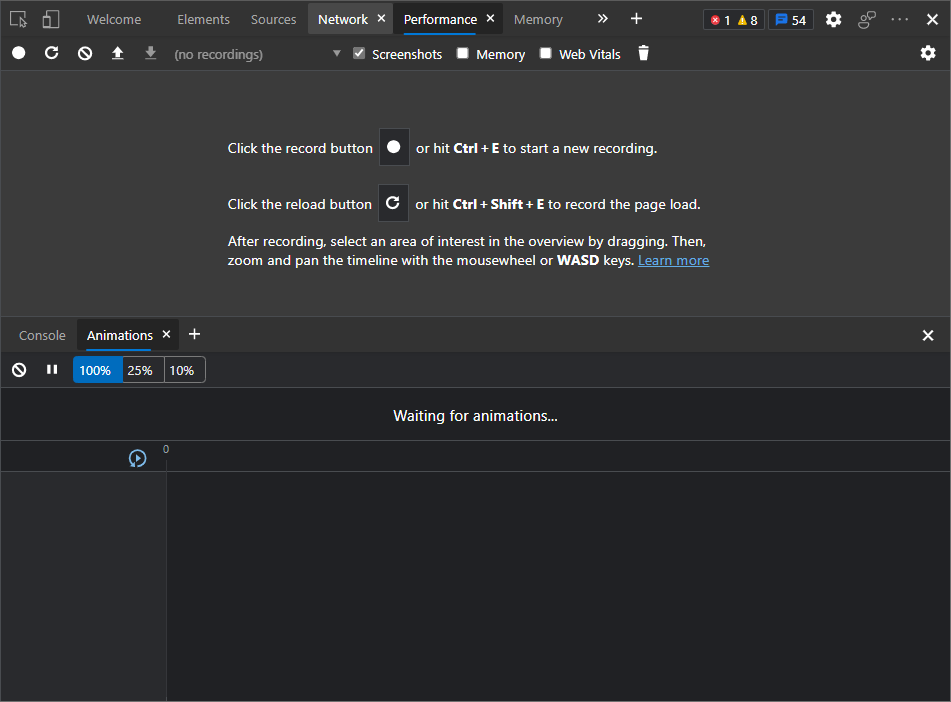
For example, when you are in the Performance tool and you hover over the Network tool's tab, these improvements help prevent accidentally closing the Network tool.
Tabs before reformatting:
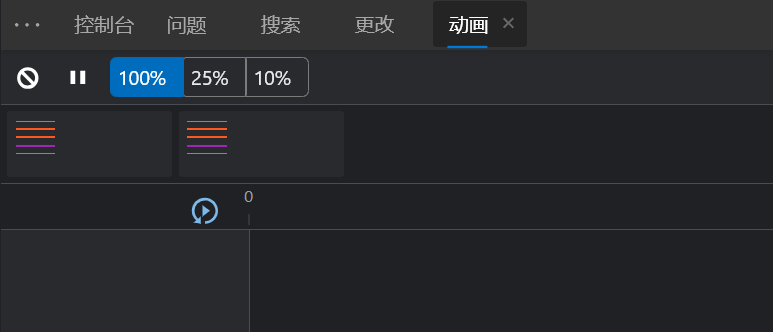
Tabs after reformatting:
These improvements are especially relevant for users of localized DevTools, in which the tabs may be narrower and easier to accidentally close:
It's now easier to re-add a tool that you closed: a More Tools menu has been added to the main toolbar and the Drawer (now Quick View) toolbar.
See also:
Better support for screen readers in the Console
Prior to Microsoft Edge version 92, in the Console, assistive technologies such as screen readers didn't announce autocomplete suggestions or the results of evaluated expressions. This has been fixed now.
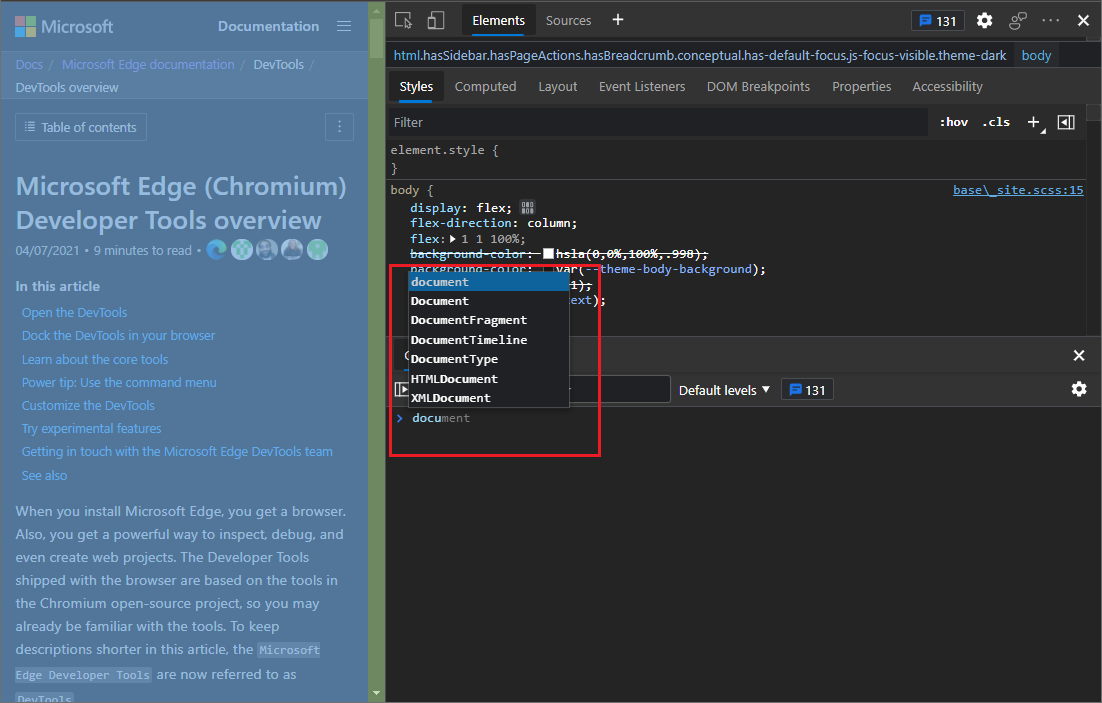
In the Console, screen readers now announce the currently selected autocomplete suggestion:
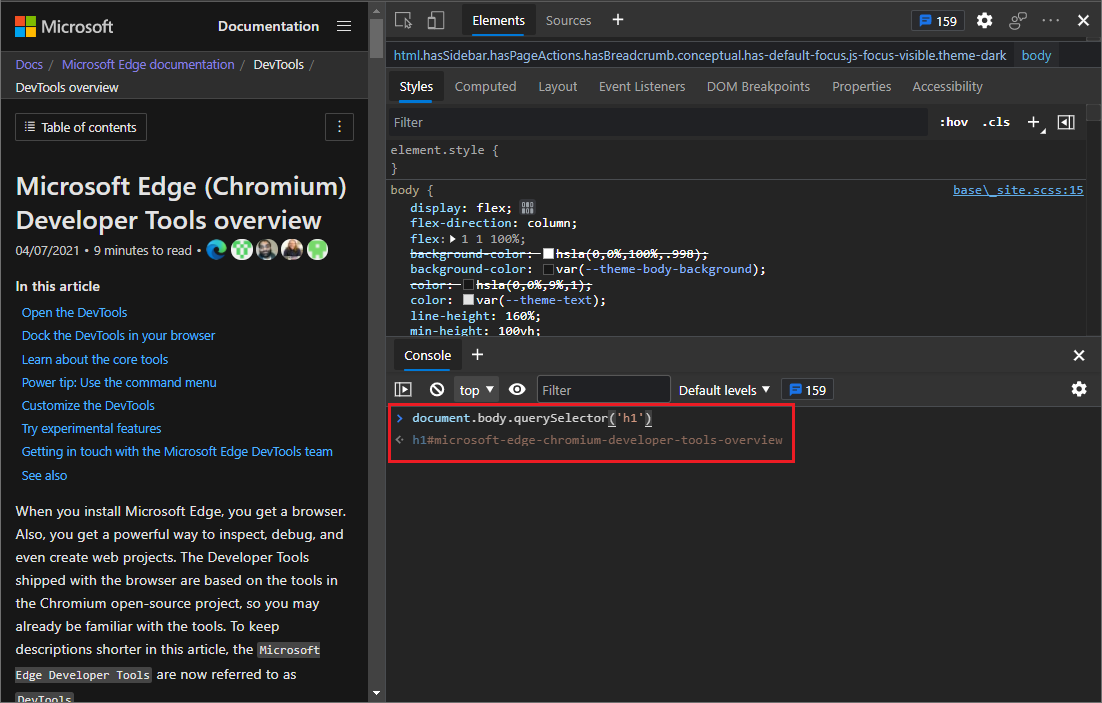
In the Console, screen readers now announce the result of an evaluated expression:
See also:
Source Order Viewer
You can now view the order of source elements overlaid on the rendered webpage, for better accessibility inspection.
The order of content in an HTML document is important for search engine optimization and accessibility. CSS allows developers to create content that looks different in its on-screen order than the order in the HTML source document. This is an accessibility problem, because screen-reader users could get a confusing experience.
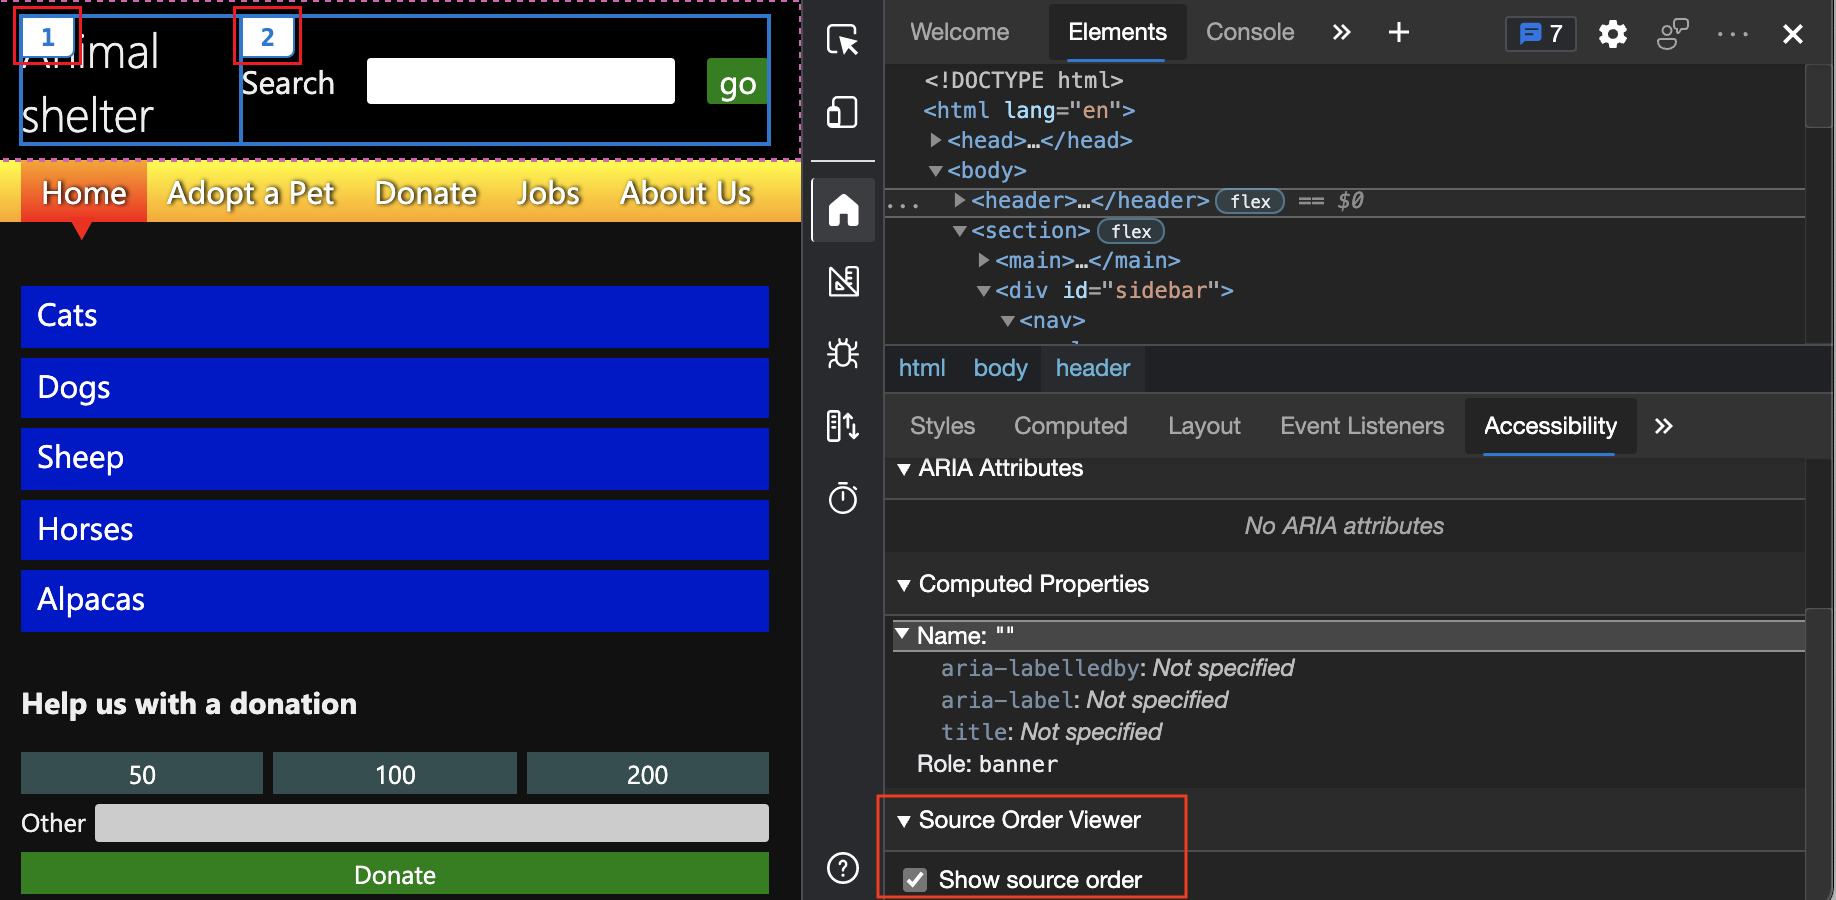
See Test keyboard support using the Source Order Viewer.
For the history of this feature in the Chromium open-source project, see Issue 1094406.
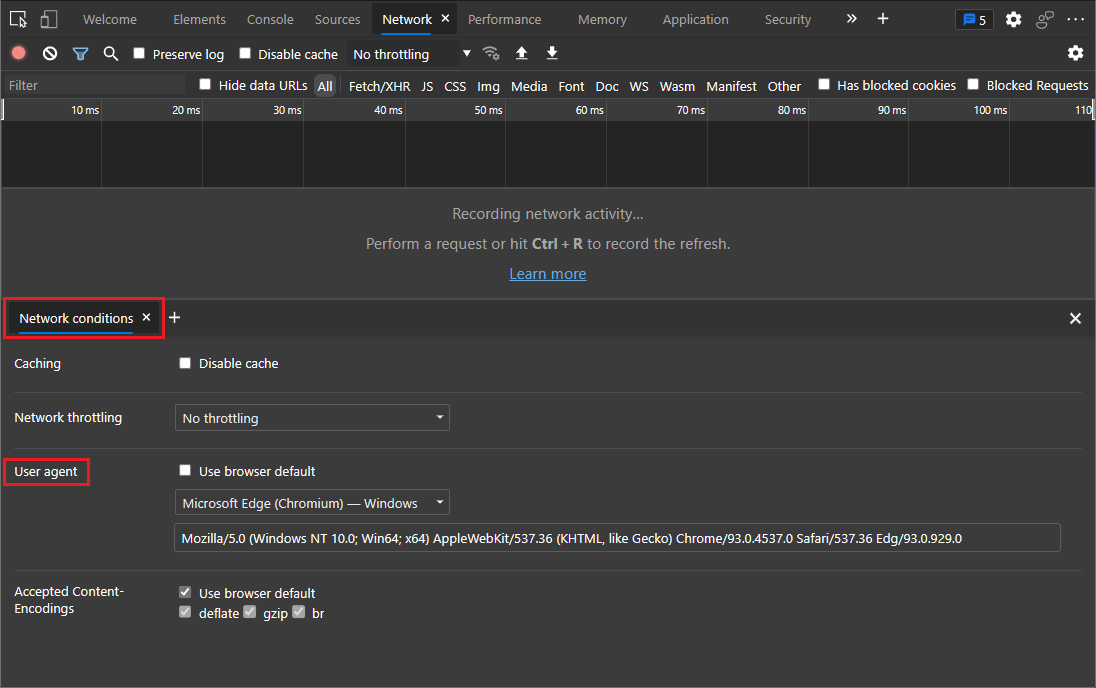
User-Agent Client Hints for devices in the Network conditions tab
User-Agent Client Hints are now applied for devices in the User agent field in the Network conditions tool. User-Agent Client Hints are a new expansion to the Client Hints API that enables you to access information about a user's browser in an ergonomic way that preserves privacy.
For the history of this feature in the Chromium open-source project, see Issue 1174299.
Microsoft Edge Developer Tools for Visual Studio Code version 1.1.8
The Microsoft Edge Developer Tools for Visual Studio Code extension version 1.1.8 for Microsoft Visual Studio Code has the following changes since the previous release. Microsoft Visual Studio Code updates extensions automatically. To manually update to version 1.1.8, see Update an extension manually.
You can file issues and contribute to the extension on the vscode-edge-devtools GitHub repo.
In-context documentation and UI to make it easier to use the DevTools extension
Version 1.1.8 of the Microsoft Edge Developer Tools for Visual Studio Code extension now features a simpler way to start a new instance of Microsoft Edge, by presenting instructions, buttons, links, and a documentation page to guide you.
When you select the Microsoft Edge Tools button in the Activity Bar of Visual Studio Code, the Microsoft Edge Tools: Targets panel now presents explanatory text, buttons, and links to guide you, instead of a blank panel.
When you open a new instance of Microsoft Edge from within Visual Studio Code, Microsoft Edge now shows a start page that explains how to use the Developer Tools extension, instead of a blank page.
The Microsoft Edge Tools: Targets panel now has a Generate launch.json button and instructions, to help launch your project for debugging in Microsoft Edge.
See also:
Announcements from the Chromium project
The following sections announce additional features available in Microsoft Edge that were contributed to the open-source Chromium project.
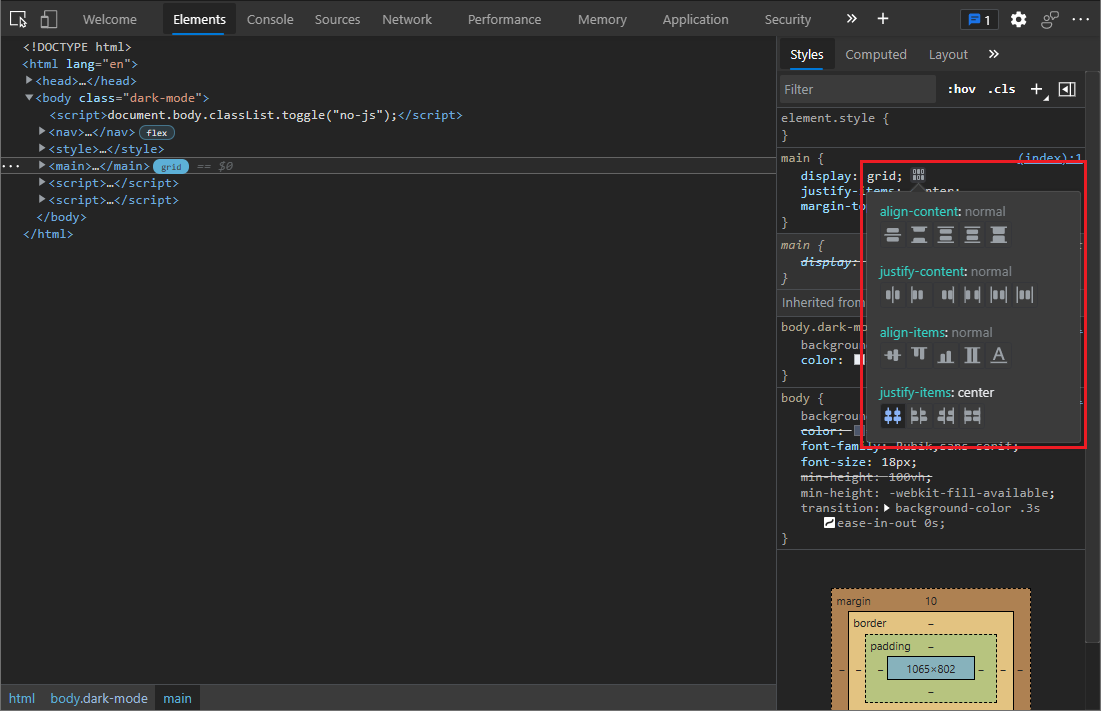
CSS Grid editor
You can now preview and author CSS Grid layouts, using the new CSS Grid editor.
When an HTML element on your page has display: grid or display: inline-grid applied to it, a grid icon is displayed next to it in the Styles tab. Click the grid icon to display or hide the CSS grid editor. In the CSS grid editor, select any of the icons (such as justify-content: space-around) to preview the layout in the rendered page. Flex layout works similarly.
For the history of this feature in the Chromium open-source project, see Issue 1203241.
See also:
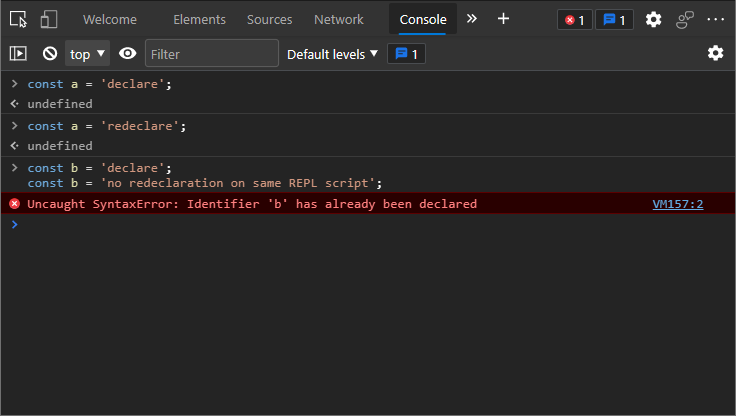
Support for const redeclarations in the Console
The Console now supports redeclaration of const variables across separate REPL scripts (such as when you run a statement in the Console), in addition to the existing let and class redeclarations. This support allows you to experiment with different declarations for const variables without refreshing the page. Previously, DevTools threw a syntax error if you redeclared a const binding.
Refer to the example below. const redeclaration is supported across separate REPL scripts (refer to variable a). Note that the following scenarios aren't supported, by design:
constredeclaration of page scripts isn't allowed in REPL scripts.constredeclaration within the same REPL script isn't allowed (refer to variableb).
To learn how to run a single REPL script or a multi-line REPL script, see Run JavaScript in the Console.
For the history of this feature in the Chromium open-source project, see Issue 1076427.
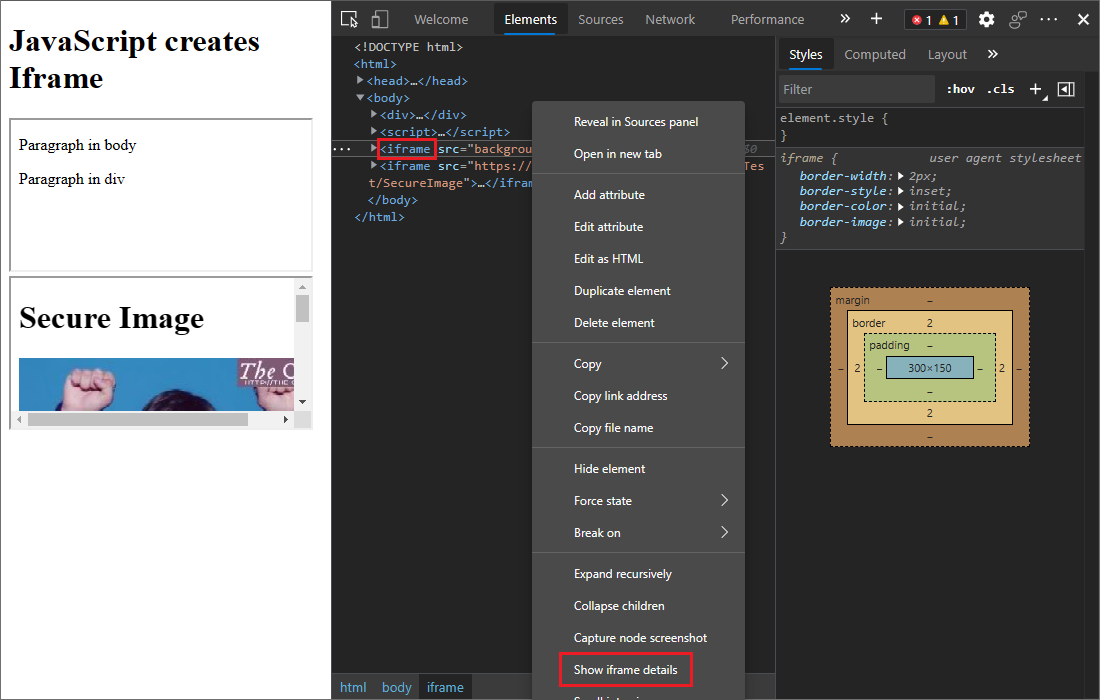
New shortcut to view iframe details
To quickly view iframe details, you can now right-click an iframe element in the Elements tool, and then select Show iframe details.
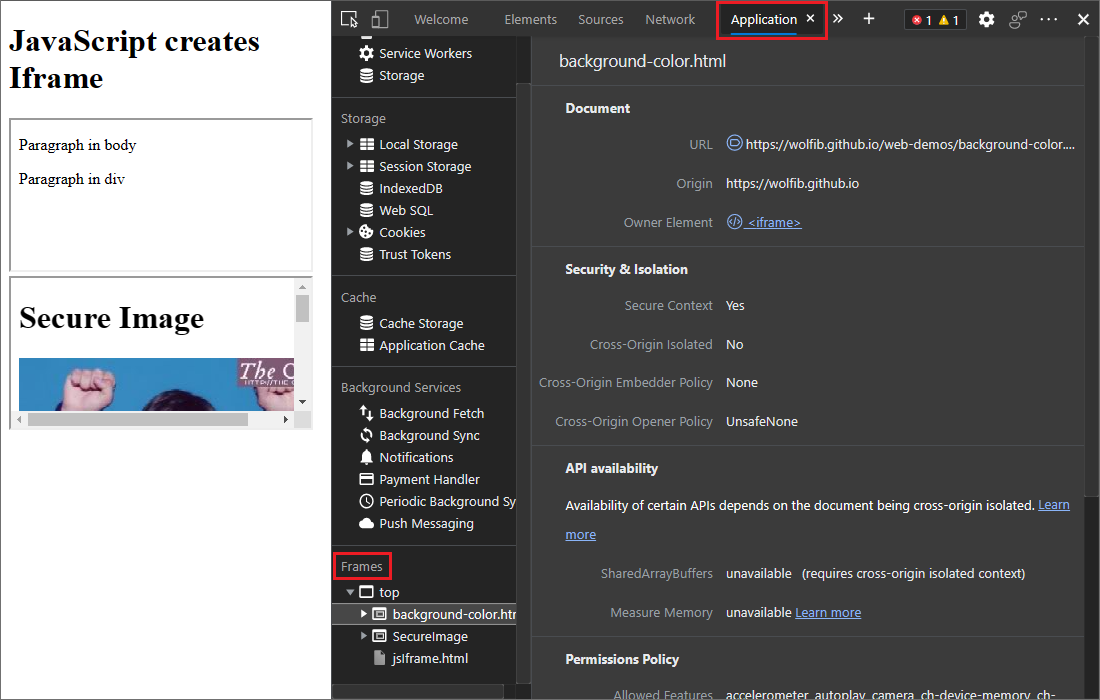
This displays the details about the iframe in the Application tool. In the Application tool, you can examine document details, security and isolation status, permissions policy, and more, to debug potential issues.
See also:
For the history of this feature in the Chromium open-source project, see Issue 1192084.
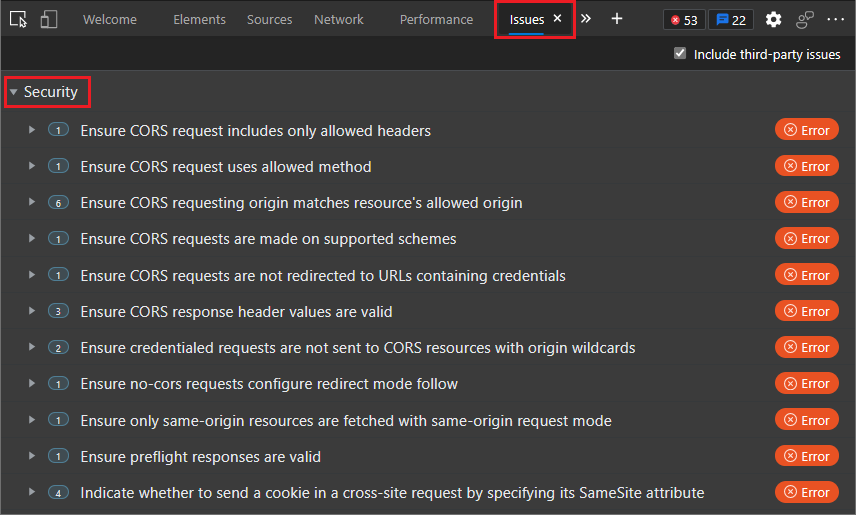
Enhanced CORS debugging support
Cross-origin resource sharing (CORS) errors are now surfaced in the Issues tool. There are various potential causes of CORS errors. Click each issue to expand it and see potential causes and solutions.
See also:
- Report CORS errors in the Network tool in What's new in DevTools (Microsoft Edge 88)
- Find and fix problems using the Issues tool
For the history of this feature in the Chromium open-source project, see Issue 1141824.
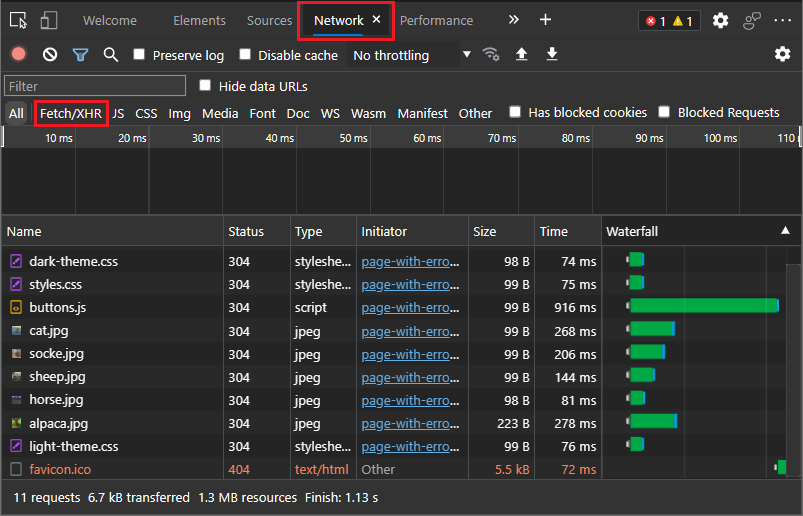
Renamed XHR filter to Fetch/XHR
In the Network tool, the XHR filter is now renamed to Fetch/XHR. This change makes it clearer that this filter includes both XMLHttpRequest and Fetch API network requests.
See also:
For the history of this feature in the Chromium open-source project, see Issue 1201398.
Filter Wasm resource type in the Network tool
In the Network tool, you can now select the new Wasm filter to filter the WebAssembly network requests.
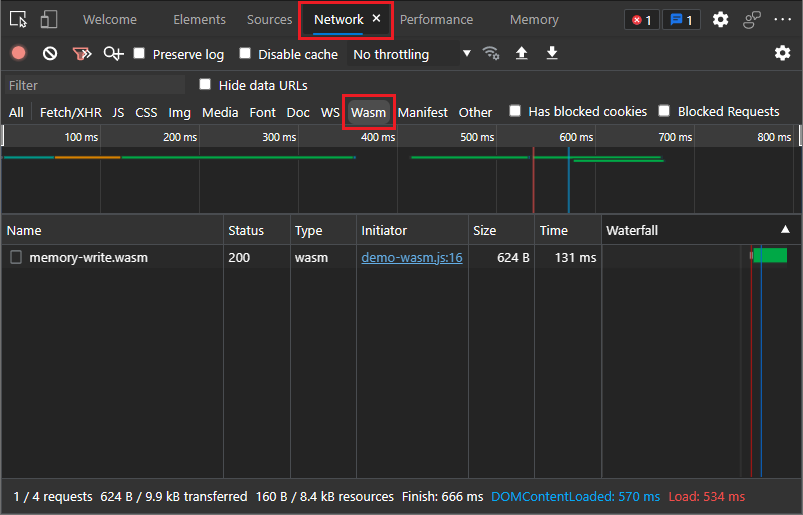
See also:
- Filter resources in Inspect network activity
For the history of this feature in the Chromium open-source project, see Issue 1103638.
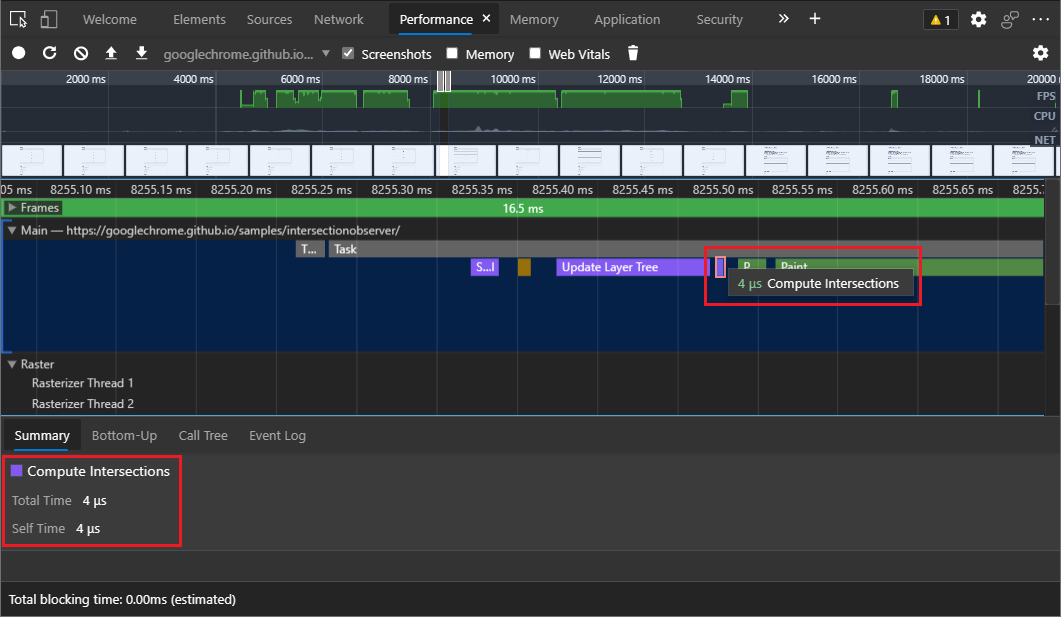
Compute Intersections are now included in the Performance tool
In the Performance tool, DevTools now displays Compute Intersections in the flame chart. These changes help you identify intersection observers events and debug the potential performance overhead of intersection observers.
See also:
For the history of this feature in the Chromium open-source project, see Issue 1199137.
Note
Portions of this page are modifications based on work created and shared by Google and used according to terms described in the Creative Commons Attribution 4.0 International License. The original page is found here and is authored by Jecelyn Yeen.
![]() This work is licensed under a Creative Commons Attribution 4.0 International License.
This work is licensed under a Creative Commons Attribution 4.0 International License.