Note
Access to this page requires authorization. You can try signing in or changing directories.
Access to this page requires authorization. You can try changing directories.
These are the latest features in the Stable release of Microsoft Edge DevTools.
Video: Microsoft Edge | What's New in DevTools 93

Apply themes from Visual Studio Code to DevTools
Update: Starting with Microsoft Edge 131, the Visual Studio Code themes feature is removed, and such themes revert to the default themes:
- Light+
- Dark+
In addition to the existing light and dark themes, Microsoft Edge DevTools now supports some of the most popular color themes from Visual Studio Code. To select a color theme, click the DevTools Settings (![]() ) button, and then select a theme from the Theme dropdown list.
) button, and then select a theme from the Theme dropdown list.
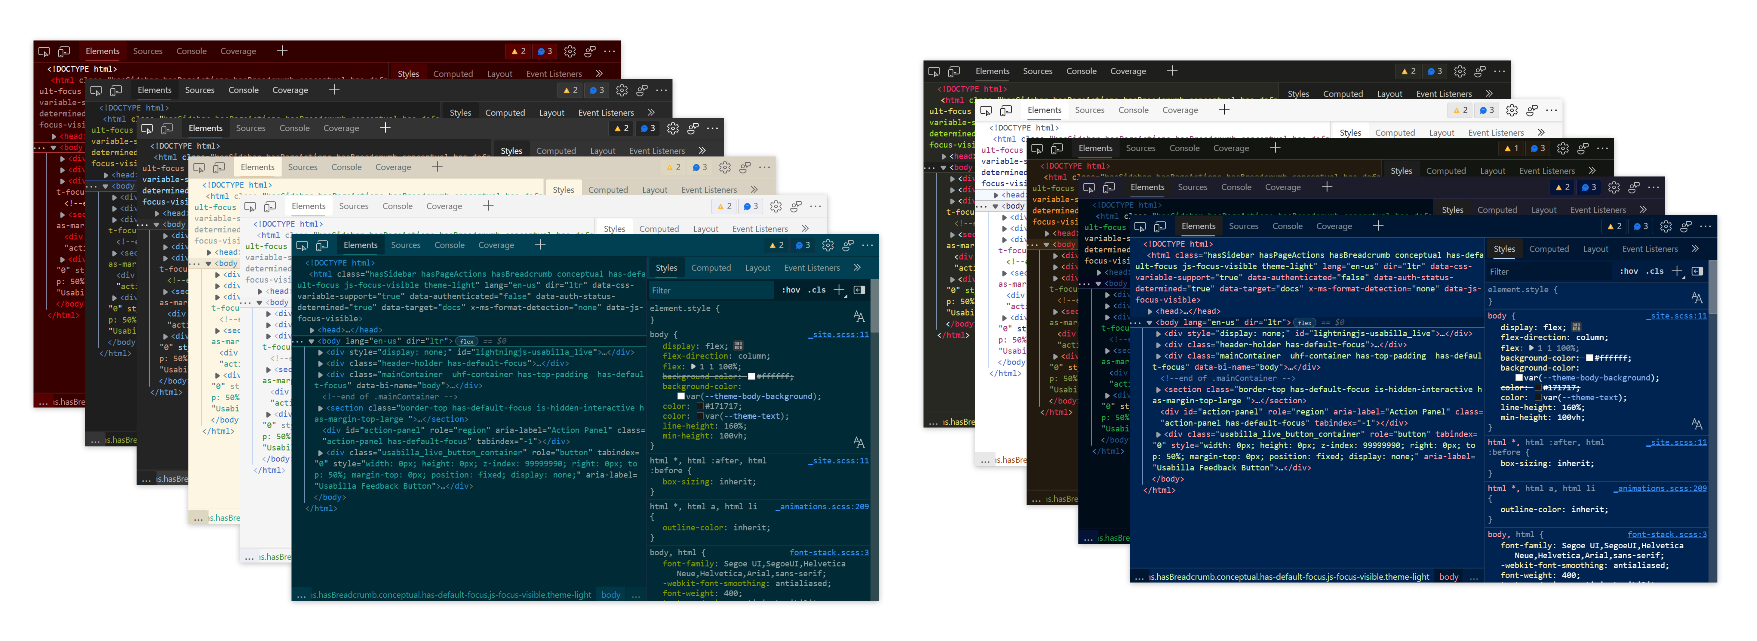
The supported Visual Studio Code themes are:
Light themes:
- Solarized Light
- Quiet Light
Dark themes:
- Abyss
- Kimbie Dark
- Monokai
- Monokai Dimmed
- Solarized Dark
- Red
- Tomorrow Night Blue
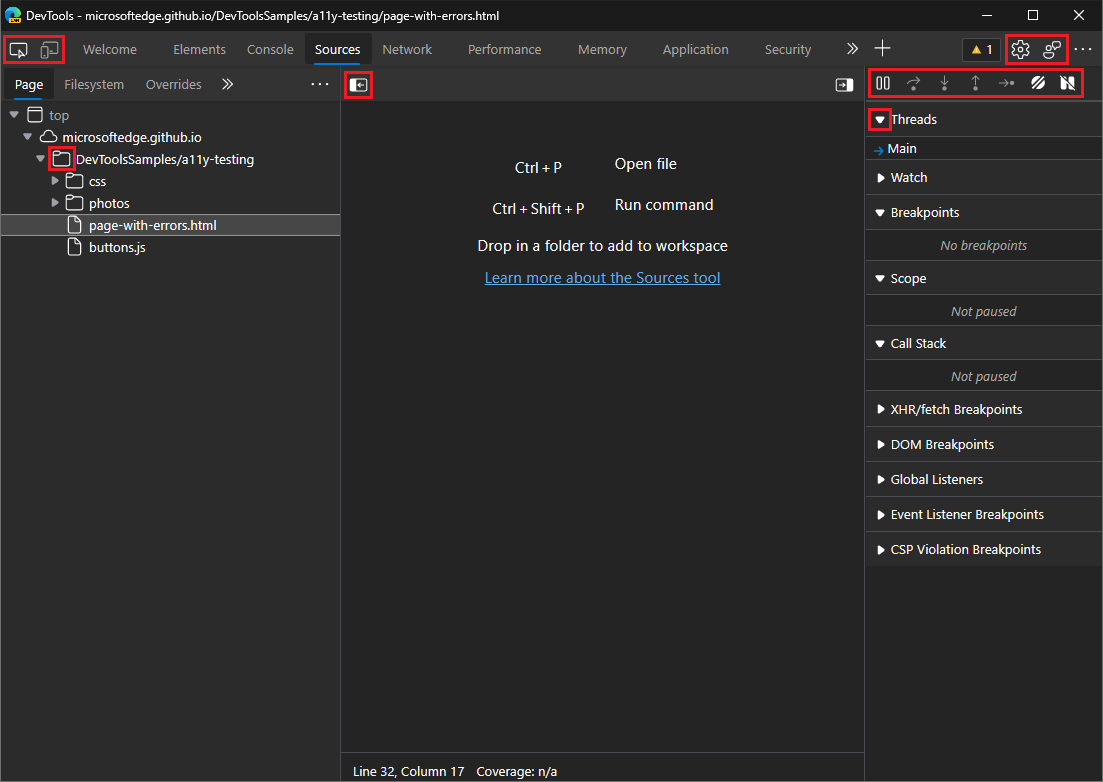
Debug DOM node memory leaks with the new Detached Elements tool
March 2025 update: The Detached Elements tool has been removed. To debug DOM memory leaks, use the Detached elements profiling type in the Memory tool.
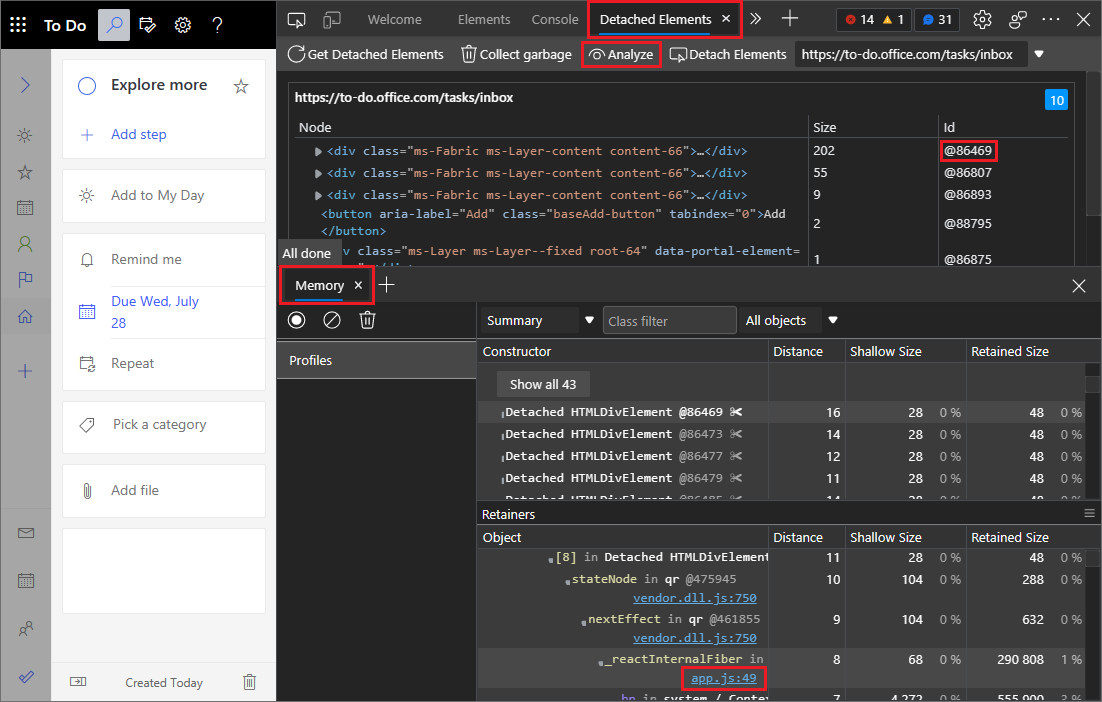
A DOM node is considered "detached" when it is no longer attached to any element of the DOM but is still being retained in memory by Microsoft Edge. The browser cannot garbage-collect the element, because some JavaScript is still referencing the element even though it's no longer on the page or a part of the DOM.
The Detached Elements profiling type in the Memory tool finds all of the detached elements on your page and displays them. You can expand and collapse a detached element to see the parent and child nodes that are also being retained. You can trigger the browser's garbage collection by selecting Collect garbage and validate that you have a memory leak when a detached element cannot be garbage-collected. Finally, you can jump into JavaScript that's referencing the detached element by taking a heap snapshot with the Analyze button.
Update: This feature has been released and is no longer experimental.
See also:
The Visual Studio Code debugger now integrates with the DevTools extension
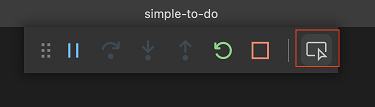
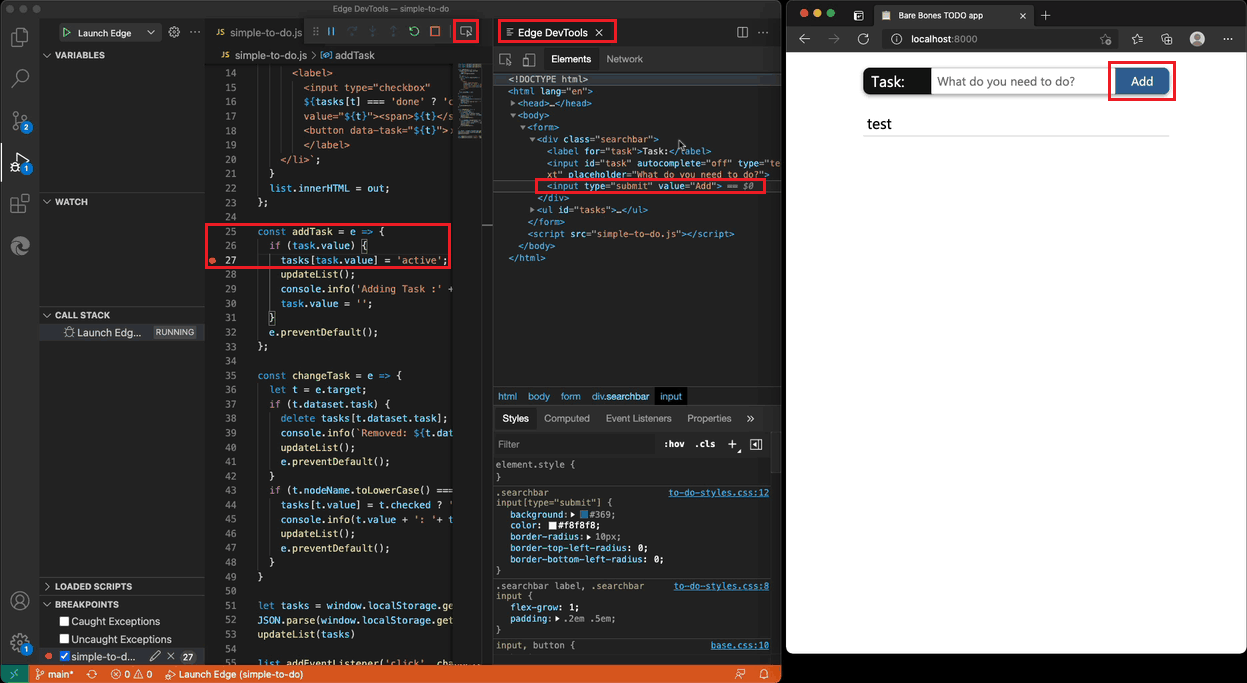
If you use JavaScript debugging in Visual Studio Code, you can now launch the Microsoft Edge Developer Tools for Visual Studio Code extension by selecting the Inspect button.
This feature integrates DOM and CSS debugging with JavaScript debugging in Visual Studio Code. If you don't have the DevTools extension installed, when you select the Inspect button, Visual Studio Code prompts you to install the extension.
Other new features are:
- The tools refresh automatically when you switch between different debugging targets.
- Several bug fixes.
- More detailed documentation of the extension.
For more details about improvements and fixes, check the changelog file in the vscode-edge-devtools repo.
See also:
Get the Microsoft Edge Developer Tools for Visual Studio Code extension. Microsoft Visual Studio Code updates extensions automatically; to update this extension manually instead, see Update an extension manually.
You can file issues and contribute to the extension on the vscode-edge-devtools GitHub repo.
New Fluent UI icons for DevTools
Microsoft Edge DevTools has adopted Fluent UI, giving buttons and menus a more modern look that better aligns with the rest of the Microsoft Edge browser.
Change the DevTools display language directly from Settings
Previously, to change the display language in DevTools, you had to change the browser language. Now you can easily switch the display language in DevTools Settings, without having to change your browser settings. To do this, open Settings, and then in Preferences, select a language from the Language dropdown list.
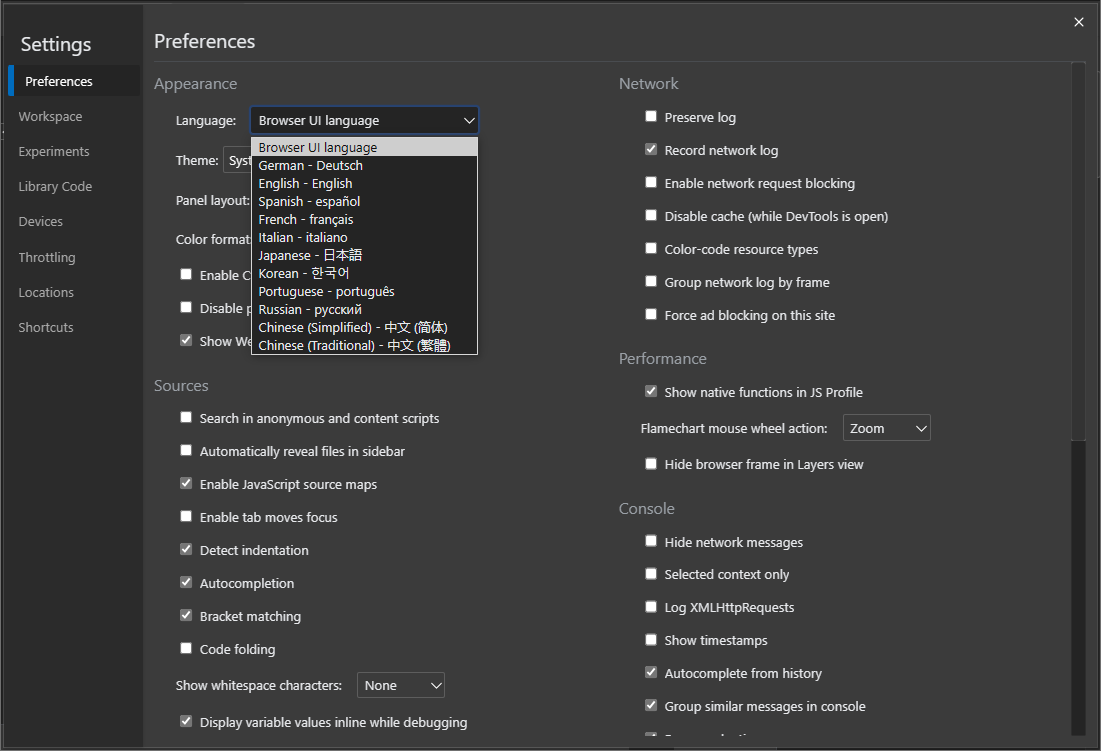
By default, DevTools matches your browser's display language. See Change DevTools language settings.
For the history of this feature in the Chromium open-source project, see Issue 2882756.
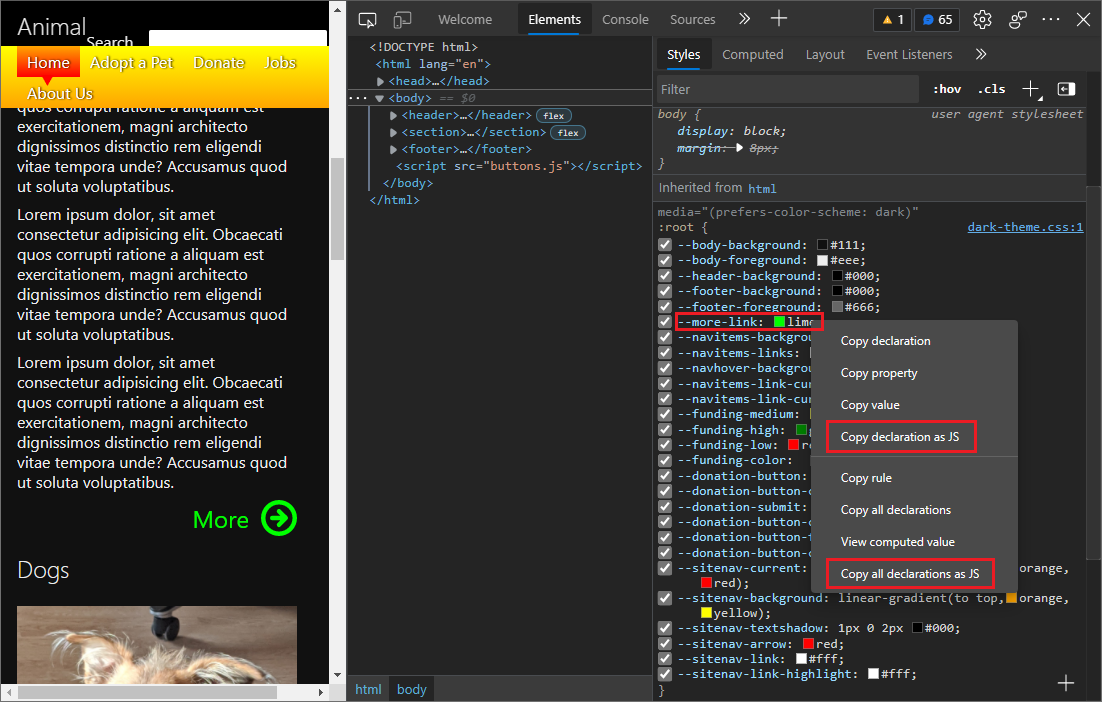
Copy a declaration in the Styles pane for CSS-in-JS libraries
Previously, when using CSS-in-JS libraries, you were not able to copy CSS declarations (a CSS property and value) formatted for JavaScript. You would have to edit the copied CSS to match JavaScript's syntax.
Now in Microsoft Edge version 93, you can copy a single CSS declaration or all the declarations in a style rule and paste them directly into a JavaScript file without having syntax issues. To try this feature:
In the Styles pane of the Elements tool, right-click a declaration in a style rule.
Select Copy declaration as JS or Copy all declarations as JS.
Paste the copied CSS into a JavaScript file in your text editor, such as Visual Studio Code. For example:
'--more-link': 'lime'.
To learn more about viewing and changing CSS, see CSS features reference.
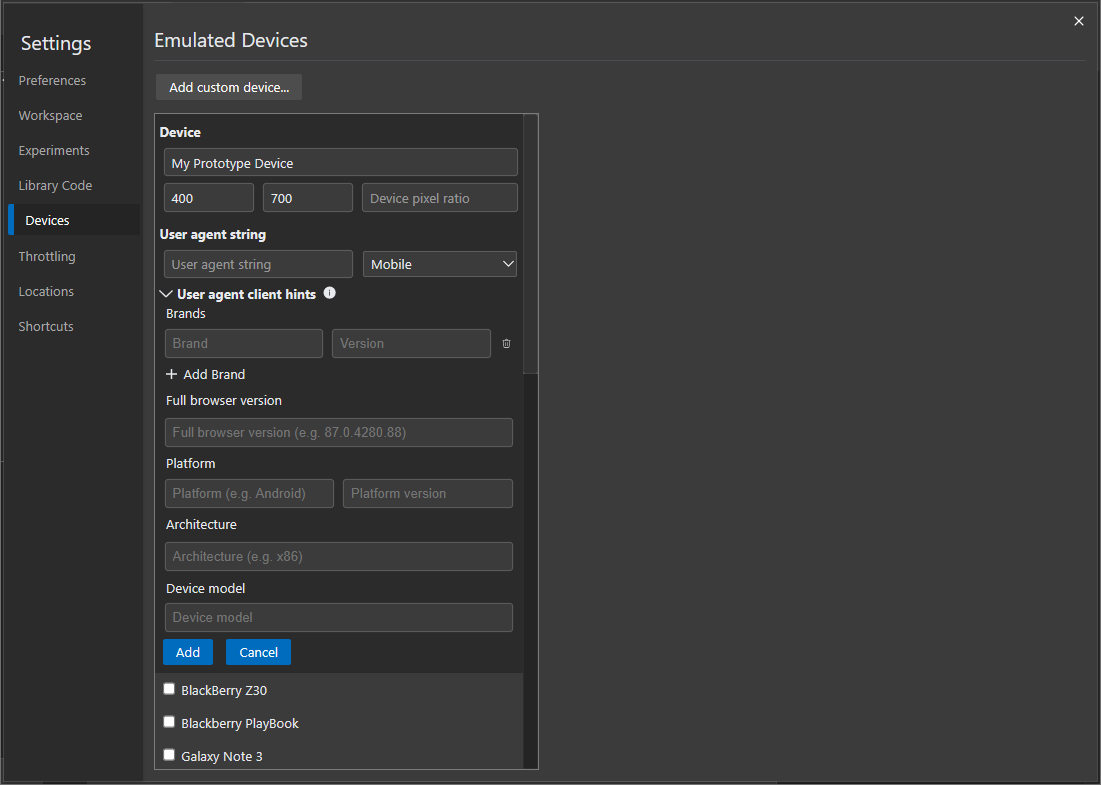
Easier customization of User-Agent Client Hints
User-Agent Client Hints makes browser information more accessible than a semicolon-delimited User-Agent string, and improves site compatibility. Initially, User-Agent Client Hints were time-consuming to test and debug. There was less control over the client hints, and client hints had to be filled in properly for the form to work.
In this release, we redesigned the debugging experience so you can easily modify User-Agent Client Hints through a UI with multiple separate fields and controls. Also, you can now test your custom User-Agent Client Hints and a User-Agent string simultaneously. You can now define User-Agent Client Hints for a custom device in Settings or in the Network conditions tool.
For more information about defining hints in Settings, see Set user agent client hints.
You can also override User-Agent Client Hints for the current page by using the Network conditions tool.
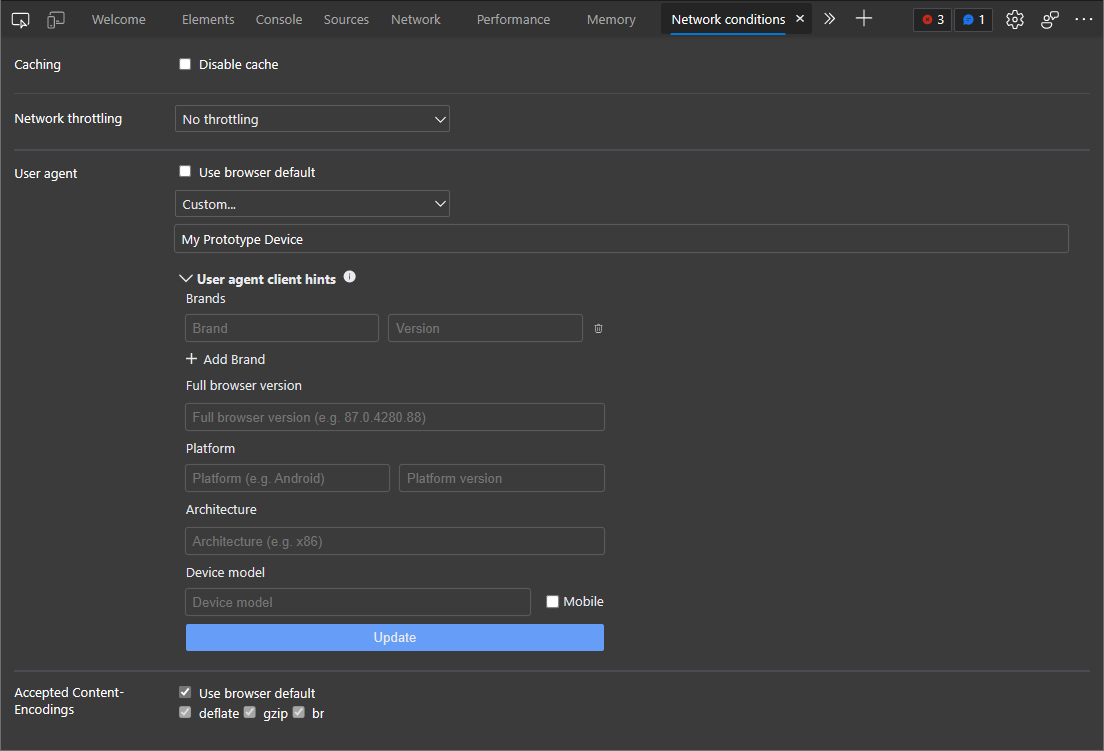
For more information about defining hints in the Network conditions tool, see Set user agent client hints.
For the history of this feature in the Chromium open-source project, see Issue 1174299.
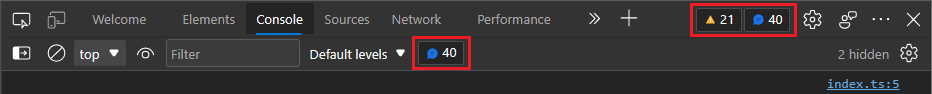
Screen readers now announce errors, warnings, and issues in toolbar and Console
Previously, users of screen readers would only hear the number of errors, warnings, or issues announced in the DevTools toolbar. The additional information of what type of notification was being announced wasn't included, such as "Error", "Warning", or "Issue". For example, if the DevTools reported 3 errors, screen readers would just announce "3".
Now in Microsoft Edge version 93, screen readers correctly announce the type and number of notifications; errors, warnings, or issues. For example, if DevTools reports 3 errors and 5 warnings, screen readers now announce "3 errors, 5 warnings". This fix has been applied to both the notifications in the DevTools toolbar and in the Console.
For information about debugging Console errors, see Fixing JavaScript errors that are reported in the Console. For information about issues found by DevTools and improvements you can make to a webpage, see Find and fix problems using the Issues tool.
For the history of this feature in the Chromium open-source project, see Issue 1223208.
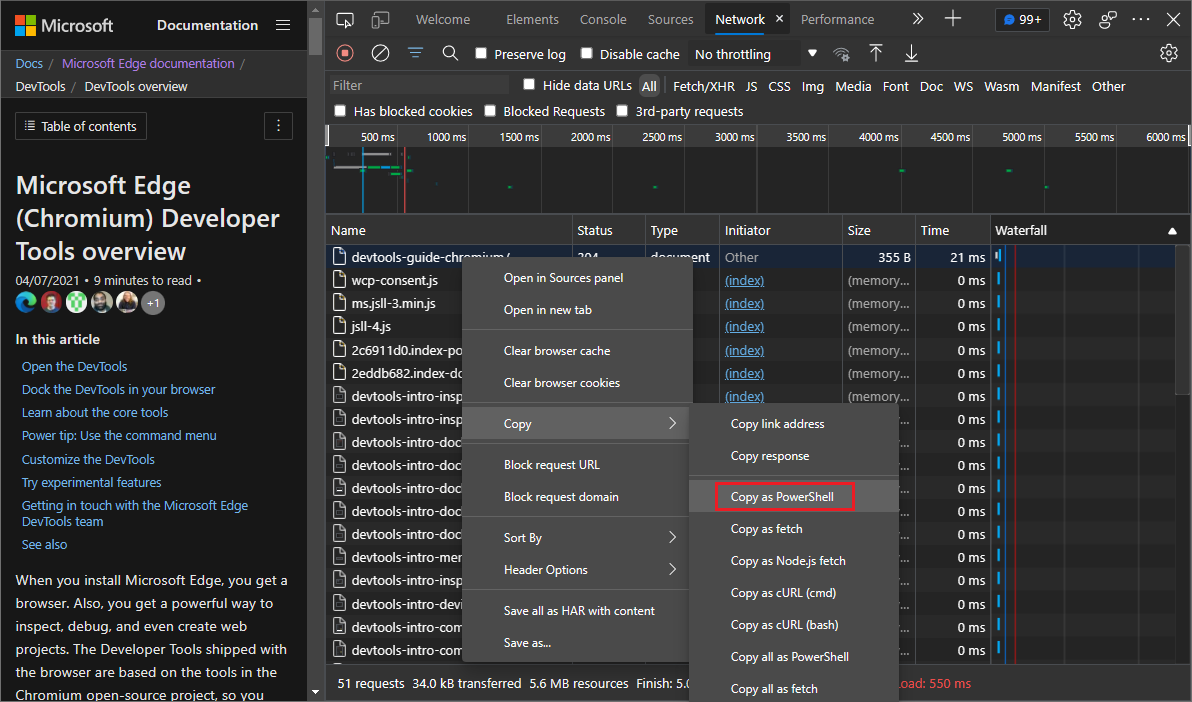
Copy as PowerShell in the Network tool now includes cookies
Previously, in the Network tool, the Copy > Copy as PowerShell context menu option didn't include cookies when generating a PowerShell command for a given network request in the Network Activity Log. This meant that the generated PowerShell command couldn't successfully make the same network request if cookies were required.
Now in Microsoft Edge version 93, the Copy as PowerShell context menu option correctly sets the User-Agent string and cookies that were observed by DevTools. The generated PowerShell command can now successfully make the same network request that was observed by DevTools, even to servers that depend on cookies.
For more information about the Network Activity Log, see Network features reference.
For the history of this feature, see Issue 932971.
Note
Portions of this page are modifications based on work created and shared by Google and used according to terms described in the Creative Commons Attribution 4.0 International License. The original page is found here and is authored by Jecelyn Yeen.
![]() This work is licensed under a Creative Commons Attribution 4.0 International License.
This work is licensed under a Creative Commons Attribution 4.0 International License.