Note
Access to this page requires authorization. You can try signing in or changing directories.
Access to this page requires authorization. You can try changing directories.
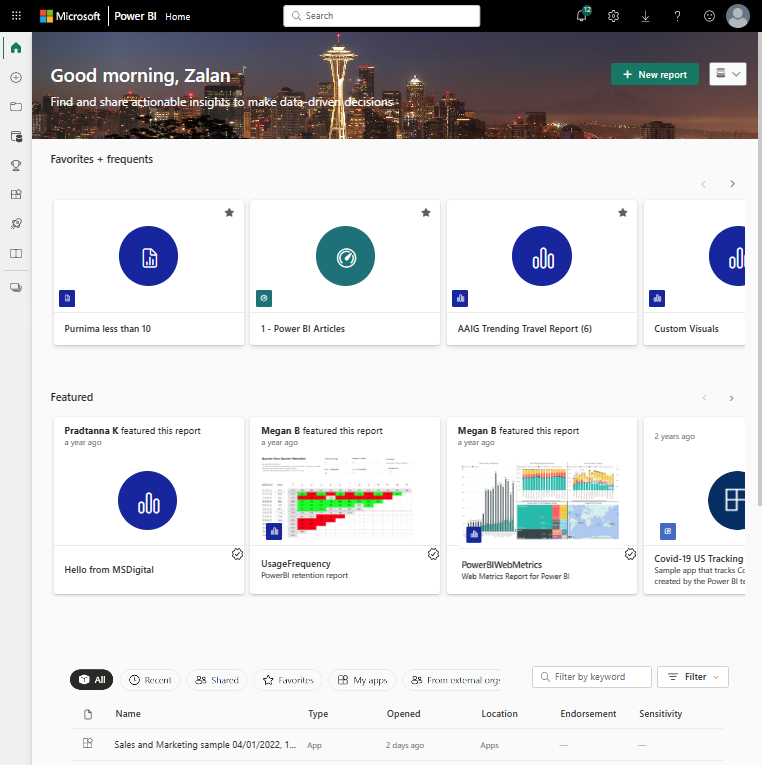
This article helps you find your way around the Power BI service as a business user - someone who views and interacts with reports, dashboards, and apps that others create.
Tip
For creation tasks, see Get started creating in the Power BI service. For interactions like filtering, exporting, and subscriptions, see Interact with reports and dashboards.
Prerequisites
- Sign up for Power BI if you don't already have an account.
- Familiarity with Power BI service basics is helpful but not required.
Navigation pane
Use the navigation pane on the left to move around the Power BI service. Here's what each item does:
| Navigation item | Purpose |
|---|---|
| Home | Your landing page with recent items, favorites, and recommendations. |
| Browse | Lists of recent, favorite, and shared content. |
| OneLake | Discover semantic models and reusable data. |
| OneLake catalog | Search governed data assets across your organization. |
| Create | Start a new report, semantic model, or other content. Use the Excel or CSV connectors via Get data to create refreshable semantic models. The legacy Excel/CSV import experience is being retired; see Get data from Excel workbook files for details. |
| Apps | Access packaged report and dashboard collections. Learn more about Apps. |
| Workspaces | Team content containers. Learn more about Workspaces. |
| Metrics | Track organizational goals and KPIs. |
| Copilot | AI assistance for insights (if enabled). |
| Learn | Tutorials, samples, and training resources. |
Some items appear only with specific roles or licenses: Monitor, Real-Time, Deployment pipelines, and Workloads.
Key concepts
- Dashboards display key visuals from one or more reports on a single page. Learn more about dashboards.
- Reports contain multiple pages with detailed visualizations. Learn more about reports.
- Apps are curated collections of dashboards and reports packaged for your team.
- Workspaces are containers where content is stored and organized.