Note
Access to this page requires authorization. You can try signing in or changing directories.
Access to this page requires authorization. You can try changing directories.
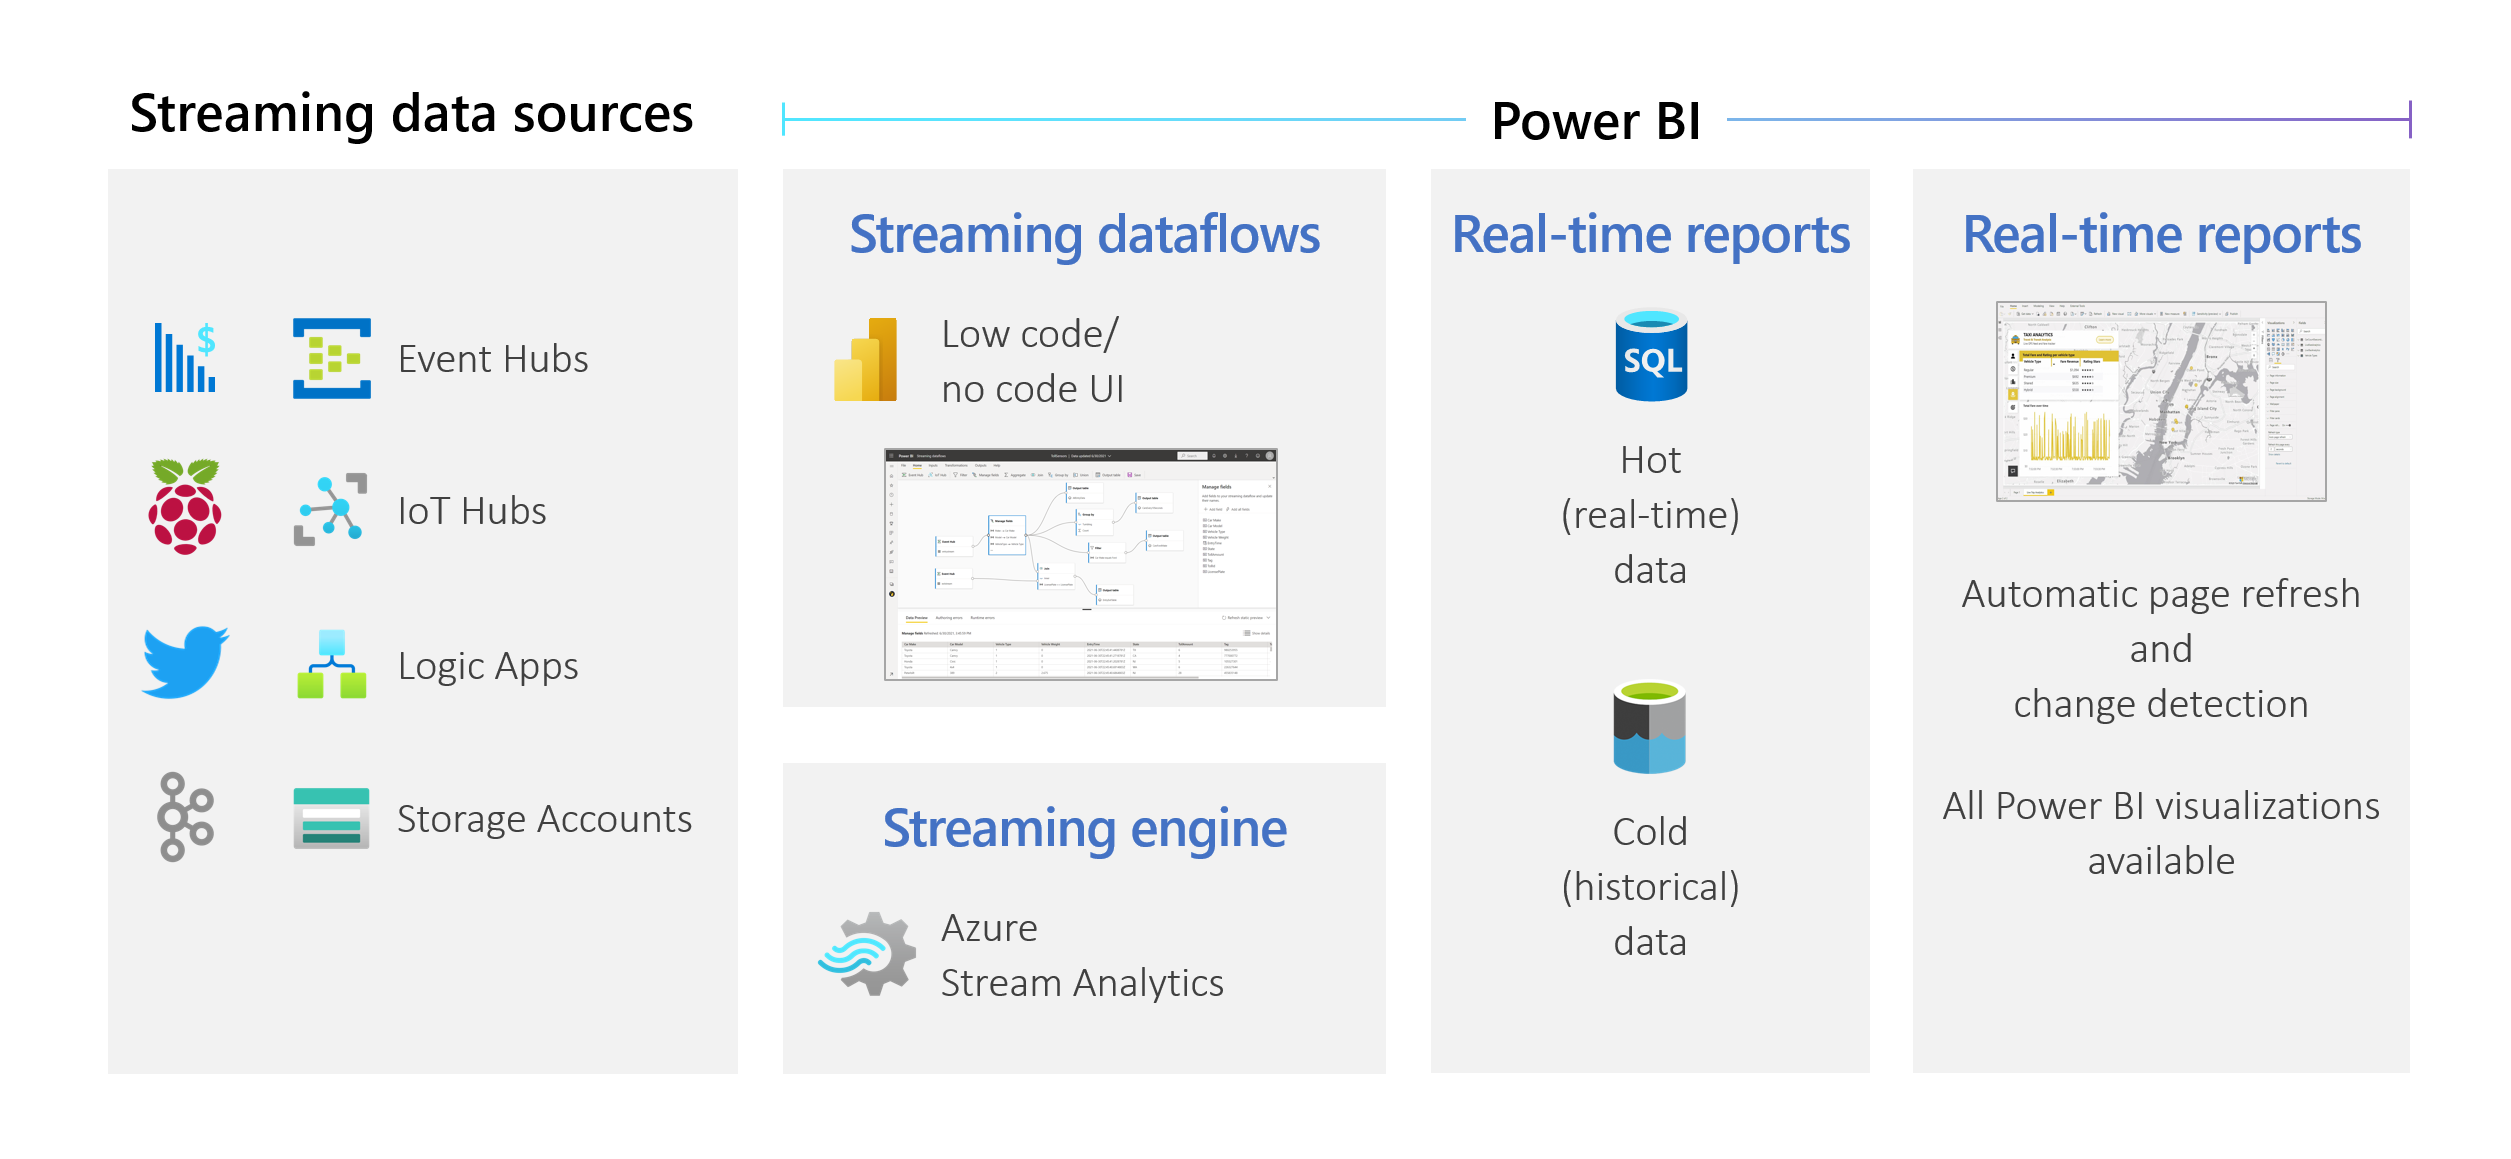
Organizations want to work with data as it comes in, not days or weeks later. The vision of Power BI is simple: the distinctions between batch, real-time, and streaming should disappear. Users should be able to work with all data as soon as it's available. Analysts usually need technical help to deal with streaming data sources, data preparation, complex time-based operations, and real-time data visualization. IT departments often rely on custom-built systems, and a combination of technologies from various vendors, to perform timely analyses on the data. Without this complexity, they can't provide decision makers with information in near real time.
Streaming dataflows allow authors to connect to, ingest, mash up, model, and build reports based on streaming in near real-time data directly in the Power BI service. The service enables drag-and-drop, no-code experiences. You can mix and match streaming data with batch data if you need to through a user interface (UI) that includes a diagram view for easy data mashup. The final item produced is a dataflow, which can be consumed in real time to create highly interactive, near real-time reporting. All of the data visualization capabilities in Power BI work with streaming data, just as they do with batch data.
Important
Streaming dataflows has been retired, and is no longer available. Azure Stream Analytics has merged the functionality of streaming dataflows. For more information about the retirement of streaming dataflows, see the retirement announcement.
 Users can perform data preparation operations like joins and filters. They can also perform time-window aggregations (such as tumbling, hopping, and session windows) for group-by operations.
Streaming dataflows in Power BI empower organizations to:
Users can perform data preparation operations like joins and filters. They can also perform time-window aggregations (such as tumbling, hopping, and session windows) for group-by operations.
Streaming dataflows in Power BI empower organizations to:
- Make confident decisions in near real time. Organizations can be more agile and take meaningful actions based on the most up-to-date insights.
- Democratize streaming data. Organizations can make data more accessible and easier to interpret with a no-code solution, and this accessibility reduces IT resources.
- Accelerate time to insight by using an end-to-end streaming analytics solution with integrated data storage and business intelligence.
Streaming dataflows support DirectQuery and automatic page refresh/change detection. This support allows users to build reports that update in near real time, up to every second, by using any visual available in Power BI.
Requirements
Before you create your first streaming dataflow, make sure that you meet all the following requirements:
To create and run a streaming dataflow, you need a workspace that's part of a Premium capacity or Premium Per User (PPU) license.
Important
If you're using a PPU license and you want other users to consume reports created with streaming dataflows that are updated in real time, they'll also need a PPU license. They can then consume the reports with the same refresh frequency that you set up, if that refresh is faster than every 30 minutes.
Enable dataflows for your tenant. For more information, see Enabling dataflows in Power BI Premium.
To make sure streaming dataflows work in your Premium capacity, the enhanced compute engine needs to be turned on. The engine is turned on by default, but Power BI capacity admins can turn it off. If so, contact your admin to turn it on.
The enhanced compute engine is available only in Premium P or Embedded A3 and larger capacities. To use streaming dataflows, you need either PPU, a Premium P capacity of any size, or an Embedded A3 or larger capacity. For more information about Premium SKUs and their specifications, see Capacity and SKUs in Power BI embedded analytics.
To create reports that are updated in real time, make sure that your admin (capacity or Power BI for PPU) has enabled automatic page refresh. Also make sure that the admin has allowed a minimum refresh interval that matches your needs. For more information, see Automatic page refresh in Power BI.
Create a streaming dataflow
A streaming dataflow, like its dataflow relative, is a collection of entities (tables) created and managed in workspaces in the Power BI service. A table is a set of fields that are used to store data, much like a table within a database.
You can add and edit tables in your streaming dataflow directly from the workspace in which your dataflow was created. The main difference with regular dataflows is that you don't need to worry about refreshes or frequency. Because of the nature of streaming data, there's a continuous stream coming in. The refresh is constant or infinite unless you stop it.
Note
You can have only one type of dataflow per workspace. If you already have a regular dataflow in your Premium workspace, you won't be able to create a streaming dataflow (and vice versa).
To create a streaming dataflow:
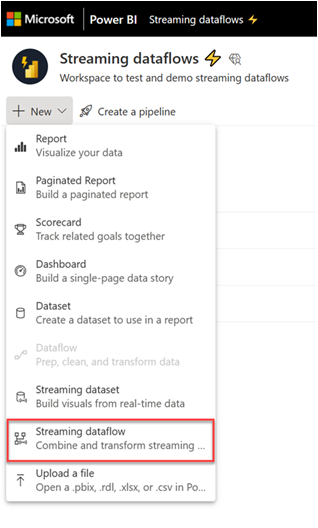
Open the Power BI service in a browser, and then select a Premium-enabled workspace. (Streaming dataflows, like regular dataflows, aren't available in My Workspace.)
Select the New dropdown menu, and then choose Streaming dataflow.
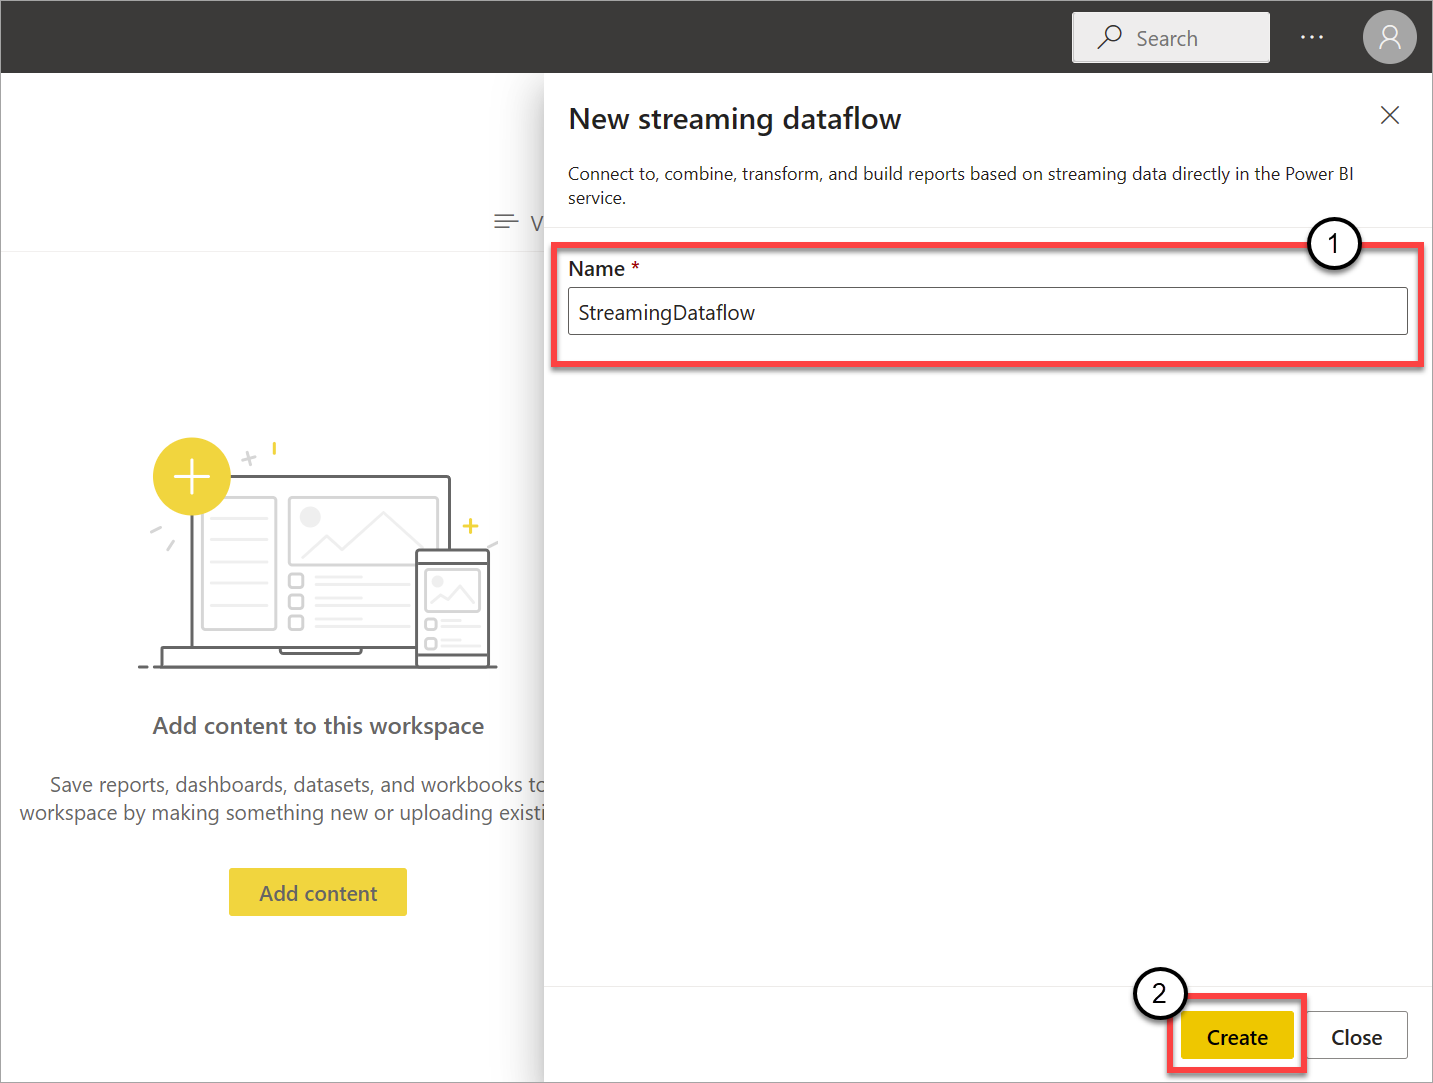
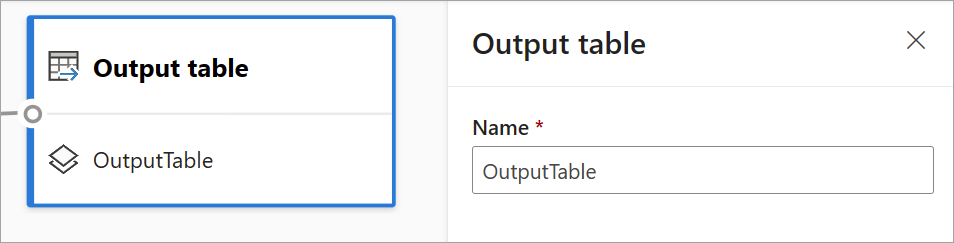
On the side pane that opens, you must name your streaming dataflow. Enter a name in the Name box (1), and then select Create (2).
The empty diagram view for streaming dataflows appears.
The following screenshot shows a finished dataflow. It highlights all the sections available to you for authoring in the streaming dataflow UI.

Ribbon: On the ribbon, sections follow the order of a "classic" analytics process: inputs (also known as data sources), transformations (streaming ETL operations), outputs, and a button to save your progress.
Diagram view: This view is a graphical representation of your dataflow, from inputs to operations to outputs.
Side pane: Depending on which component you select in the diagram view, you have settings to modify each input, transformation, or output.
Tabs for data preview, authoring errors, and runtime errors: For each card shown, the data preview shows you results for that step (live for inputs and on-demand for transformations and outputs).
This section also summarizes any authoring errors or warnings that you might have in your dataflows. Selecting each error or warning selects that transform. In addition, you have access to runtime errors after the dataflow is running, such as dropped messages.
You can always minimize this section of streaming dataflows by selecting the arrow in the upper-right corner.
A streaming dataflow is built on three main components: streaming inputs, transformations, and outputs. You can have as many components as you want, including multiple inputs, parallel branches with multiple transformations, and multiple outputs.
Add a streaming input
To add a streaming input, select the icon on the ribbon and provide the information needed on the side pane to set it up. As of July 2021, the preview of streaming dataflows supports Azure Event Hubs and Azure IoT Hub as inputs.
The Azure Event Hubs and Azure IoT Hub services are built on a common architecture to facilitate the fast and scalable ingestion and consumption of events. IoT Hub in particular is tailored as a central message hub for communications in both directions between an IoT application and its attached devices.
Azure Event Hubs
Azure Event Hubs is a big data streaming platform and event ingestion service. It can receive and process millions of events per second. Data sent to an event hub can be transformed and stored by using any real-time analytics provider, or you can use batching or storage adapters.
To configure an event hub as an input for streaming dataflows, select the Event Hub icon. A card appears in the diagram view, including a side pane for its configuration.
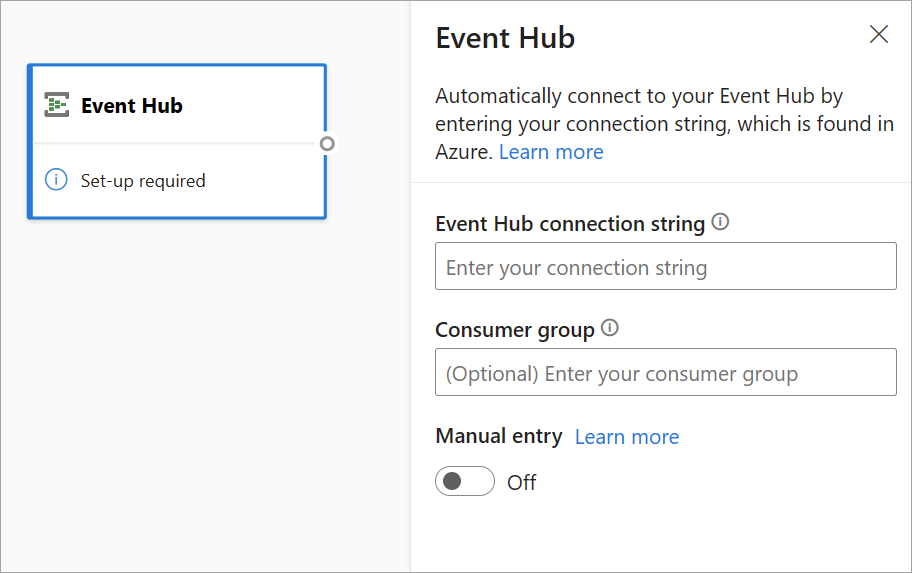
You have the option of pasting the Event Hubs connection string. Streaming dataflows fill out all the necessary information, including the optional consumer group (which by default is $Default). If you want to enter all fields manually, you can turn on the manual-entry toggle to show them. To learn more, see Get an Event Hubs connection string.
After you set up your Event Hubs credentials and select Connect, you can add fields manually by using + Add field if you know the field names. Alternatively, you can detect fields and data types automatically based on a sample of the incoming messages, select Autodetect fields. Selecting the gear icon allows you to edit the credentials if needed.
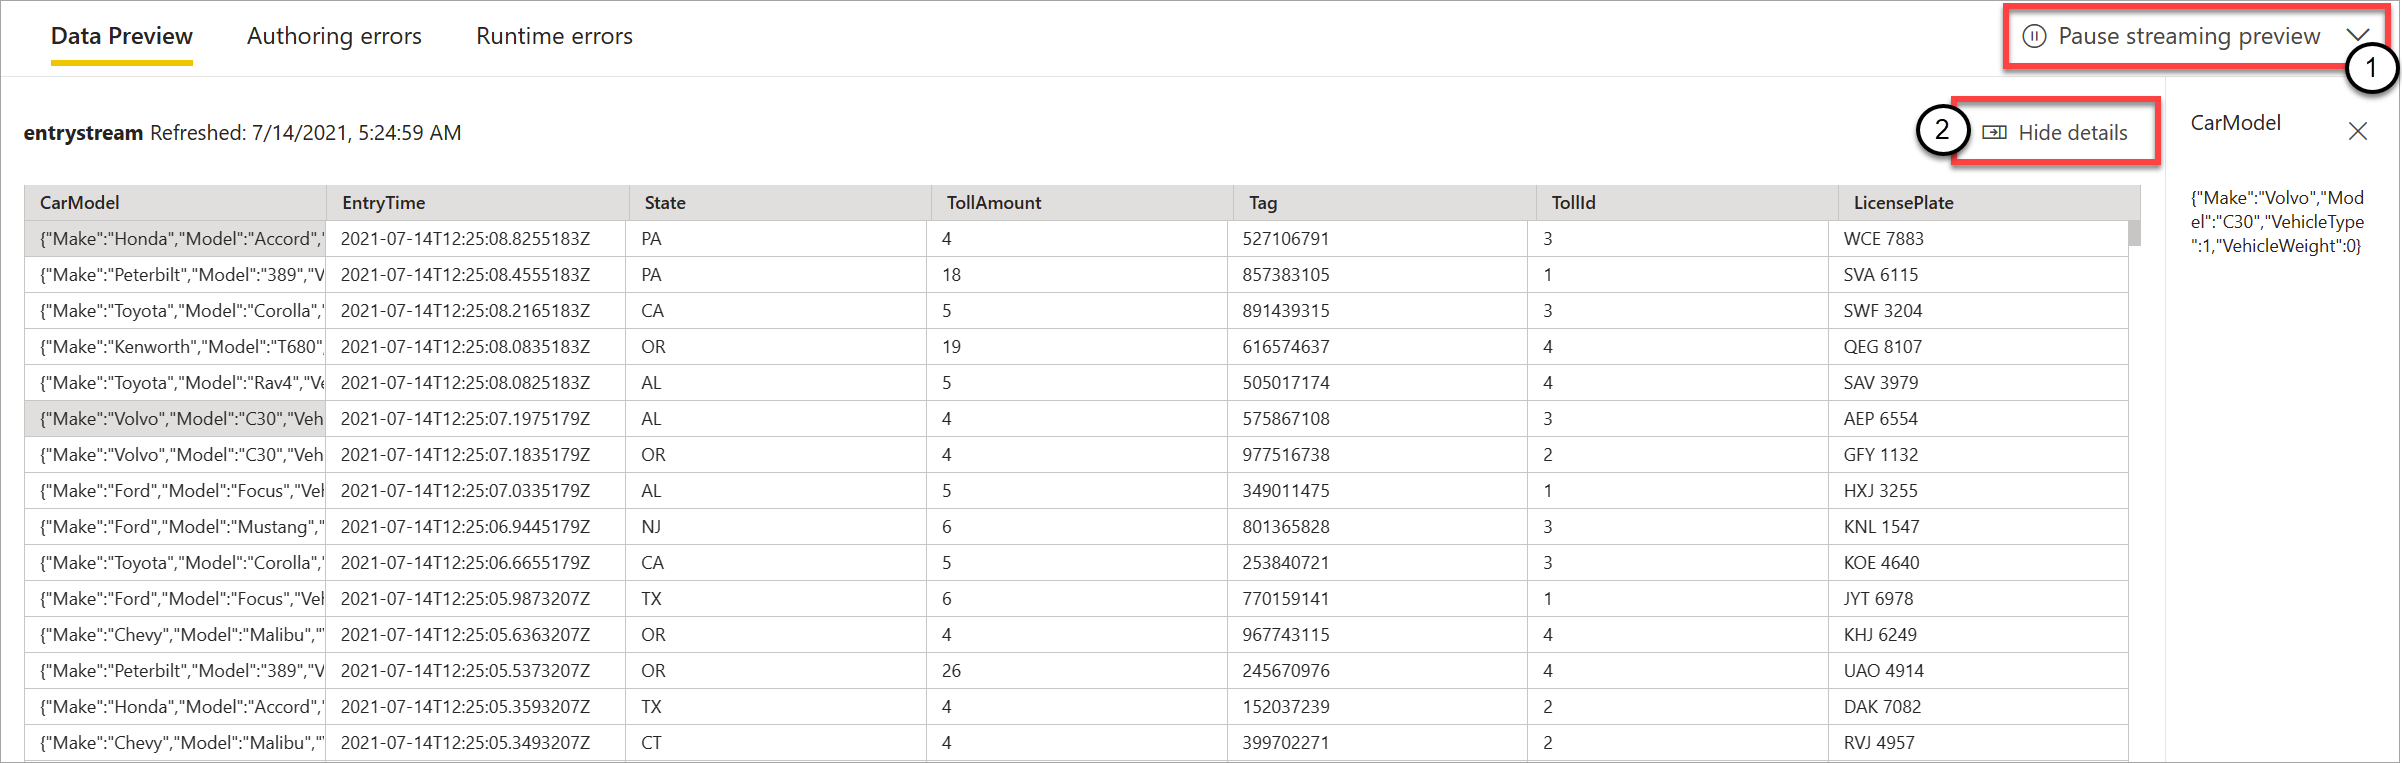
When streaming dataflows detect the fields, you can see them in the list. There's also a live preview of the incoming messages in the Data Preview table under the diagram view.
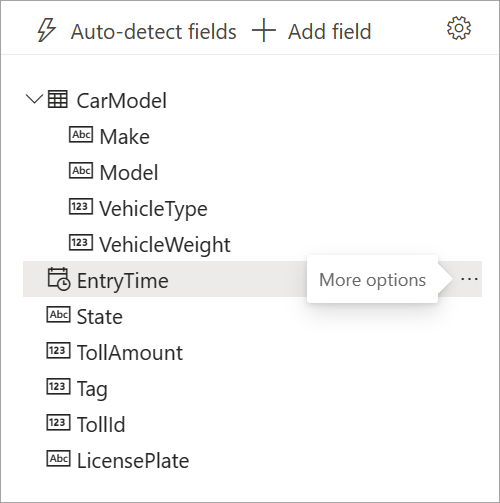
You can always edit the field names, or remove or change the data type, by selecting more options (...) next to each field. You can also expand, select, and edit any nested fields from the incoming messages, as shown in the following image.
Azure IoT Hub
IoT Hub is a managed service hosted in the cloud. It acts as a central message hub for communications in both directions between an IoT application and its attached devices. You can connect millions of devices and their back-end solutions reliably and securely. Almost any device can be connected to an IoT hub.
IoT Hub configuration is similar to Event Hubs configuration because of their common architecture. But there are some differences, including where to find the Event Hubs-compatible connection string for the built-in endpoint. To learn more, see Read device-to-cloud messages from the built-in endpoint.
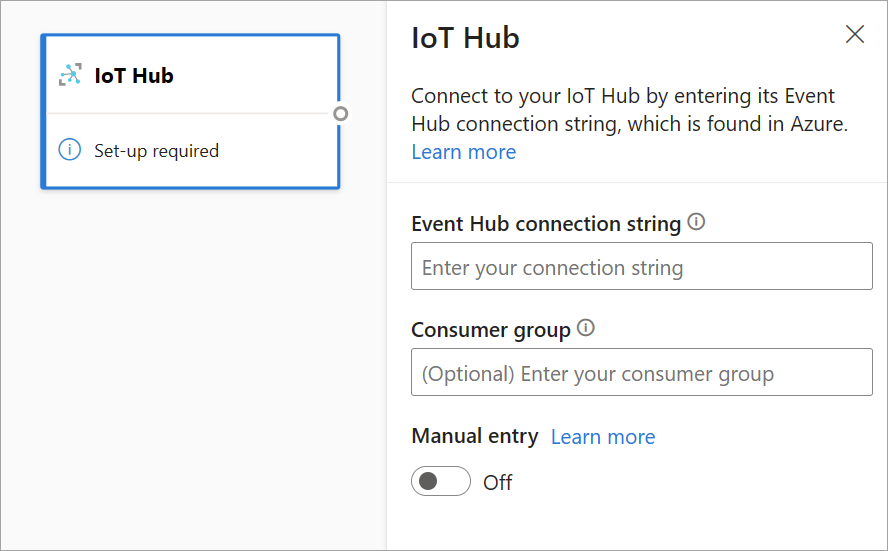
After you paste the connection string for the built-in endpoint, all functionality for selecting, adding, autodetecting, and editing fields coming in from IoT Hub is the same as in Event Hubs. You can also edit the credentials by selecting the gear icon.
Tip
If you have access to Event Hubs or IoT Hub in your organization's Azure portal, and you want to use it as an input for your streaming dataflow, you can find the connection strings in the following locations:
For Event Hubs:
- In the Analytics section, select All Services > Event Hubs.
- Select Event Hubs Namespace > Entities/Event Hubs, and then select the event hub name.
- In the Shared Access Policies list, select a policy.
- Select Copy to clipboard next to the Connection string-primary key field.
For IoT Hub:
- In the Internet of Things section, select All Services > IoT Hubs.
- Select the IoT hub that you want to connect to, and then select Built-in endpoints.
- Select Copy to clipboard next to the Event Hubs-compatible endpoint.
When you use stream data from Event Hubs or IoT Hub, you have access to the following metadata time fields in your streaming dataflow:
- EventProcessedUtcTime: The date and time that the event was processed.
- EventEnqueuedUtcTime: The date and time that the event was received.
Neither of these fields appear in the input preview. You need to add them manually.
Blob storage
Azure Blob storage is Microsoft's object storage solution for the cloud. Blob storage is optimized for storing massive amounts of unstructured data. Unstructured data is data that doesn't adhere to a particular data model or definition, such as text or binary data.
You can use Azure Blobs as a streaming or reference input. Streaming blobs are checked every second for updates. Unlike a streaming blob, a reference blob is only loaded at the beginning of the refresh. It's static data that isn’t expected to change, and the recommended limit for static data is 50 MB or less.
Power BI expects reference blobs to be used alongside streaming sources, for example, through a JOIN. Hence, a streaming dataflow with a reference blob must also have a streaming source.
The configuration for Azure Blobs is slightly different to that of an Azure Event Hubs node. To find your Azure Blob connection string, see View account access keys.
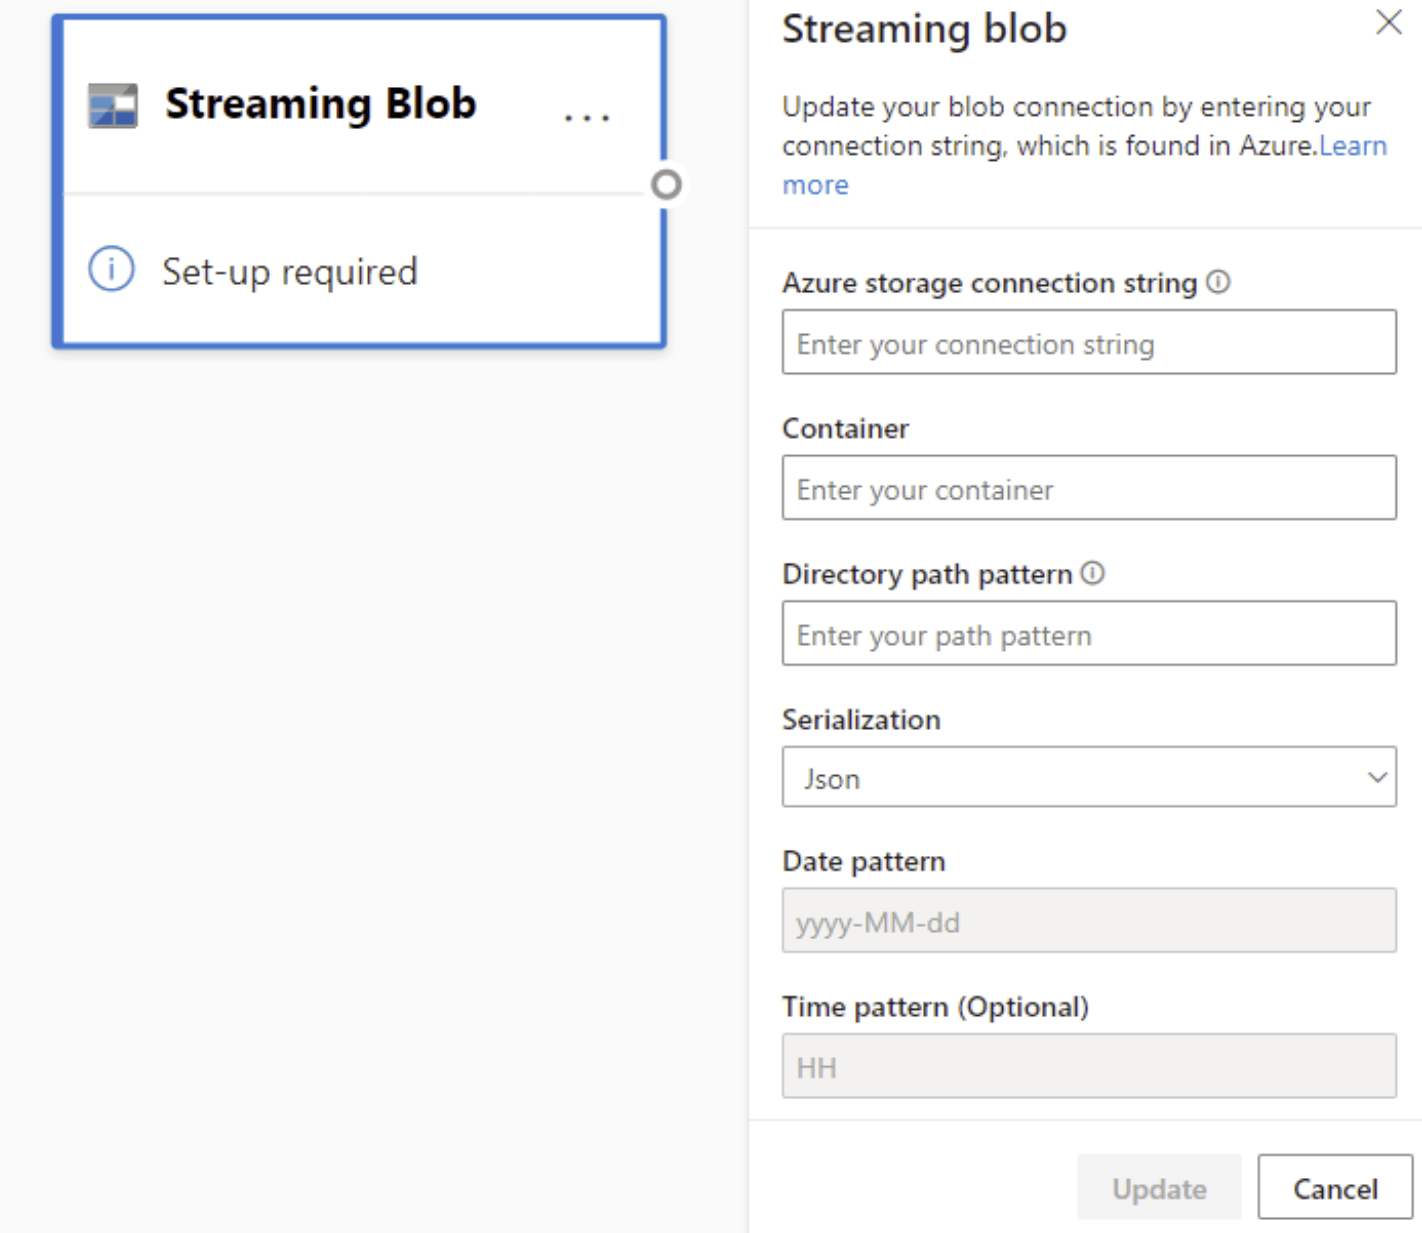
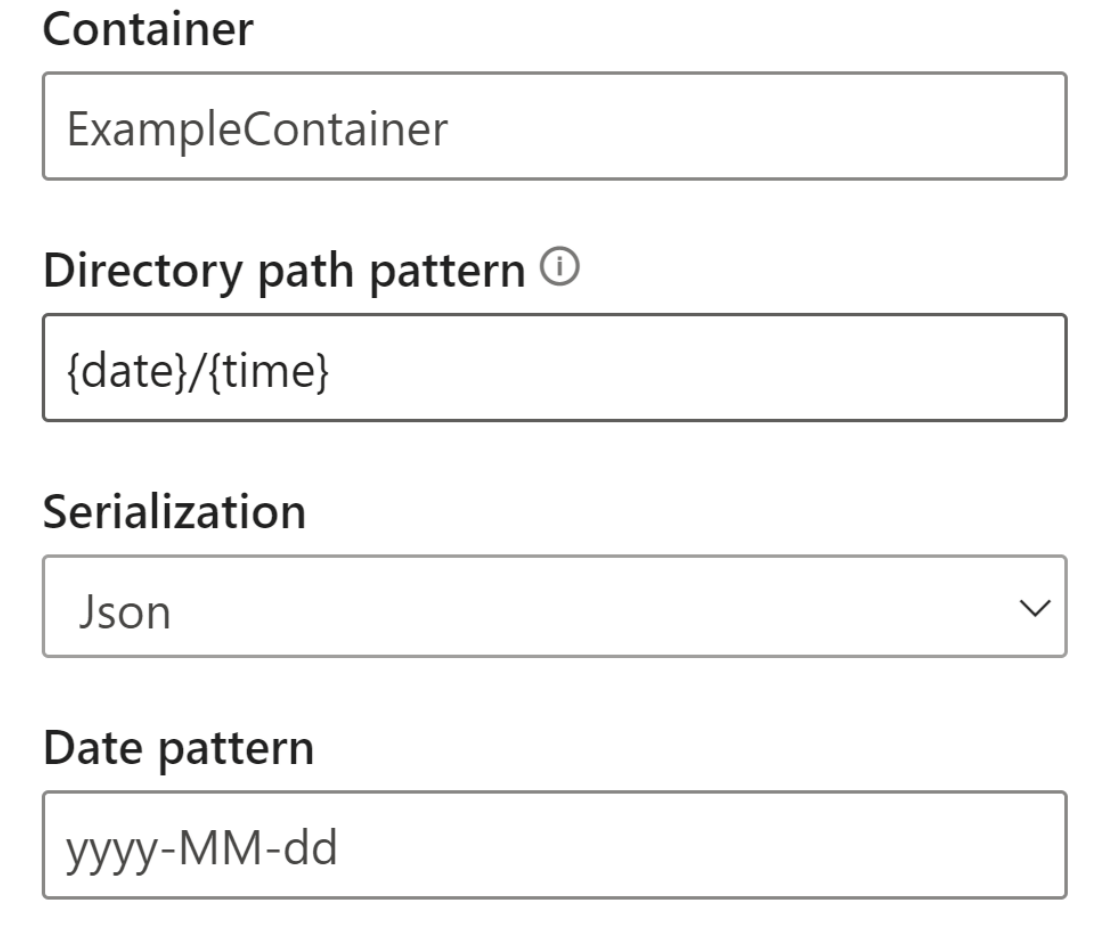
After you enter the Blob connection string, you need to provide the name of your container. You also need to enter the path pattern within your directory to access the files you want to set as the source for your dataflow.
For streaming blobs, the directory path pattern is expected to be a dynamic value. The date is required to be a part of the filepath for the blob – referenced as {date}. Furthermore, an asterisk (*) in the path pattern, like {date}/{time}/*.json, isn't be supported.
For example, if you have a blob called ExampleContainer that you're storing nested .json files inside, where the first level is the date of creation and the second level is the hour of creation (yyyy-mm-dd/hh), then your Container input would be “ExampleContainer”. The Directory path pattern would be “{date}/{time}” where you could modify the date and time pattern.
After your blob is connected to the endpoint, all functionality for selecting, adding, autodetecting, and editing fields coming in from Azure Blob is the same as in Event Hubs. You can also edit the credentials by selecting the gear icon.
Often, when working with real time data, data is condensed, and Identifiers are used to represent the object. A possible use case for blobs could also be as reference data for your streaming sources. Reference data allows you to join static data to streaming data to enrich your streams for analysis. A quick example of when this feature would be helpful would be if you were installing sensors at different department stores to measure how many people are entering the store at a given time. Usually, the sensor ID needs to be joined onto a static table to indicate which department store and which location the sensor is located at. Now with reference data, it's possible to join this data during the ingestion phase to make it easy to see which store has the highest output of users.
Note
A Streaming Dataflows job pulls data from Azure Blob storage or ADLS Gen2 input every second if the blob file is available. If the blob file is unavailable, there is an exponential backoff with a maximum time delay of 90 seconds.
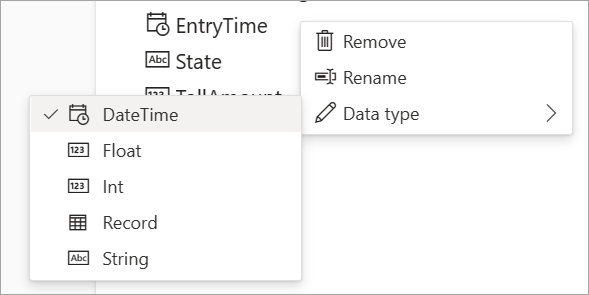
Data types
The available data types for streaming dataflows fields include:
- DateTime: Date and time field in ISO format
- Float: Decimal number
- Int: Integer number
- Record: Nested object with multiple records
- String: Text
Important
The data types selected for a streaming input have important implications downstream for your streaming dataflow. Select the data type as early as you can in your dataflow to avoid having to stop it later for edits.
Add a streaming data transformation
Streaming data transformations are inherently different from batch data transformations. Almost all streaming data has a time component which affects any data preparation tasks involved.
To add a streaming data transformation to your dataflow, select the transformation icon on the ribbon for that transformation. The respective card appears in the diagram view. After you select it, you'll see the side pane for that transformation to configure it.
As of July 2021, streaming dataflows support the following streaming transformations.
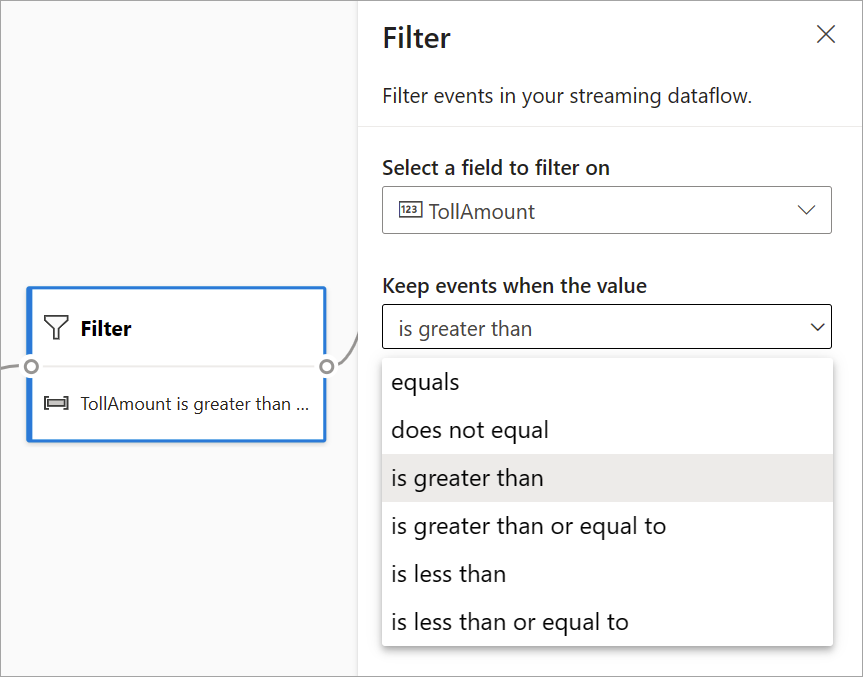
Filter
Use the Filter transformation to filter events based on the value of a field in the input. Depending on the data type (number or text), the transformation keeps the values that match the selected condition.
Note
Inside every card, you'll see information about what else is needed for the transformation to be ready. For example, when you're adding a new card, you'll see a "Set-up required" message. If you're missing a node connector, you'll see either an "Error" or a "Warning" message.
Manage fields
The Manage fields transformation allows you to add, remove, or rename fields coming in from an input or another transformation. The settings on the side pane give you the option of adding a new one by selecting Add field or adding all fields at once.
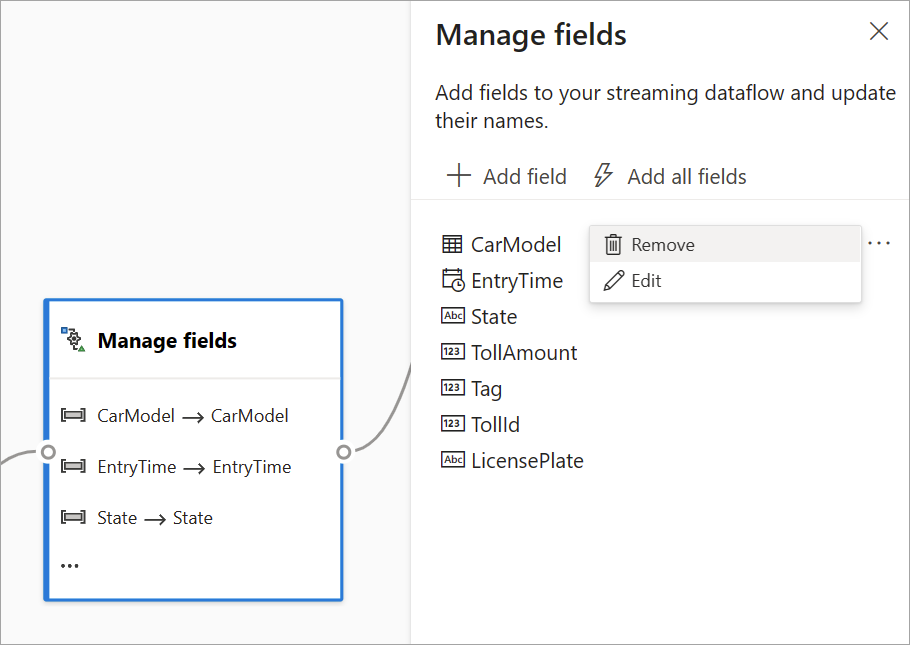
Tip
After you configure a card, the diagram view gives you a glimpse of the settings within the card itself. For example, in the Manage fields area of the preceding image, you can see the first three fields being managed and the new names assigned to them. Each card has information relevant to it.
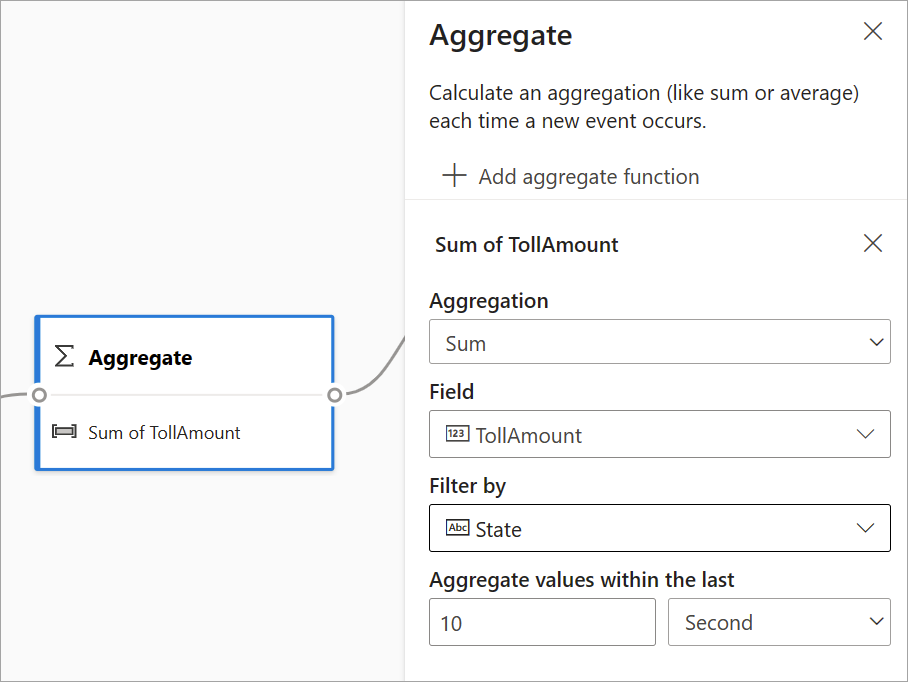
Aggregate
You can use the Aggregate transformation to calculate an aggregation (Sum, Minimum, Maximum, or Average) every time a new event occurs over a period of time. This operation also allows you to filter or slice the aggregation based on other dimensions in your data. You can have one or more aggregations in the same transformation.
To add an aggregation, select the transformation icon. Then connect an input, select the aggregation, add any filter or slice dimensions, and choose the period of time when you want to calculate the aggregation. This example calculates the sum of the toll value by the state where the vehicle is from over the last 10 seconds.
To add another aggregation to the same transformation, select Add aggregate function. Keep in mind that the filter or slice applies to all aggregations in the transformation.
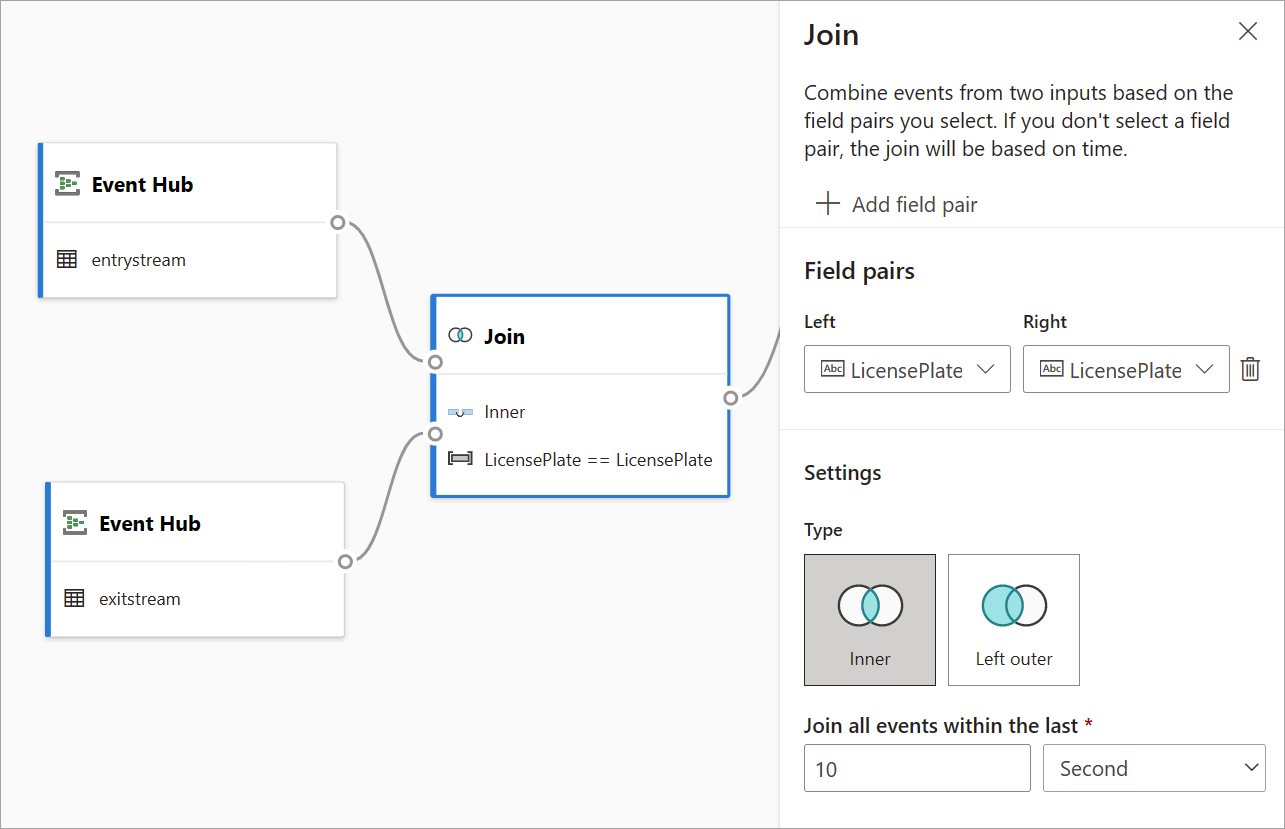
Join
Use the Join transformation to combine events from two inputs based on the field pairs that you select. If you don't select a field pair, the join is based on time by default. The default is what makes this transformation different from a batch one.
As with regular joins, you have different options for your join logic:
- Inner join: Include only records from both tables where the pair matches. In this example, that's where the license plate matches both inputs.
- Left outer join: Include all records from the left (first) table and only the records from the second one that match the pair of fields. If there's no match, the fields from the second input are set blank.
To select the type of join, select the icon for the preferred type on the side pane.
Finally, select over what period of time you want the join to be calculated. In this example, the join looks at the last 10 seconds. Keep in mind that the longer the period is, the less frequent the output is—and the more processing resources you use for the transformation.
By default, all fields from both tables are included. Prefixes left (first node) and right (second node) in the output help you differentiate the source.
Group by
Use the Group by transformation to calculate aggregations across all events within a certain time window. You can group by the values in one or more fields. It's similar to the Aggregate transformation but provides more options for aggregations. It also includes more complex time-window options. Also similar to Aggregate, you can add more than one aggregation per transformation.
The aggregations available in this transformation are: Average, Count, Maximum, Minimum, Percentile (continuous and discrete), Standard Deviation, Sum, and Variance.
To configure this transformation:
- Select your preferred aggregation.
- Choose the field that you want to aggregate on.
- Select an optional group-by field if you want to get the aggregate calculation over another dimension or category (for example, State).
- Choose your function for time windows.
To add another aggregation to the same transformation, select Add aggregate function. Keep in mind that the Group by field and the windowing function applies to all aggregations in the transformation.
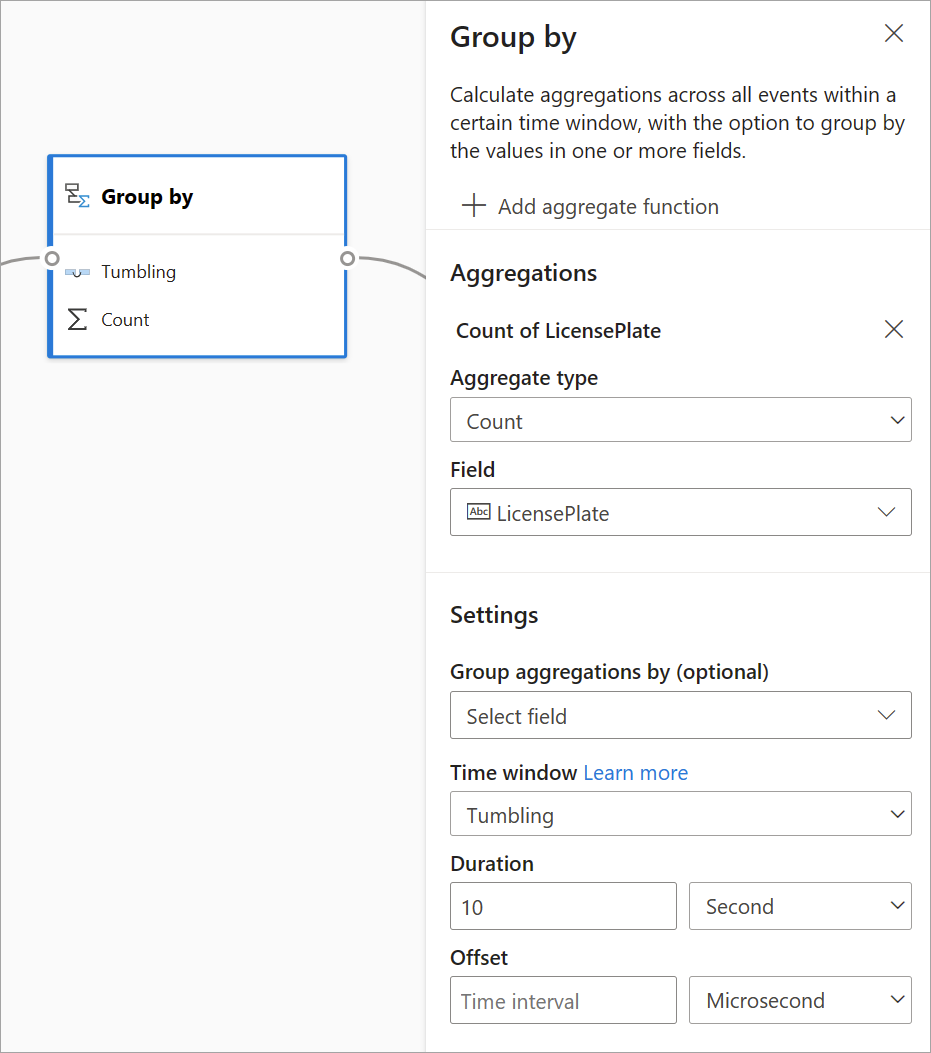
A time stamp for the end of the time window is provided as part of the transformation output for reference.
A section later in this article explains each type of time window available for this transformation.
Union
Use the Union transformation to connect two or more inputs to add events with shared fields (with the same name and data type) into one table. Fields that don't match are dropped and not included in the output.
Set up time-window functions
Time windows are one of the most complex concepts in streaming data. This concept sits at the core of streaming analytics.
With streaming dataflows, you can set up time windows when you're aggregating data as an option for the Group by transformation.
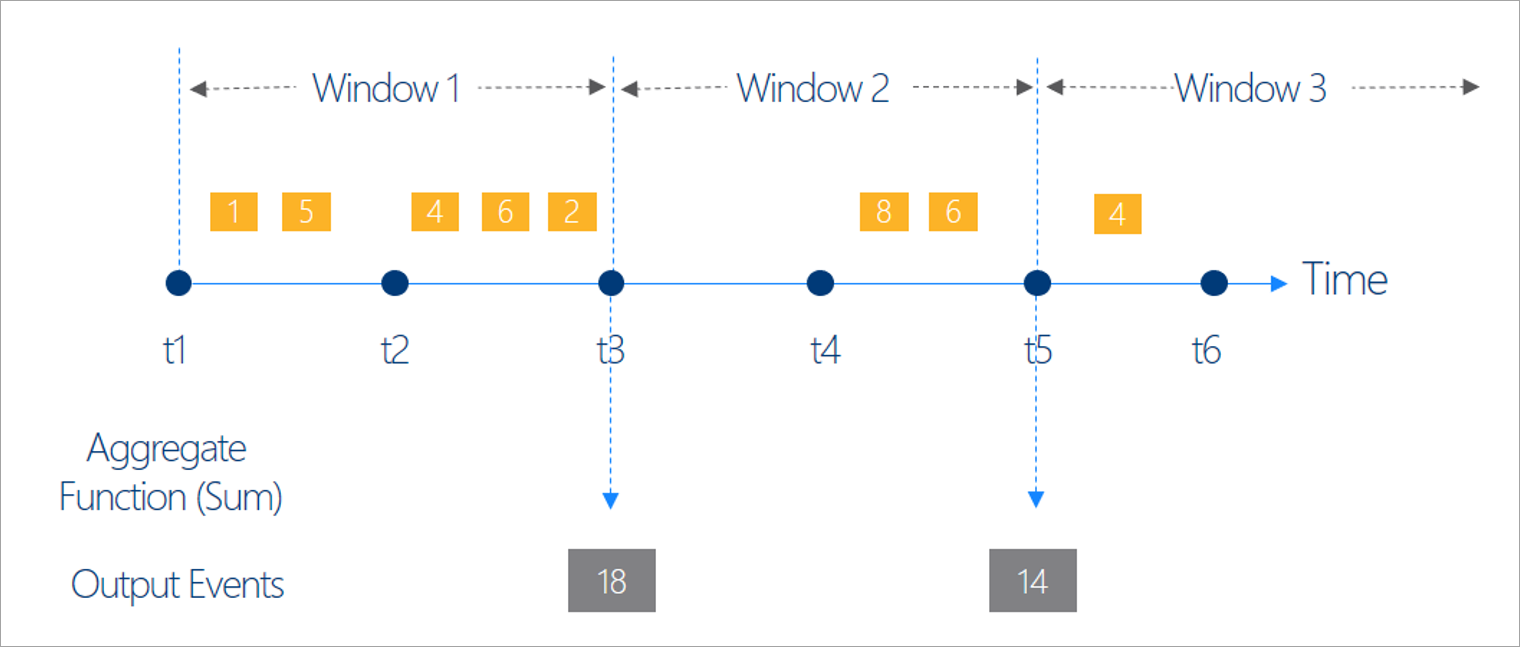
Note
Keep in mind that all the output results for windowing operations are calculated at the end of the time window. The output of the window will be a single event that's based on the aggregate function. This event will have the time stamp of the end of the window, and all window functions are defined with a fixed length.
There are five kinds of time windows to choose from: tumbling, hopping, sliding, session, and snapshot.
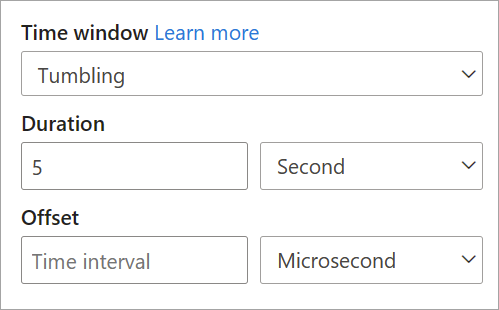
Tumbling window
Tumbling is the most common type of time window. The key characteristics of tumbling windows are that they repeat, have the same time length, and don't overlap. An event can't belong to more than one tumbling window.
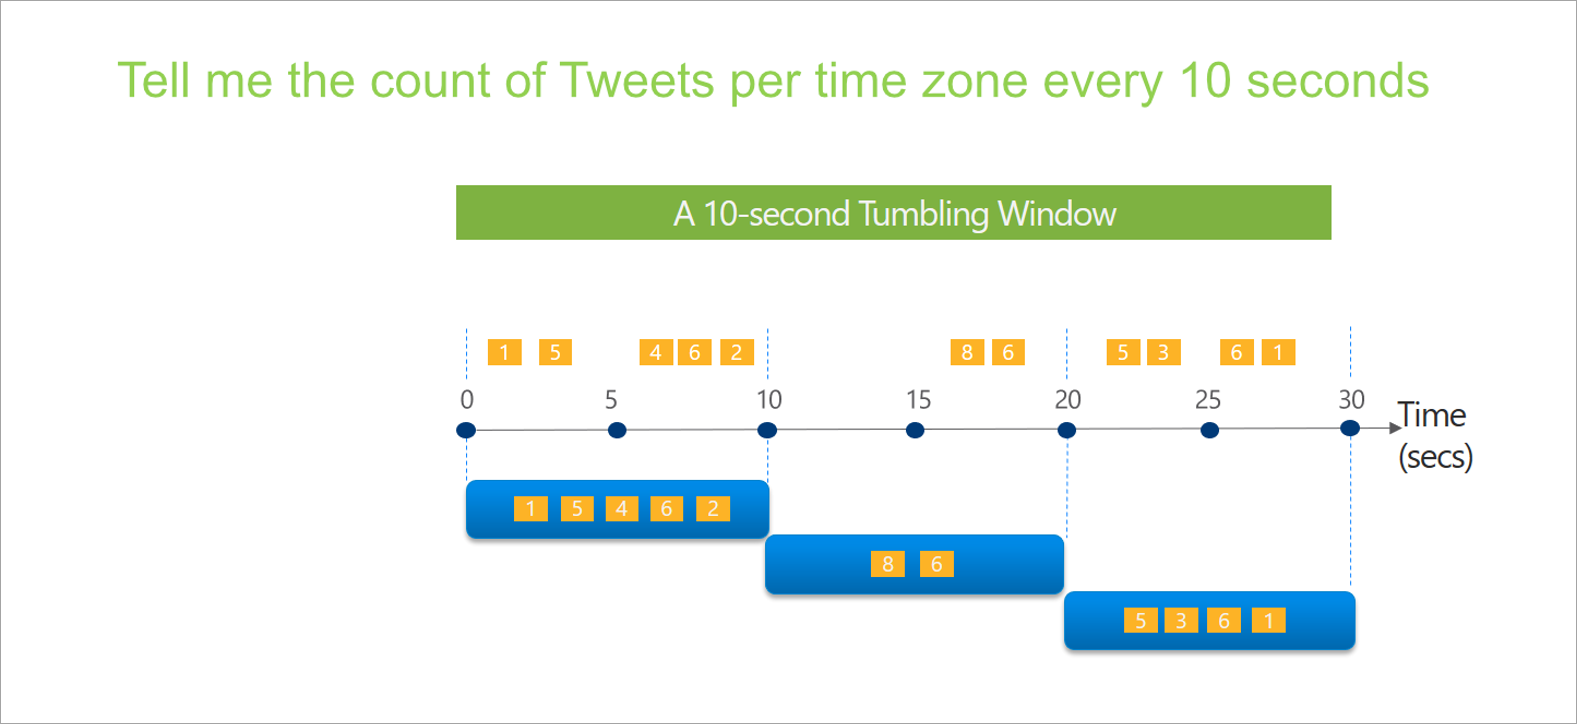
When you're setting up a tumbling window in streaming dataflows, you need to provide the duration of the window (same for all windows in this case). You also can provide an optional offset. By default, tumbling windows include the end of the window and exclude the beginning. You can use this parameter to change this behavior and include the events in the beginning of the window and exclude the ones in the end.
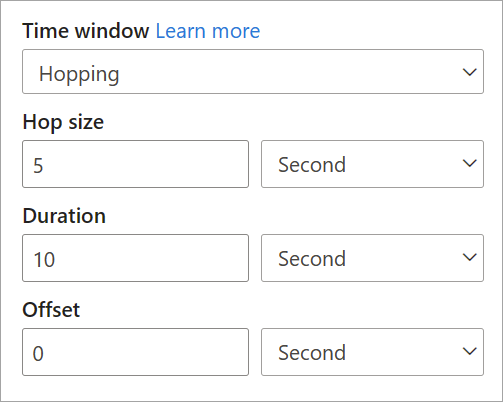
Hopping window
Hopping windows "hop" forward in time by a fixed period. You can think of them as tumbling windows that can overlap and be emitted more often than the window size. Events can belong to more than one result set for a hopping window. To make a hopping window the same as a tumbling window, you can specify the hop size to be the same as the window size.
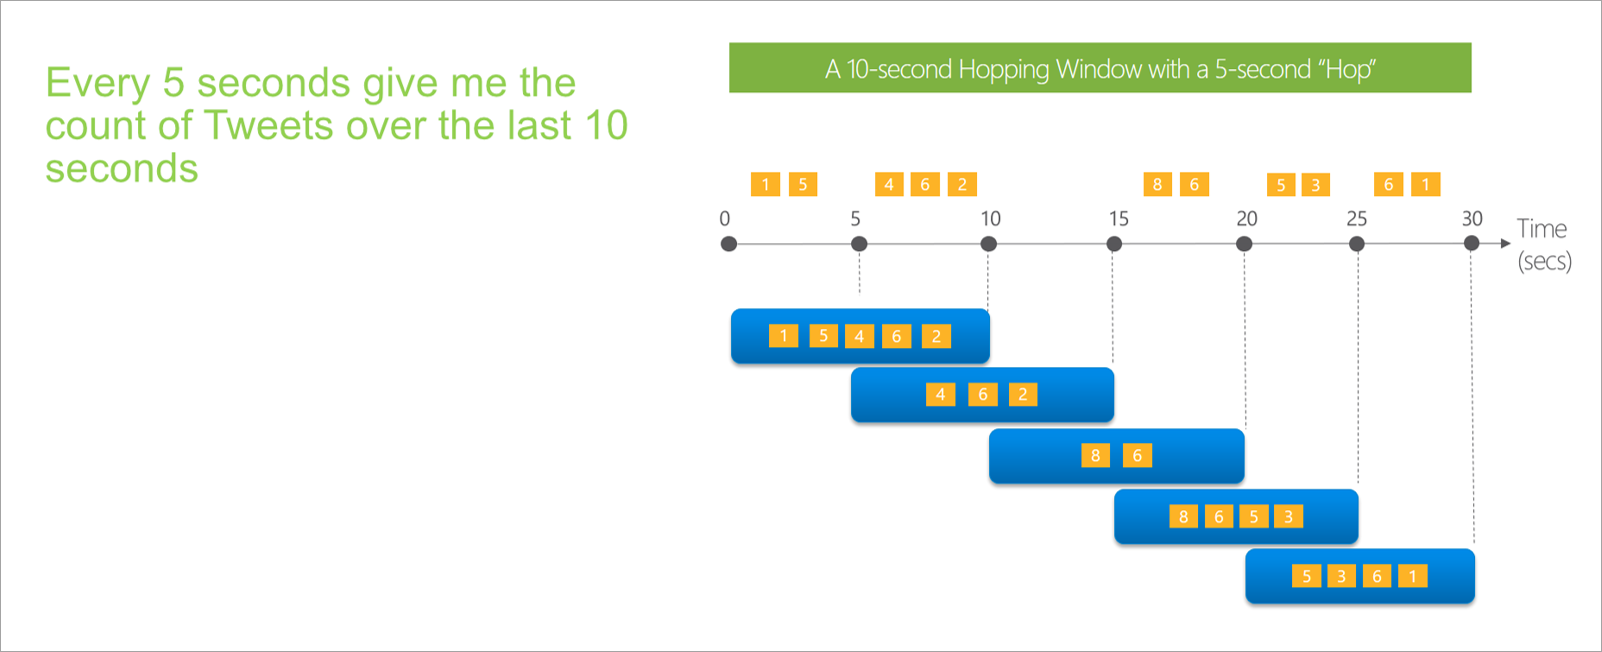
When you're setting up a hopping window in streaming dataflows, you need to provide the duration of the window (same as with tumbling windows). You also need to provide the hop size, which tells streaming dataflows how often you want the aggregation to be calculated for the defined duration.
The offset parameter is also available in hopping windows for the same reason as in tumbling windows. It defines the logic for including and excluding events for the beginning and end of the hopping window.
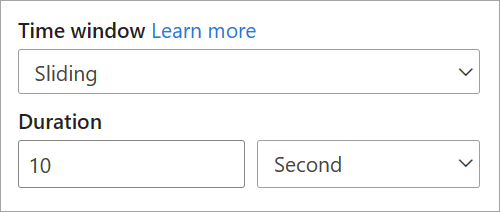
Sliding window
Sliding windows, unlike tumbling or hopping windows, calculate the aggregation only for points in time when the content of the window actually changes. When an event enters or exits the window, the aggregation is calculated. So, every window has at least one event. Similar to hopping windows, events can belong to more than one sliding window.
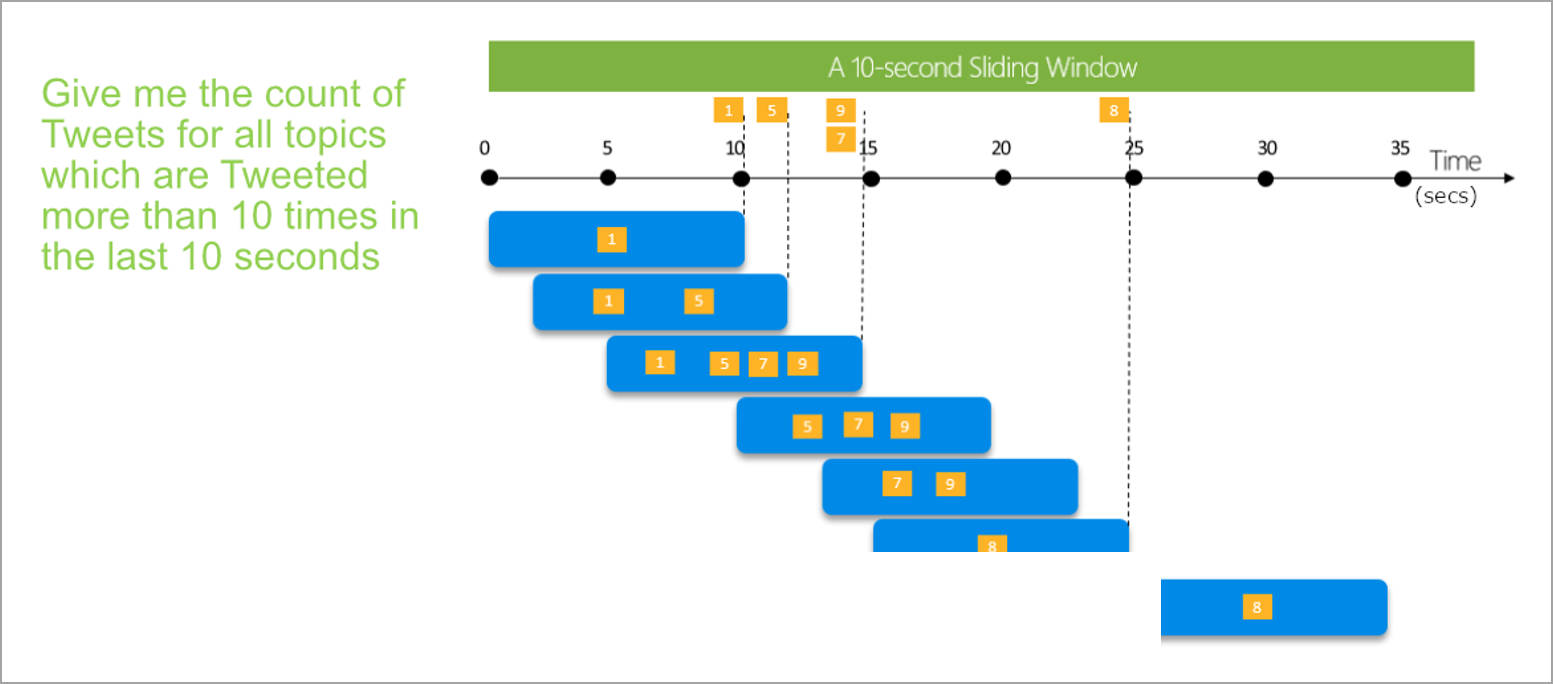
The only parameter that you need for a sliding window is the duration, because events themselves define when the window starts. No offset logic is necessary.
Session window
Session windows are the most complex type. They group events that arrive at similar times, filtering out periods of time where there's no data. For this window, it's necessary to provide:
- A timeout: how long to wait if there's no new data.
- A maximum duration: the longest time that the aggregation calculates if data keeps coming.
You can also define a partition, if you want.
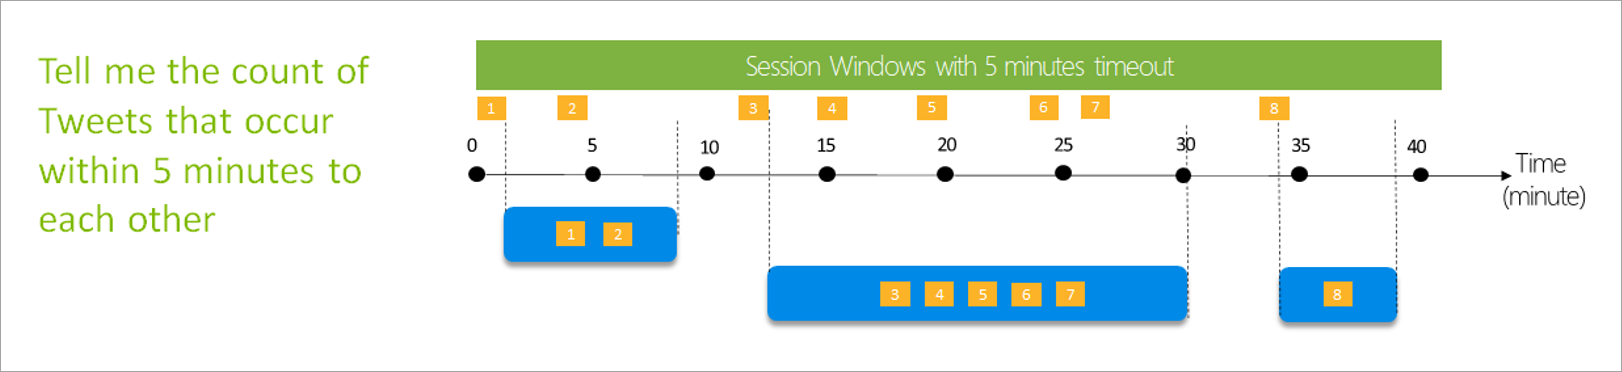
You set up a session window directly on the side pane for the transformation. If you provide a partition, the aggregation will only group events together for the same key.
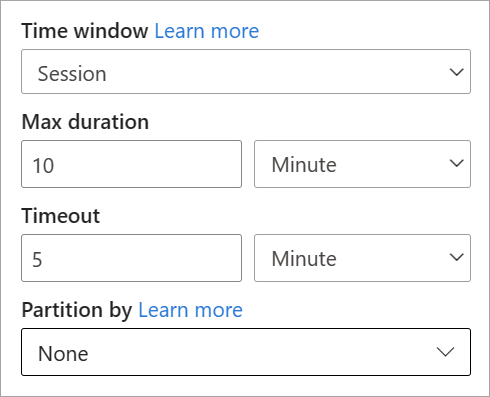
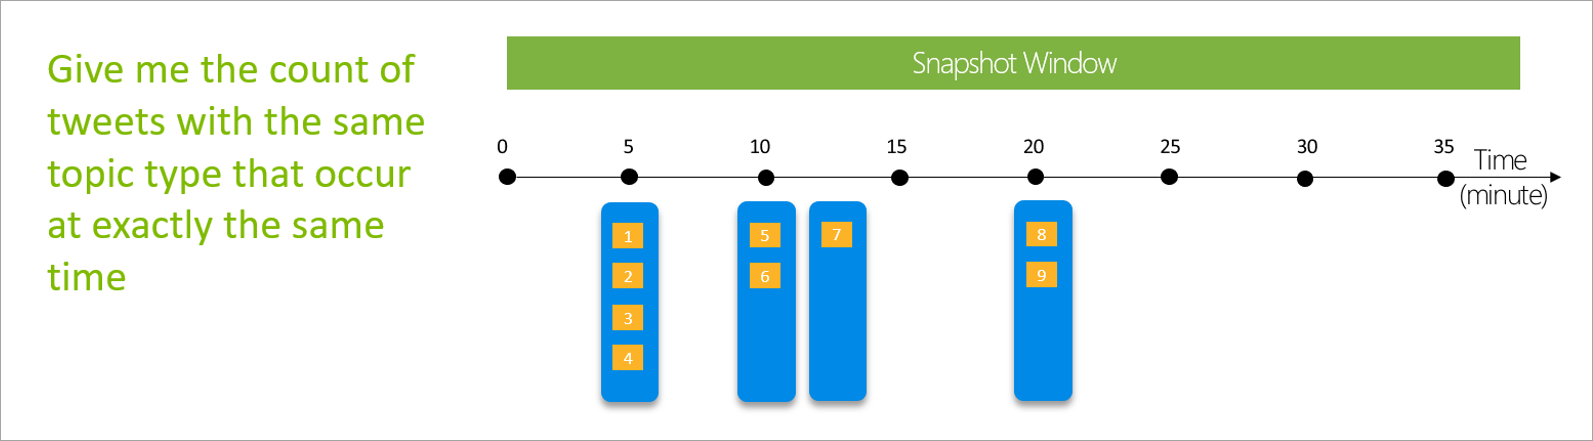
Snapshot window
Snapshot windows group events that have the same time stamp. Unlike other windows, a snapshot doesn't require any parameters because it uses the time from the system.
Define outputs
After setting up inputs and transformations, it's time to define one or more outputs. As of July of 2021, streaming dataflows support Power BI tables as the only type of output.
This output is a dataflow table (that is, an entity) that you can use to create reports in Power BI Desktop. You need to join the nodes of the previous step with the output that you're creating to make it work. After that, name the table.
After you connect to your dataflow, this table will be available for you to create visuals that are updated in real time for your reports.
Data preview and errors
Streaming dataflows provide tools to help you author, troubleshoot, and evaluate the performance of your analytics pipeline for streaming data.
Live data preview for inputs
When you're connecting to an event hub or IoT hub and selecting its card in the diagram view (the Data Preview tab), you get a live preview of data coming in if all the following are true:
- Data is being pushed.
- The input is configured correctly.
- Fields have been added.
As shown in the following screenshot, if you want to see or drill down into something specific, you can pause the preview (1). Or you can start it again if you're done.
You can also see the details of a specific record (a "cell" in the table) by selecting it and then selecting Show details or Hide details (2). The screenshot shows the detailed view of a nested object in a record.
Static preview for transformations and outputs
After you add and set up any steps in the diagram view, you can test their behavior by selecting the static data button.

After you do, streaming dataflows evaluate all transformation and outputs that are configured correctly. Streaming dataflows then display the results in the static data preview, as shown in the following image.
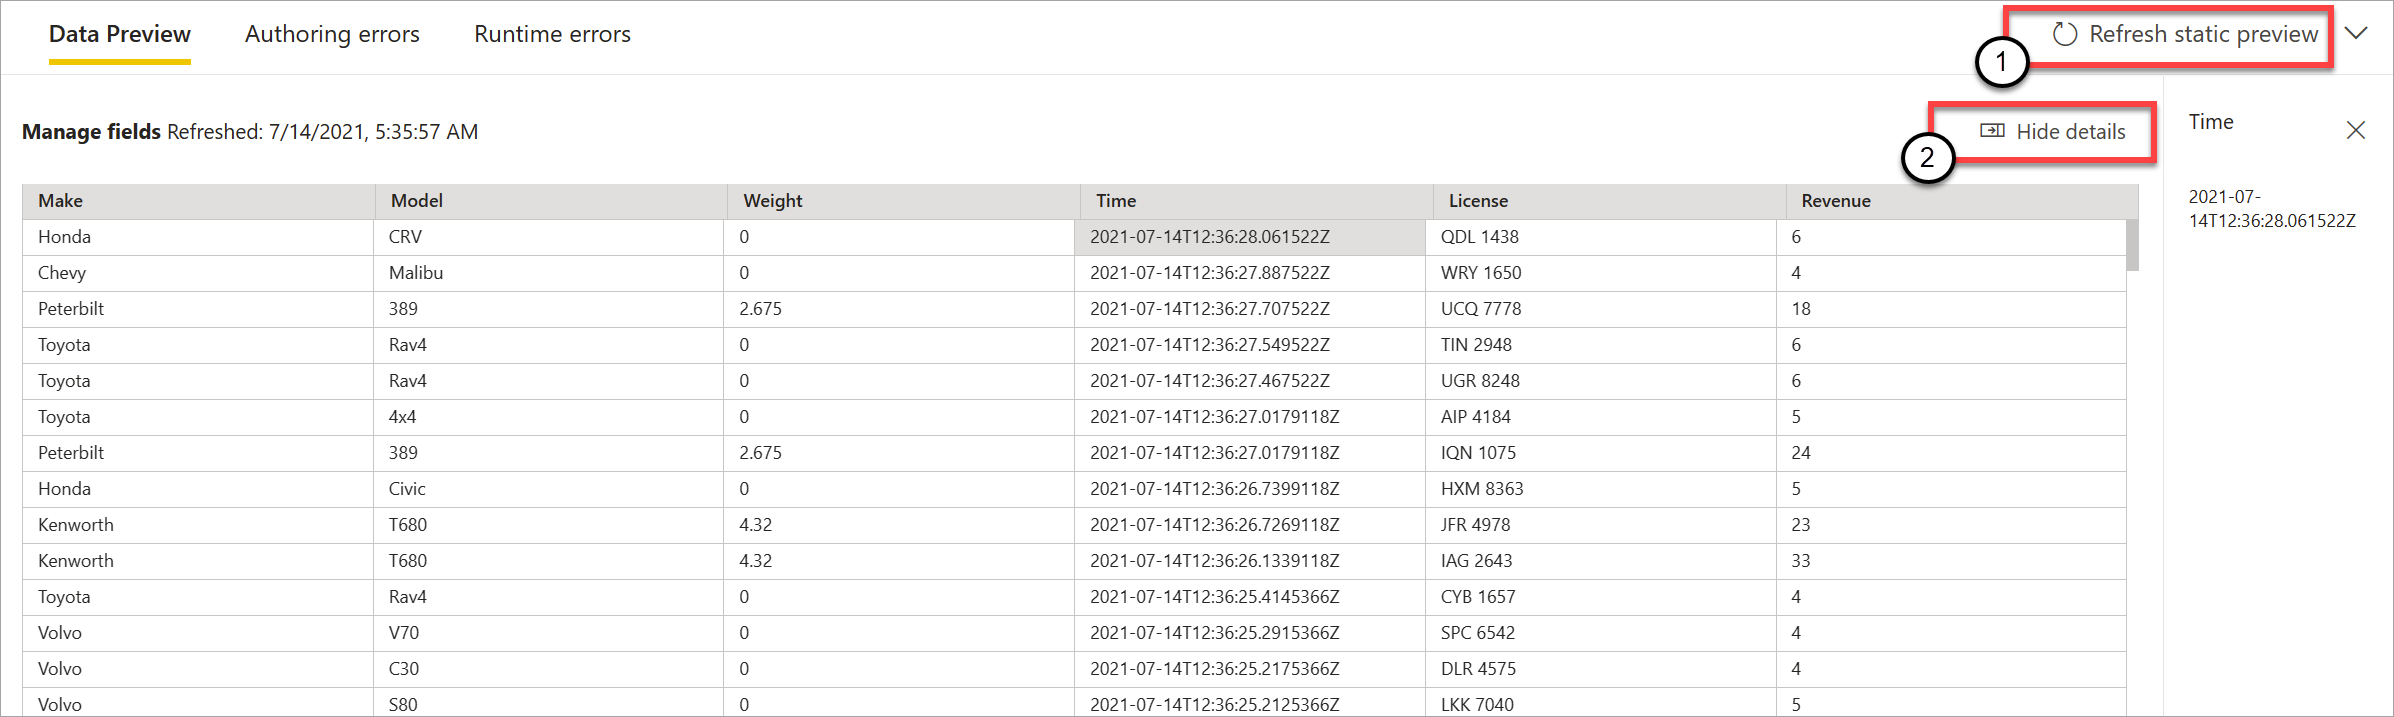
You can refresh the preview by selecting Refresh static preview (1). When you do this, streaming dataflows take new data from the input and evaluate all transformations and outputs again with any updates that you might perform. The Show or Hide details option is also available (2).
Authoring errors
If you have any authoring errors or warnings, the Authoring errors tab (1) lists them, as shown in the following screenshot. The list includes details of the error or warning, the type of card (input, transformation, or output), the error level, and a description of the error or warning (2). When you select any of the errors or warnings, the respective card is selected and the configuration side pane opens for you to make the needed changes.

Runtime errors
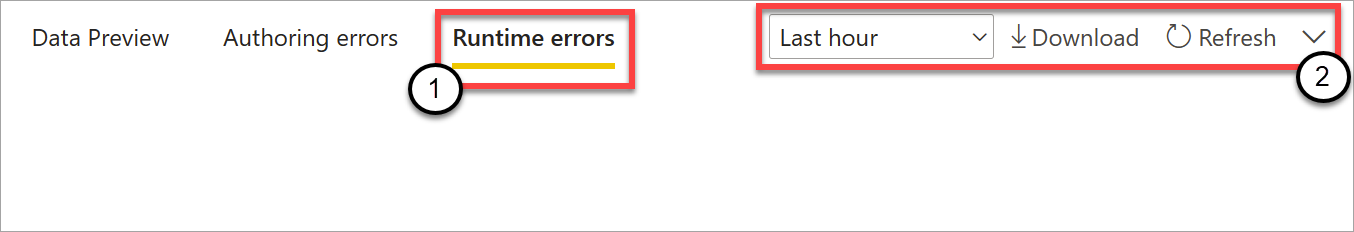
The last available tab in the preview is Runtime errors (1), as shown in the following screenshot. This tab lists any errors in the process of ingesting and analyzing the streaming dataflow after you start it. For example, you might get a runtime error if a message came in corrupted, and the dataflow couldn't ingest it and perform the defined transformations.
Because dataflows might run for a long period of time, this tab offers the option to filter by time span and to download the list of errors and refresh it if needed (2).
Modify settings for streaming dataflows
As with regular dataflows, settings for streaming dataflows can be modified depending on the needs of owners and authors. The following settings are unique to streaming dataflows. For the rest of the settings, because of the shared infrastructure between the two types of dataflows, you can assume that the use is the same.
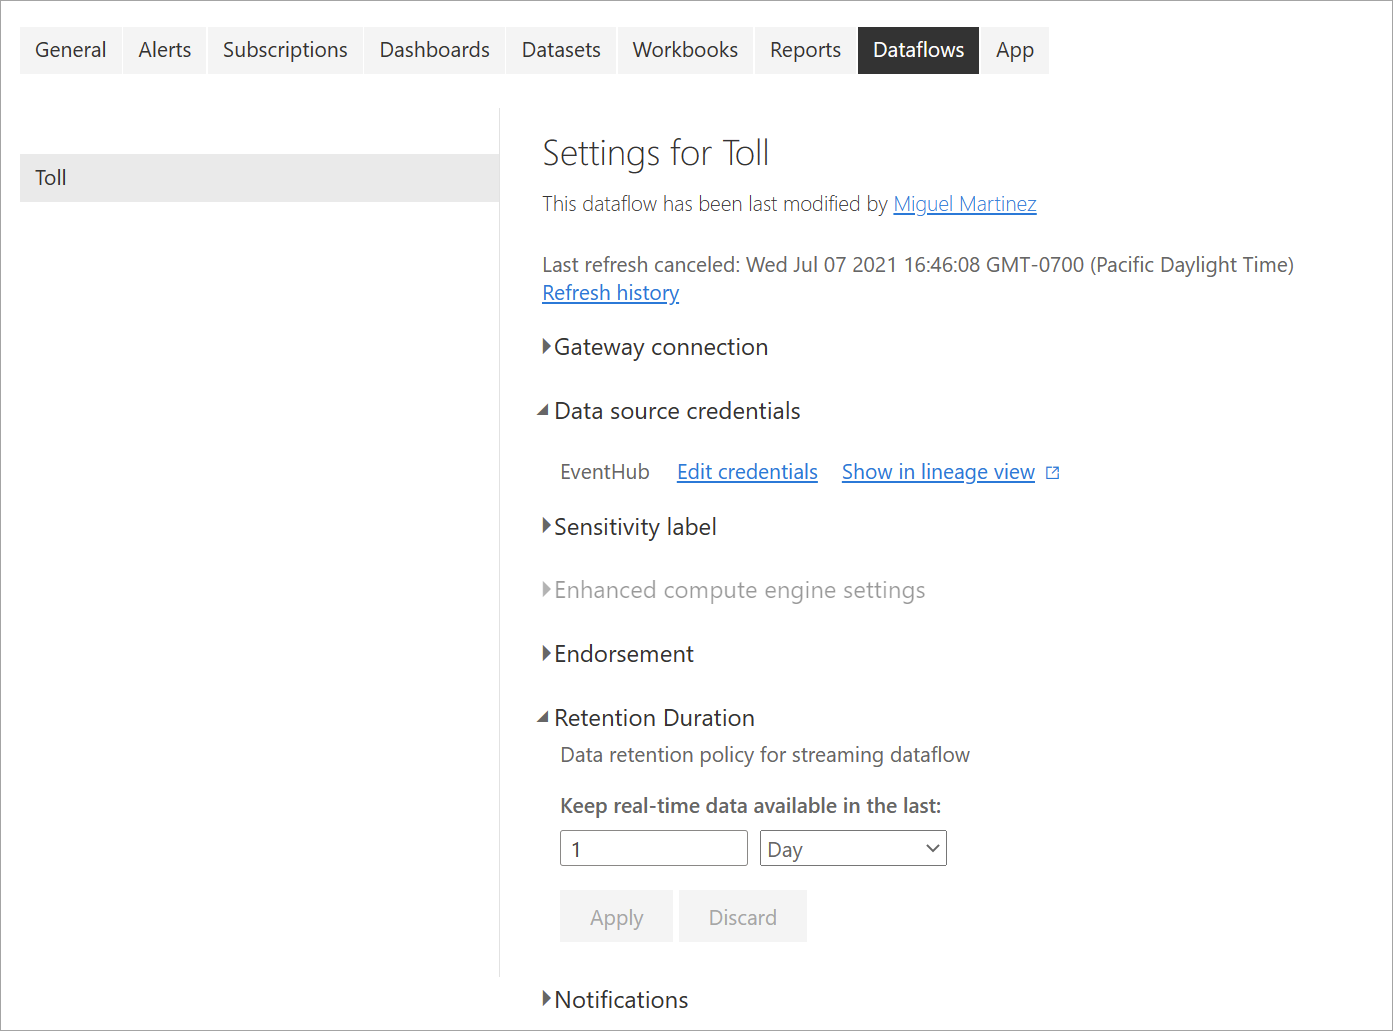
Refresh history: Because streaming dataflows run continuously, the refresh history shows only information about when the dataflow starts, when it's canceled, or when it fails (with details and error codes when applicable). This information is similar to what appears for regular dataflows. You can use this information to troubleshoot issues or to provide Power BI support with requested details.
Data source credentials: This setting shows the inputs that have been configured for the specific streaming dataflow.
Enhanced compute engine settings: Streaming dataflows need the enhanced compute engine to provide real-time visuals, so this setting is turned on by default and can't be changed.
Retention duration: This setting is specific to streaming dataflows. Here you can define how long you want to keep real-time data to visualize in reports. Historical data is saved by default in Azure Blob Storage. This setting is specific to the real-time side of your data (hot storage). The minimum value is 1 day or 24 hours.
Important
The amount of hot data stored by this retention duration directly influences the performance of your real-time visuals when you're creating reports on top of this data. The more retention you have here, the more your real-time visuals in reports can be affected by low performance. If you need to perform historical analysis, you should use the cold storage provided for streaming dataflows.
Run and edit a streaming dataflow
After you save and configure your streaming dataflow, everything is ready for you to run it. You can then start ingesting data into Power BI with the streaming analytics logic that you've defined.
Run your streaming dataflow
To start your streaming dataflow, first save your dataflow and go to the workspace where you created it. Hover over the streaming dataflow and select the play button that appears. A pop-up message tells you that the streaming dataflow is being started.
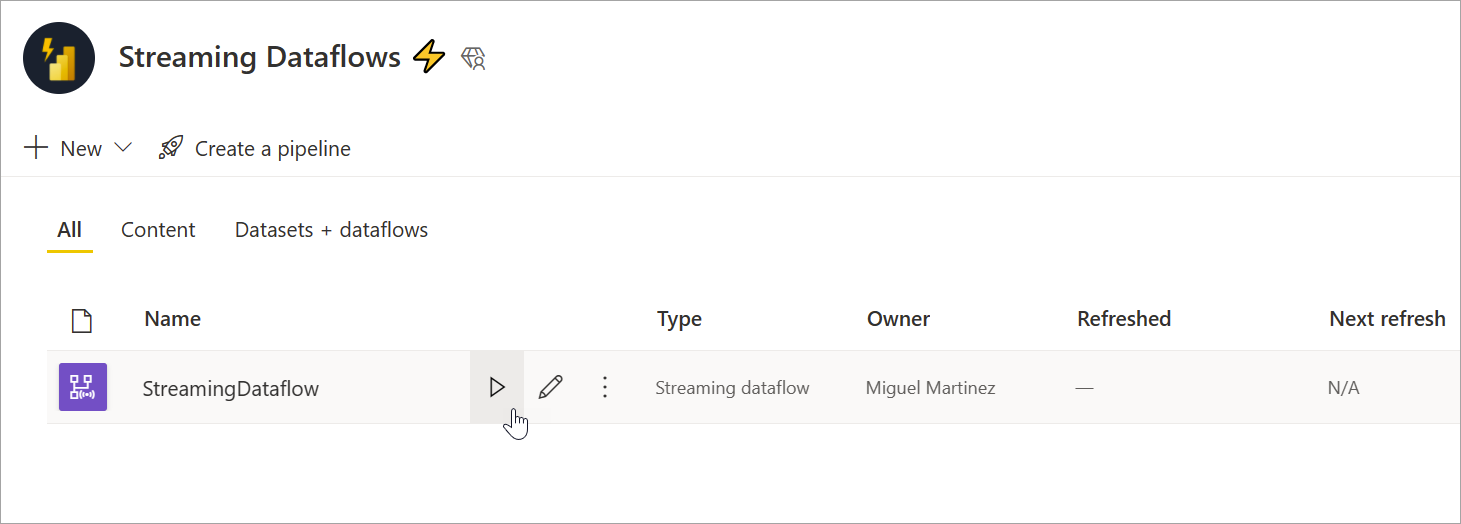
Note
It might take up to five minutes for data to start being ingested and for you to see data coming in to create reports and dashboards in Power BI Desktop.
Edit your streaming dataflow
While a streaming dataflow is running, it can't be edited. But you can go into a streaming dataflow that's in a running state and see the analytics logic that the dataflow is built on.
When you go into a running streaming dataflow, all edit options are disabled and a message is displayed: "The dataflow can't be edited while it's running. Stop the dataflow if you wish to continue." The data preview is disabled too.
To edit your streaming dataflow, you have to stop it. A stopped dataflow results in missing data.
The only experience available while a streaming dataflow runs is the Runtime errors tab, where you can monitor the behavior of your dataflow for any dropped messages and similar situations.

Consider data storage when editing your dataflow
When you're editing a dataflow, you need to account for other considerations. Similar to any changes in a schema for regular dataflows, if you make changes to an output table, you lose data that has already been pushed and saved to Power BI. The interface provides clear information about the consequences of any of these changes in your streaming dataflow, along with choices for changes that you make before saving.
This experience is better shown with an example. The following screenshot shows the message you get when you add a column to one table, change the name for a second table, and leave a third table the same as it was before.

In this example, the data already saved in both tables that had schema and name changes is deleted if you save the changes. For the table that stayed the same, you get the option to delete any old data and start from scratch, or save it for later analysis together with new data that comes in.
Keep these nuances in mind when editing your streaming dataflow, especially if you need historical data available later for further analysis.
Consume a streaming dataflow
After your streaming dataflow is running, you're ready to start creating content on top of your streaming data. There are no structural changes compared to what you have to do to create reports that are updated in real time. There are some nuances and updates to consider so that you can take advantage of this new type of data preparation for streaming data.
Set up data storage
As we mentioned before, streaming dataflows save data in the following two locations. The use of these sources depends on what type of analysis you're trying to do.
- Hot storage (real-time analysis): As data comes into Power BI from streaming dataflows, data is stored in a hot location for you to access with real-time visuals. How much data is saved in this storage depends on the value that you defined for Retention duration in the streaming dataflow settings. The default (and minimum) is 24 hours.
- Cold storage (historical analysis): Any time period that doesn't fall in the period that you defined for Retention duration is saved in cold storage (blobs) in Power BI for you to consume if needed.
Note
There is overlap between these two data storage locations. If you need to use both locations in conjunction (for example, day-over-day percentage change), you might have to deduplicate your records. It depends on the time intelligence calculations that you're making and the retention policy.
Connect to streaming dataflows from Power BI Desktop
Power BI Desktop offers a connector called Dataflows for you to use. As part of this connector for streaming dataflows, you’ll see two tables that match the data storage previously described.
To connect to your data for streaming dataflows:
Go to Get Data, select Power Platform, and then choose the Dataflows connector.
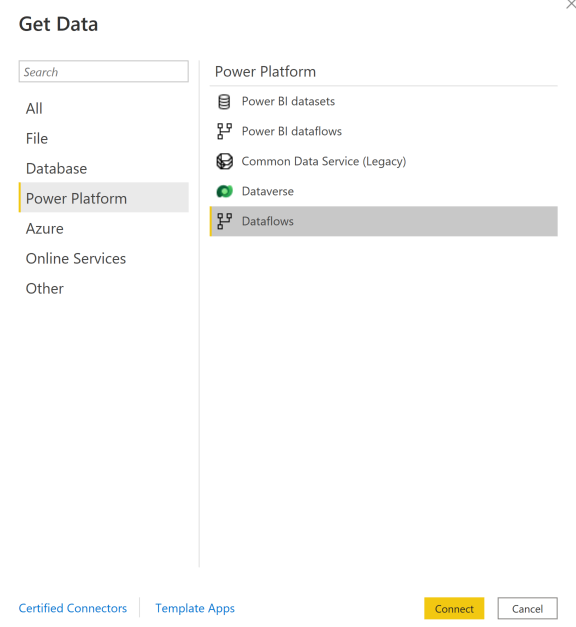
Sign in with your Power BI credentials.
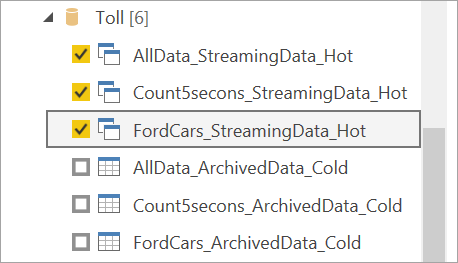
Select workspaces. Look for the one that contains your streaming dataflow and select that dataflow. (In this example, the streaming dataflow is called Toll.)
Notice that all your output tables appear twice: one for streaming data (hot) and one for archived data (cold). You can differentiate them by the labels added after the table names and by the icons.
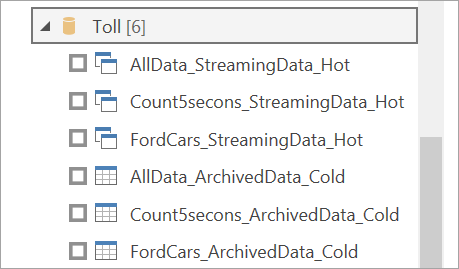
Connect to the streaming data. The archived data case is the same, only available in import mode. Select the tables that include the labels Streaming and Hot, and then select Load.
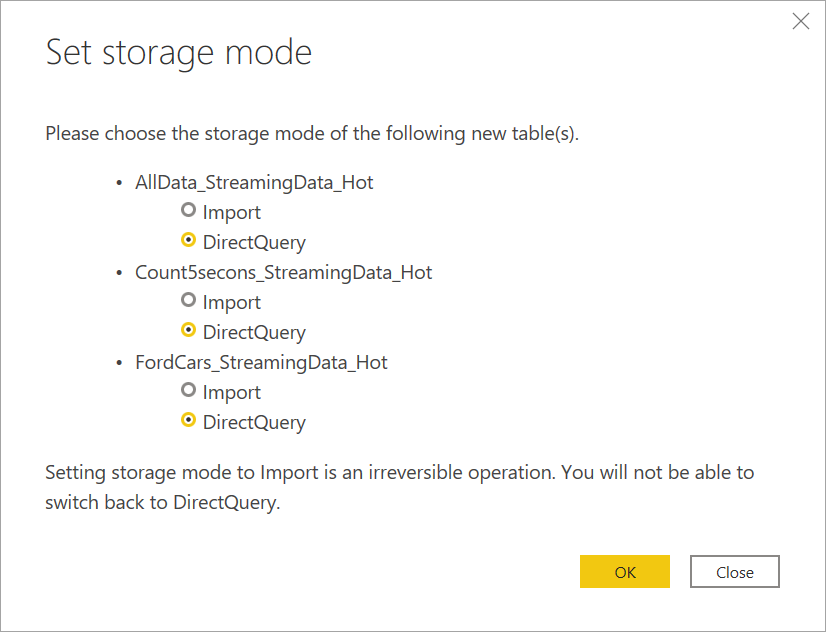
When you're asked to choose a storage mode, select DirectQuery if your goal is to create real-time visuals.
Now you can create visuals, measures, and more, by using the features available in Power BI Desktop.
Note
The regular Power BI dataflow connector is still available and will work with streaming dataflows with two caveats:
- It only allows you to connect to hot storage.
- The data preview in the connector doesn’t work with streaming dataflows.
Turn on automatic page refresh for real-time visuals
After your report is ready and you've added all the content that you want to share, the only step left is to make sure your visuals are updated in real time. You can use a feature called automatic page refresh. This feature allows you to refresh visuals from a DirectQuery source as often as one second.
For more information about the feature, see Automatic page refresh in Power BI. That article includes information about how to use it, how to set it up, and how to contact your admin if you're having trouble. The following are the basics on how to set it up:
Go to the report page where you want the visuals to be updated in real time.
Clear any visual on the page. If possible, select the background of the page.
Go to the format pane (1) and turn on Page refresh (2).
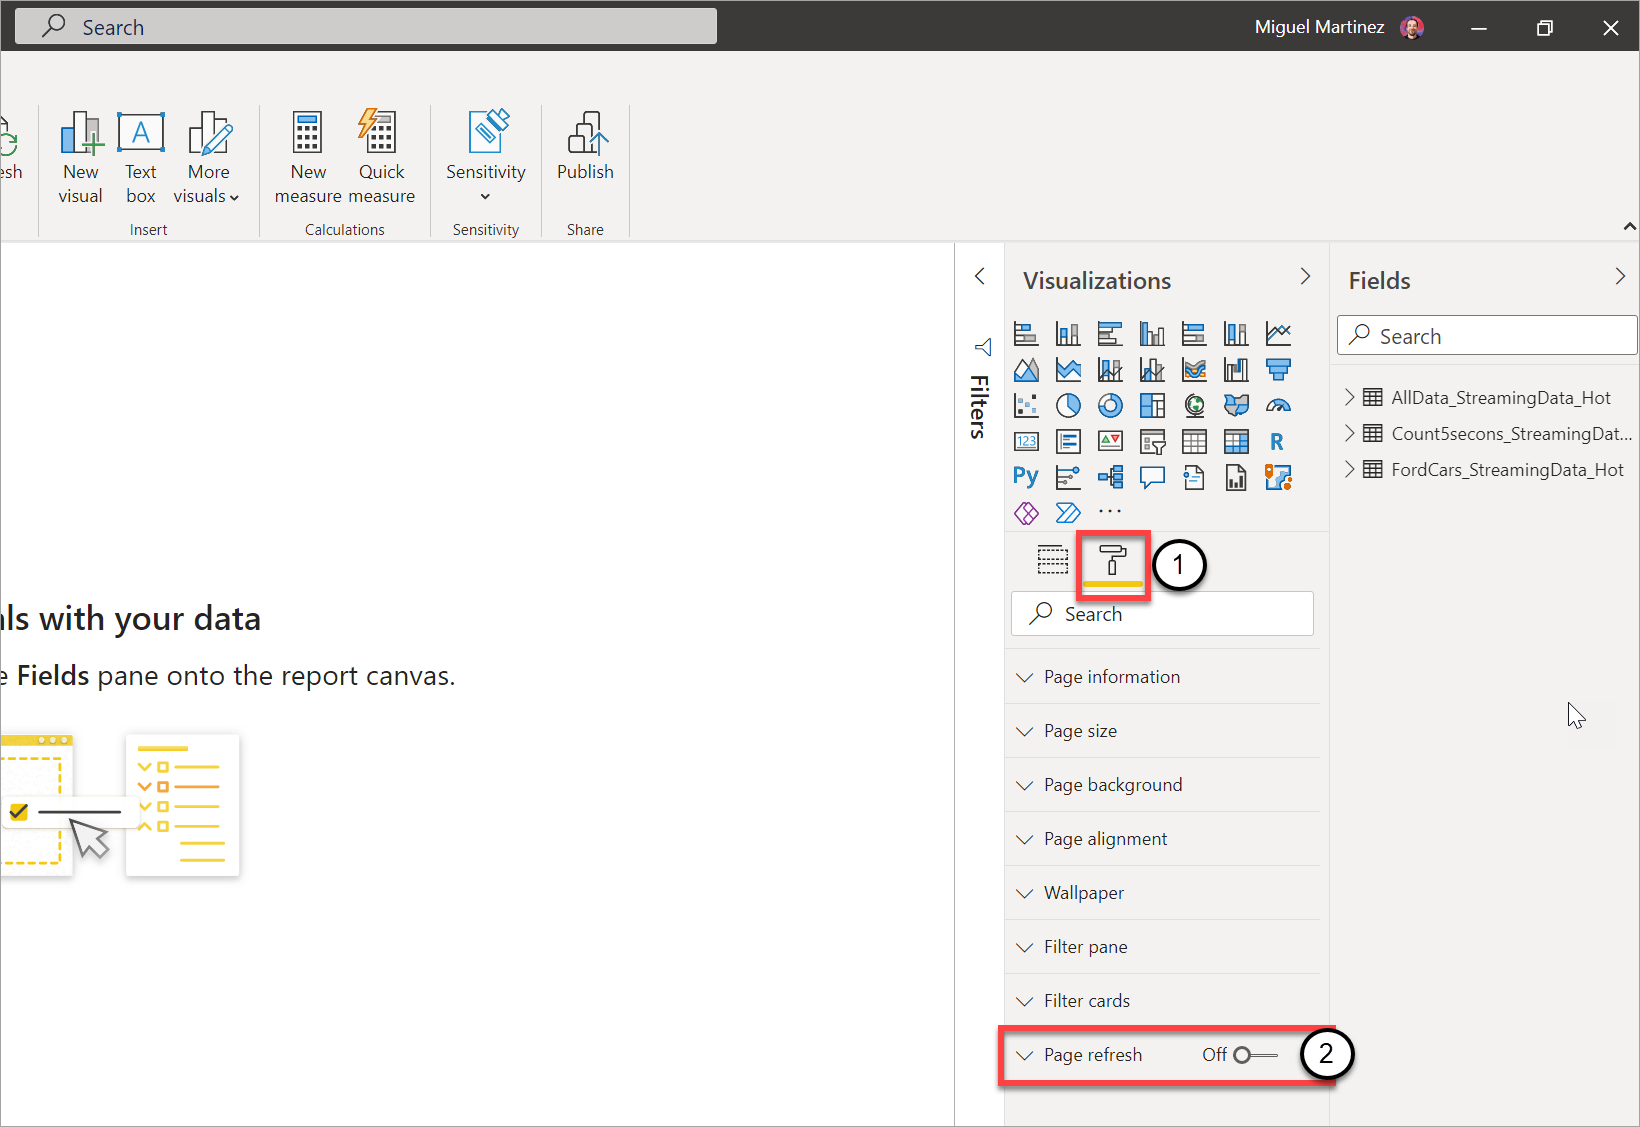
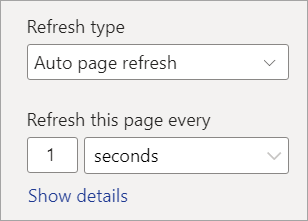
Set up your desired frequency (up to every second if your admin has allowed it).
To share a real-time report, first publish back to the Power BI service. Then you can set up your dataflow credentials for the semantic model and share.
Tip
If your report isn't updated as fast as you need it to be or in real time, check the documentation for automatic page refresh. Follow the FAQs and troubleshooting instructions to figure out why this problem might be happening.
Considerations and limitations
General limitations
- A Power BI Premium subscription (capacity or PPU) is required for creating and running streaming dataflows.
- Only one type of dataflow is allowed per workspace.
- Linking regular and streaming dataflows isn't possible.
- Capacities smaller than A3 don't allow the use of streaming dataflows.
- If dataflows or the enhanced calculation engine isn't enabled in a tenant, you can't create or run streaming dataflows.
- Workspaces connected to a storage account aren't supported.
- Each streaming dataflow can provide up to 1 MB per second of throughput.
Availability
The preview of streaming dataflows isn't available in the following regions:
- Central India
- Germany North
- Norway East
- Norway West
- UAE Central
- South Africa North
- South Africa West
- Switzerland North
- Switzerland West
- Brazil Southeast
Licensing
The number of streaming dataflows allowed per tenant depends on the license being used:
For regular capacities, use the following formula to calculate the maximum number of streaming dataflows allowed in a capacity:
Maximum number of streaming dataflows per capacity = vCores in the capacity x 5
For example, P1 has 8 vCores: 8 * 5 = 40 streaming dataflows.
For Premium Per User, one streaming dataflow is allowed per user. If another user wants to consume a streaming dataflow in a PPU workspace, they need a PPU license too.
Dataflow authoring
When you're authoring streaming dataflows, be mindful of the following considerations:
- The owner of a streaming dataflows can only make modifications, and they can only make modifications if the dataflow isn't running.
- Streaming dataflows aren't available in My Workspace.
Connect from Power BI Desktop
You can access cold storage only by using the Dataflows connector available starting in the July 2021 Power BI Desktop update. The previous Power BI dataflow connector allows only connections to streaming data (hot) storage. The connector's data preview doesn't work.
Related content
This article provided an overview of self-service streaming data preparation by using streaming dataflows. The following articles provide information about how to test this capability and how to use other streaming data features in Power BI: