Note
Access to this page requires authorization. You can try signing in or changing directories.
Access to this page requires authorization. You can try changing directories.
You can discover data through the data hub, and create reusable and autogenerated semantic models to create reports in various ways in Power BI. This article describes the various ways you can discover datamarts.
Important
The Power BI datamarts feature is being retired in October 2025. To avoid losing your data and breaking reports built on top of datamarts, you should upgrade your Power BI Datamart to a Warehouse. For more information, see Unify Datamart with Fabric Data Warehouse.
Discover datamarts in the data hub
You can see datamarts and their associated autogenerated semantic model in the data hub, which makes it easy to find, explore, and use the data.
In the data hub, when you select a datamart, you're taken to its information page where you can see the datamart’s metadata, supported actions, lineage, and impact analysis along with related reports on that datamart.
The autogenerated semantic model from a datamart behaves the same as other semantic models in Power BI. For more information, see data discovery using the data hub
Datamart details and related reports
For more information about a datamart, to explore reports, to view lineage, or to create a new report based on the semantic model, select a datamart from the recommended datamarts or from datamarts in the data list.
A page displays the information about the datamart, provides a button to create a new report, share datamart, pull data into Excel or view lineage. Related reports for the selected datamart are also displayed, if any exist. You can also navigate to the datamart editor, its settings, or manage permissions.
The page also shows the workspace where the datamart is located, its endorsement status, its last refresh time, and any sensitivity settings that are applied. It also displays the datamart's SQL endpoint connection string and the datamart's description.
The following image shows the datamarts information page.

You can view the lineage of the datamart by selecting Lineage > Open lineage from the ribbon menu. The window that appears displays the end-to-end lineage view describing the flow of data from the data source to the datamart, the underlying autogenerated semantic model, and all downstream items such as reports, dashboards, or apps.
The following image shows the lineage of a datamart.

To view any dependent items of the selected datamart, select the Impact analysis menu, which is displayed along the right side of the screen.

Data hub in Power BI Desktop
The data hub in Power BI Desktop lets you discover datamarts and semantic models. Once the datamart filter is selected, the list shows the datamarts to which you have access.
The following image shows how to select datamarts from the data hub Home ribbon menu in Power BI Desktop.
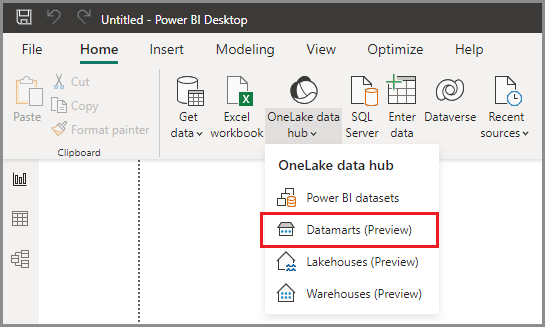
The data hub appears in a window within Power BI Desktop, as the following screen shows.

Selecting a datamart from the list enables the Connect button in the window. Selecting Connect with a datamart selected loads the datamart's underlying and autogenerated semantic model, from which you can begin to build reports. By selecting Connect to SQL endpoint, you're making a live connection to datamart’s SQL connection string to read data and build reports.

Related content
This article provided information about creating reports using datamarts.
The following articles provide more information about datamarts and Power BI:
- Introduction to datamarts
- Sharing datamarts and managing permissions
- Understand datamarts
- Get started with datamarts
- Analyzing datamarts
- Access control in datamarts
- Datamart administration
For more information about dataflows and transforming data, see the following articles: