Note
Access to this page requires authorization. You can try signing in or changing directories.
Access to this page requires authorization. You can try changing directories.
The lists in the Field pane, called the Data pane in current releases of Power BI Desktop, are being unified across Model view, Table view, and Report view in Power BI Desktop. Unifying these views creates consistency for functionality and the user interface (UI) across views, and addresses customer feedback.
The following changes across the views are:
- Iconography
- Search functionality
- Context menu items
- Similar drag-drop behavior
- Tooltips
- Accessibility improvements
The intent is to improve Power BI Desktop usability. The changes should be minimal on your typical data workflow. To view the Fields pane (or the Data pane in current releases of Power BI Desktop), add data to your model and select the pane from the area to the right of the canvas.
Field list changes
The following tables show the Field list updates.
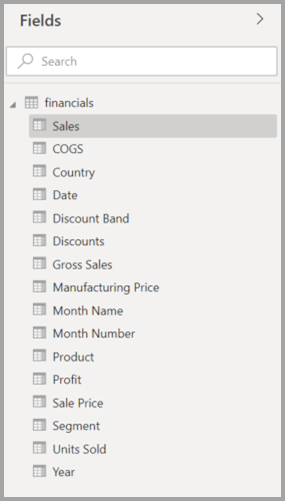
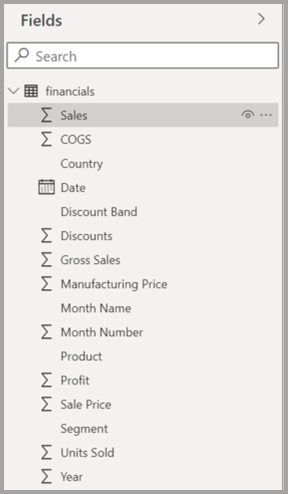
| Original Field list (Model view) | New Field list (Model view) |
|---|---|
| Original | New |
| Icons and UI | |
|
|
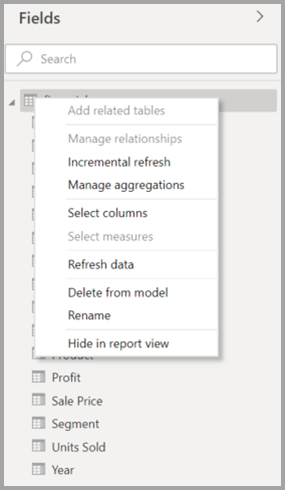
| Context menu - Field | |
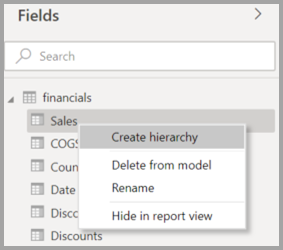
|
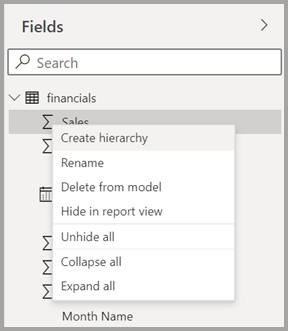
|
| Context menu - Table | |
|
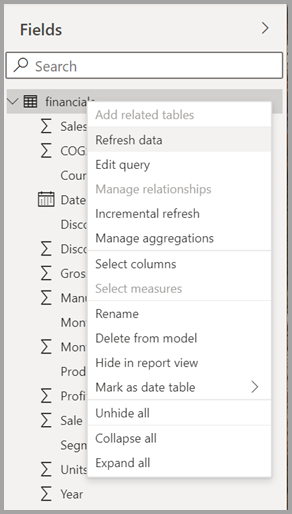
|
| Tooltips | |
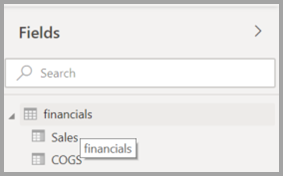
|
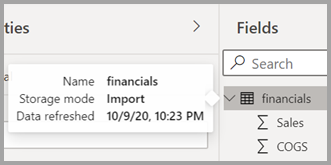
|
Field list icons
There are new Field list icons as well. The following table shows the original icons and their new equivalent, and provides a brief description of each.
| Original icon | New icon | Description |
|---|---|---|

|

|
Folder in the Fields list. |

|

|
Numeric field: Numeric fields are aggregates that can be summed or averaged, for example. Aggregates are imported with the data and defined in the data model that your report is based on. For more information, see Work with aggregates (sum, average, and so on) in Power BI. |

|

|
Calculated column with a non-numeric data type: A new non-numeric column you create with a Data Analysis Expressions (DAX) formula that defines the column’s values. For more information, see Create calculated columns in Power BI Desktop. |

|

|
Numeric calculated column: A new column you create with a DAX formula that defines the column’s values. For more information, see Create calculated columns in Power BI Desktop. |

|

|
Measure: A measure has its own hard-coded formula. Report viewers can’t change the calculation, for example, if it’s a sum, it can only be a sum. The values aren't stored in a column. They're calculated on the fly, depending solely on their location in a visual. For more information, see Create measures for data analysis in Power BI Desktop. |

|

|
Measure group. |

|

|
KPI: A visual cue that communicates the amount of progress made toward a measurable goal. For more information, see Create key performance indicator (KPI) visualizations. |

|

|
Hierarchy of fields: Select the arrow to see the fields that make up the hierarchy. For more information, see Creating and working with hierarchies in Power BI (3-11g) on YouTube. |

|

|
Geo data: These location fields can be used to create map visualizations. |

|

|
Identity field: Fields with this icon are unique fields, set to show all values, even if they have duplicates. For example, your data might have records for two different people named 'Robin Smith', and each is treated as unique. They aren't summed. |

|

|
Parameter: Set parameters to make parts of your reports and data models (such as a query filter, a data source reference, a measure definition, etc.) depend on one or more parameter values. For more information, see Deep Dive into Query Parameters and Power BI Templates. |

|

|
Calendar date field with a built-in date table. |

|

|
Calculated table: A table created with a DAX formula based on data already loaded into the model. Calculated tables are best used for intermediate calculations and you want to store as part of the model. |

|

|
Warning: A calculated field with an error. For example, the syntax of the DAX expression might be incorrect. |

|

|
Group: Values in this column are based on grouping values from another column by using the groups and bins feature. For more information, see Use grouping and binning in Power BI Desktop. |
| no original icon | 
|
Change detection measure: When you configure a page for automatic page refresh, you can configure a change detection measure that is queried to determine if the rest of a page’s visuals should be updated. |
Related content
You might also be interested in the following articles: