When Power BI Desktop creates visuals it aggregates your data into chunks, or groups, based on values it finds in the underlying data. Often that's fine, but there might be times when you want to refine how those chunks are presented.
For example, you might want to place three categories of products in one larger category or group, or you might want to see sales figures put into bin sizes of 1,000,000 dollars instead of chunks of 923,983-dollar sizes.
In Power BI Desktop, you can group data points to help you more clearly view, analyze, and explore data and trends in your visuals. You can also define the bin size to put values into equally sized groups that better enable you to visualize data in meaningful ways. This action is called binning.
Using grouping
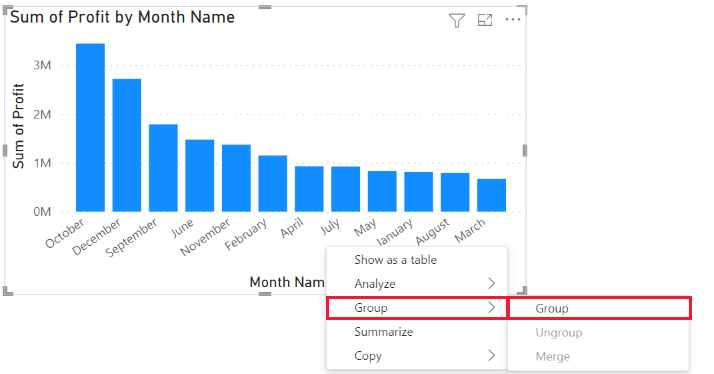
To use grouping, select two or more elements on a visual by using Ctrl+Select. Then right-click one of the selected elements, scroll to Group, and choose Group from the context menu.
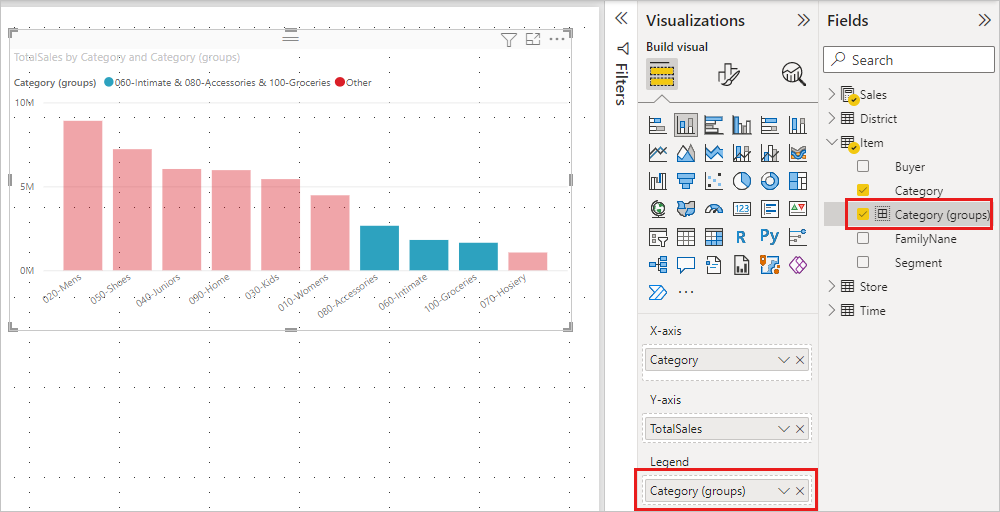
Once it's created, the group is added to the Legend well for the visual with (groups) appended. The group also appears in the Fields list.
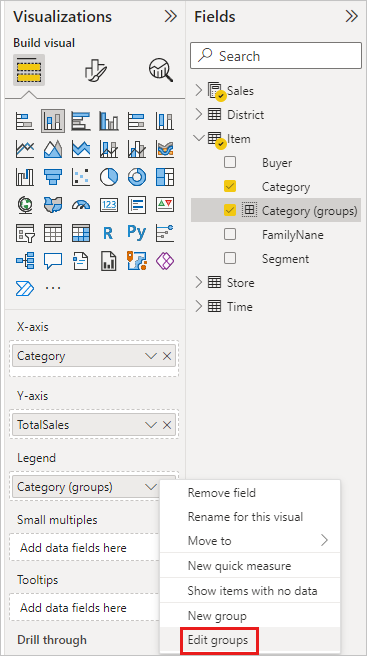
Once you have a group, you can edit its members.
Right-click the group from the Legend well or from the Fields list, and then choose Edit groups.
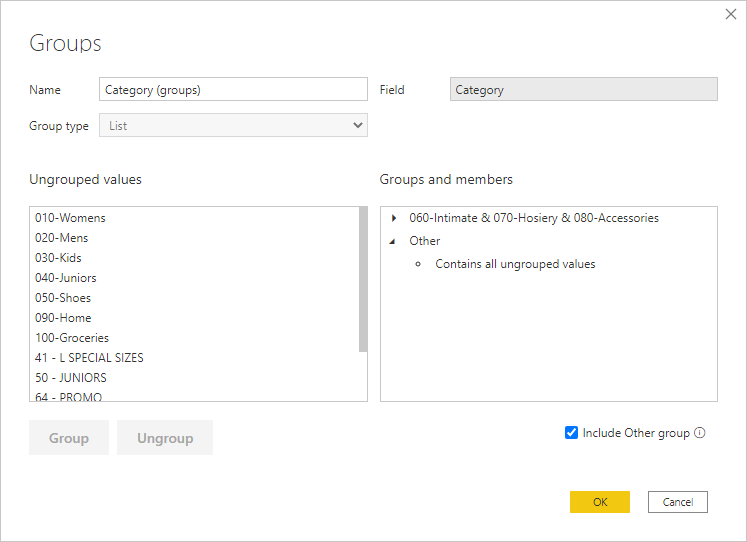
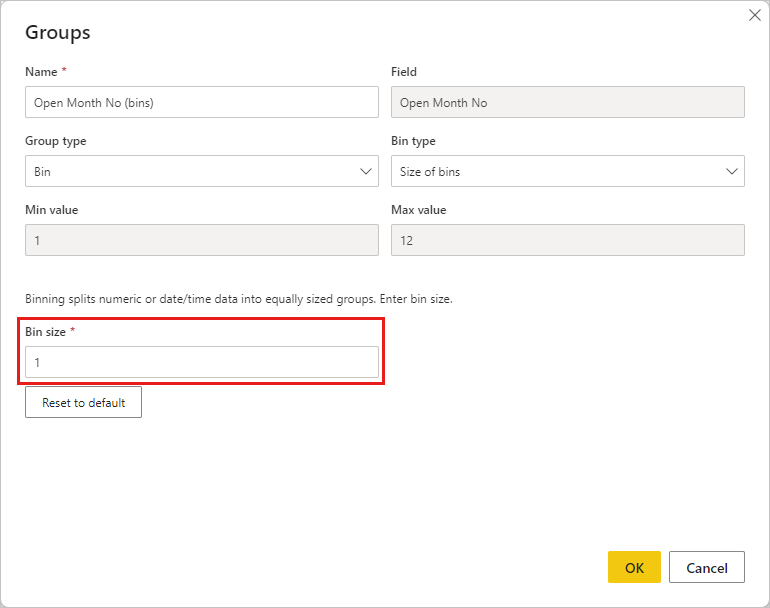
In the Groups dialog box, you can create new groups or modify existing groups.
To rename the group, type a new name in the Name box. You can also rename a group by double-clicking the group in the Legends or Fields list and entering a new name.
To add members, select items from the Ungrouped values list and then select Group.
To create a new group, select two or more items from the Ungrouped values and then select Group.
To remove items from the group, select them from Groups and members and then select Ungroup. You can also move ungrouped values into the Other group or leave them ungrouped.
When you're done editing the group, select OK.
Note
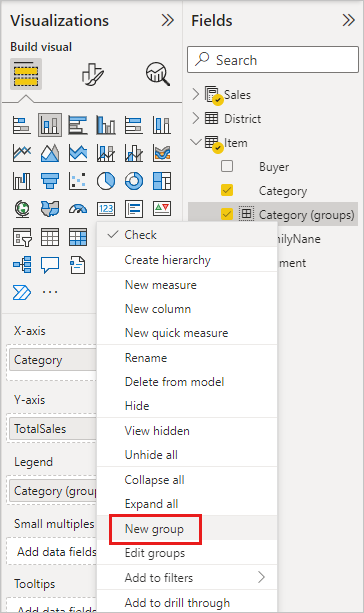
You can create groups for any field in the Fields well, without having to select multiple items from an existing visual. Just right-click the field and select New group from the menu that appears.
Use binning
Use binning to right-size the data that Power BI Desktop displays. You can set the bin size for numerical and time fields in Power BI Desktop. You can make bins for calculated columns but not for measures.
To apply a bin size, right-click a Field and choose New group.
From the Groups dialog box, set the Bin size to the size you want.
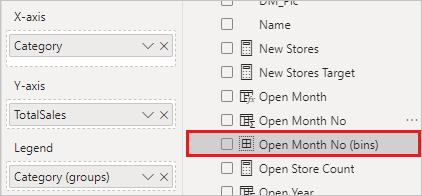
Select OK. A new field appears in the Fields pane with (bins) appended. You can then drag that field onto the canvas to use the bin size in a visual.
To see binning in action, take a look at this video.
And that's all there is to using grouping and binning to ensure the visuals in your reports show your data just the way you want them to.
Related content
You might also be interested in the following articles:
Demonstrate methods and best practices that align with business and technical requirements for modeling, visualizing, and analyzing data with Microsoft Power BI.
Learn how to apply customized conditional formatting to tables and matrixes in Power BI, including color gradients, data bars, KPI icons, and web links.