Note
Access to this page requires authorization. You can try signing in or changing directories.
Access to this page requires authorization. You can try changing directories.
Learn how to use the Power Platform admin center to monitor the traffic to the websites in your tenant.
Access the analytics dashboard
To access the analytics dashboard, you should have one of the following roles:
- Dynamics 365 administrator
- Power Platform administrator
- System administrator (You can only see environments for which you're a system administrator.)
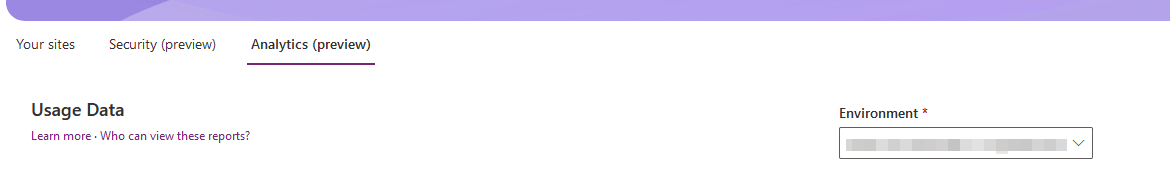
View traffic analytics for all websites in a tenant
The steps to access traffic analytics differ slightly depending on whether you're using the new admin center or the classic admin center:
- Sign in to the Power Platform admin center.
- On the left pane, select Resources, > Power Pages sites > Analytics.
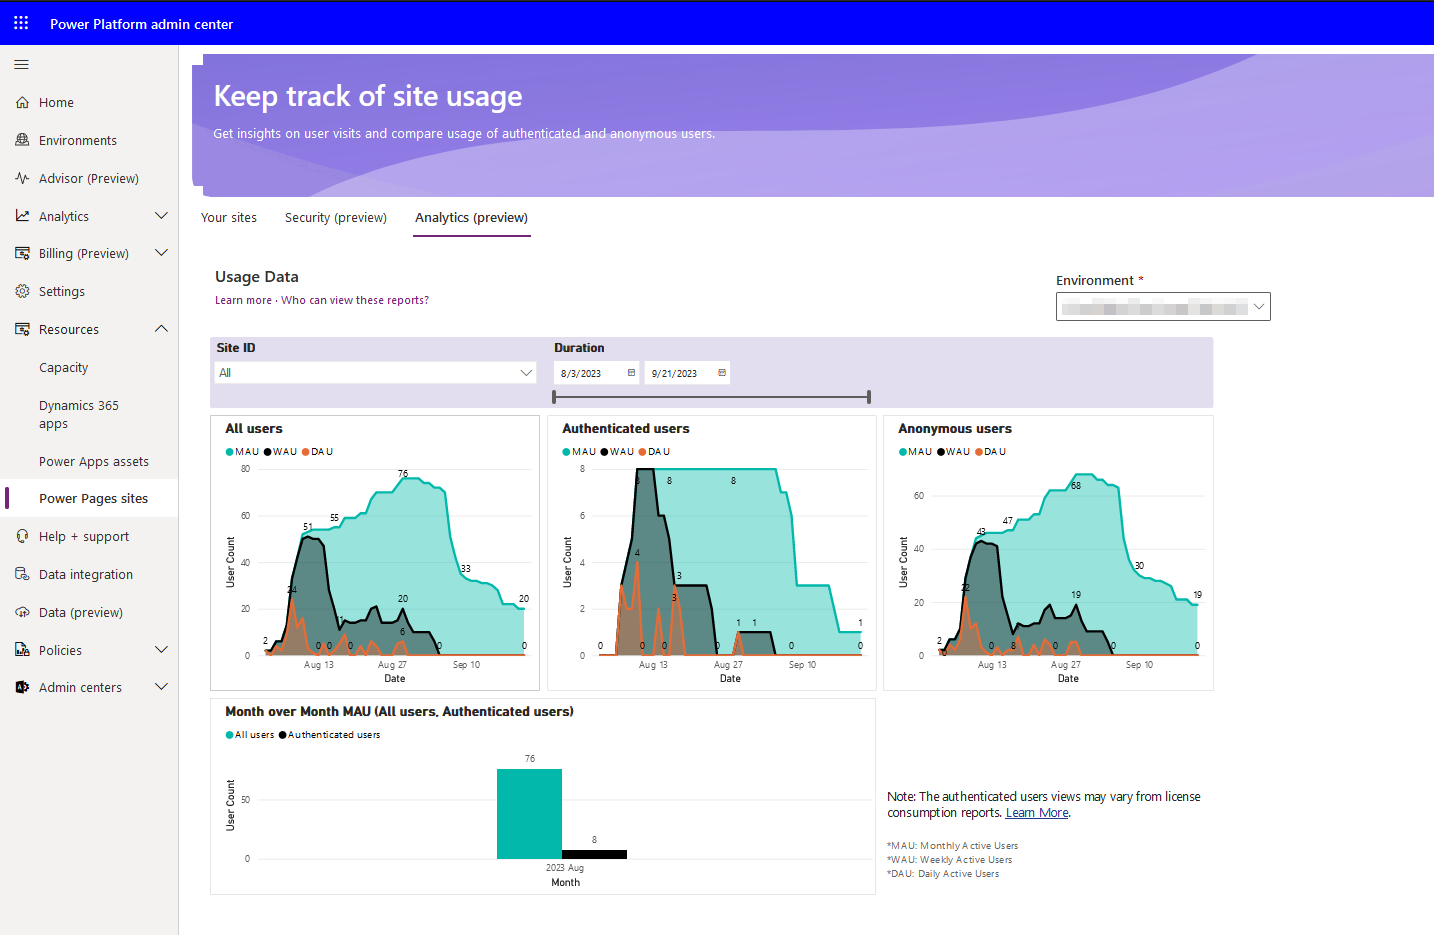
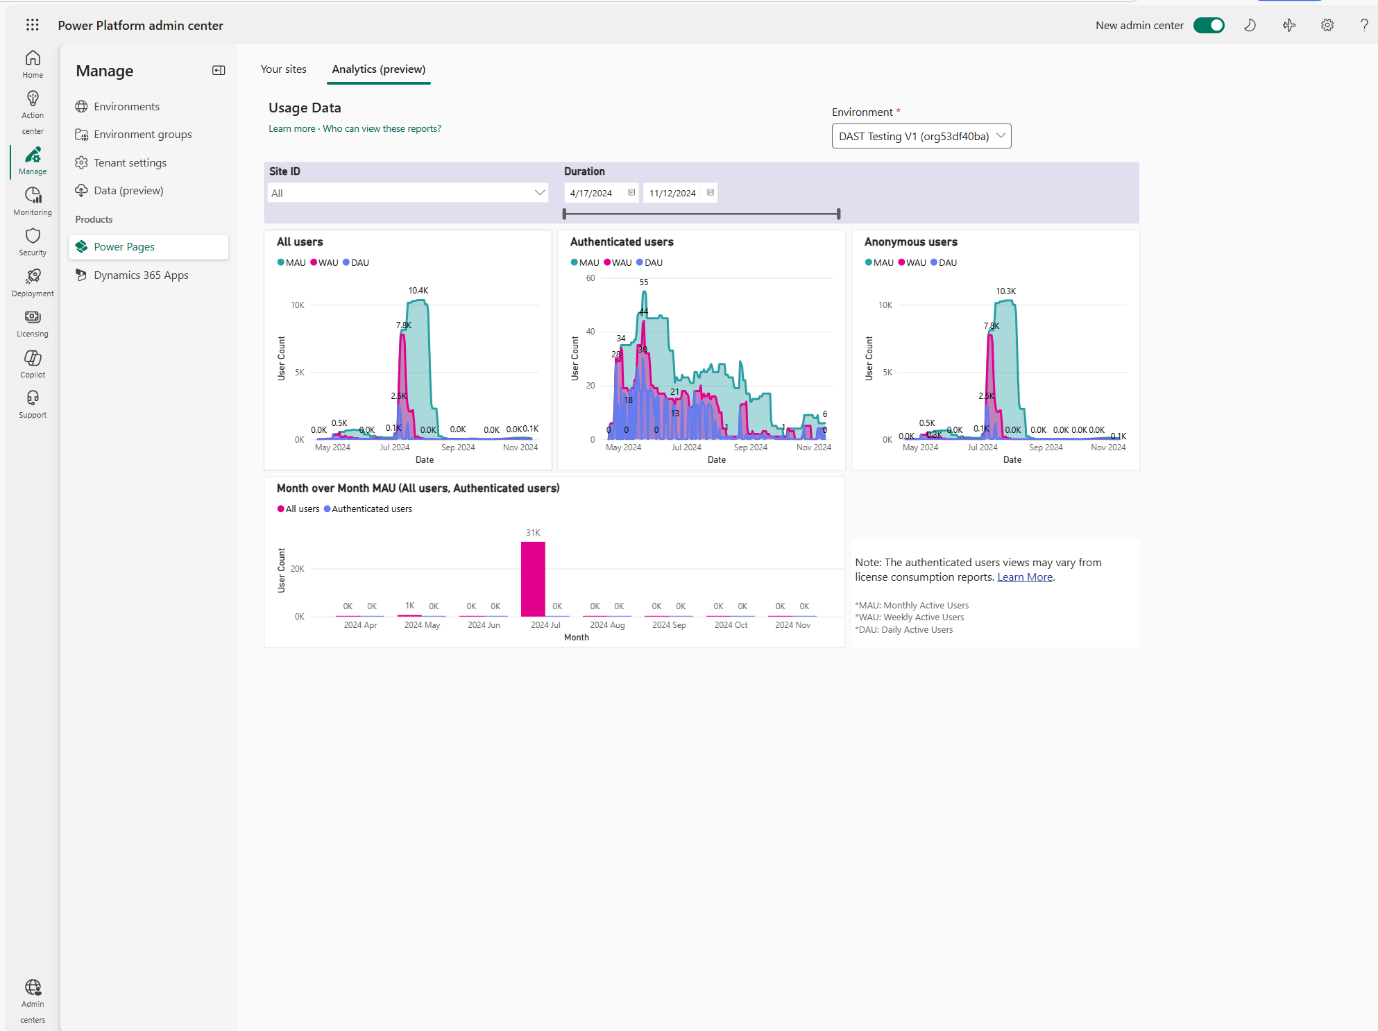
From here you can view the traffic that your websites are receiving: DAU (Daily Active Users), WAU (Weekly Active Users), and MAU (Monthly Active Users).
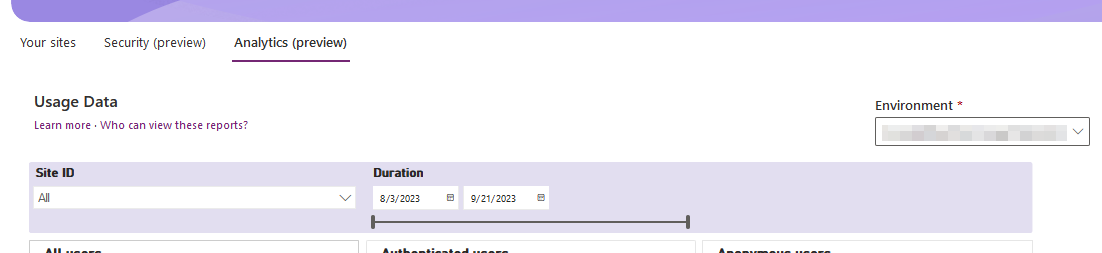
Each chart displays the DAU, WAU, and MAU for all the sites in the selected environment. Select your environment in the upper-right corner of the page.
To view the traffic for a specific site, select it in the Site ID list. To view the traffic for multiple sites, select Ctrl while you select the sites in the list.
Note
Currently, only Site ID is supported for filtering. The Site ID can be found under the Your Sites tab. Traffic reports are available only for public sites. Private sites aren't included in these reports. More information: Difference between a private site and a public site
Considerations
- The charts show DAU, WAU, and MAU numbers for the following categories of users:
- Authenticated Users shows the unique authenticated users who accessed the websites.
- Anonymous Users shows the unique anonymous users who accessed the websites.
- All Users shows the unique users who accessed the websites (either by authentication or anonymously).
- All the traffic numbers (DAU, WAU, and MAU) shown are with the intent of understanding the visits to the websites.
- The authenticated user counts may vary slightly from license consumption reports. For instance, in cases where the authenticated user already has a Power Apps license, the visit isn't counted in license consumption. However, it's counted in the total authenticated users visiting the website.
- The usage numbers can be under-reported for the first few days after enabling the feature. For example, the monthly active users are accurate after the feature has been live for 30 days and the WAU is accurate after the feature has been live for 7 days.
- The dashboards for daily, weekly, and monthly active users (DAU, WAU, MAU) only show data for the last 30 days.
| Metric | Definition | How it’s Calculated / Displayed |
|---|---|---|
| MAU (Monthly Active Users) | The number of distinct users active in the past 30 days (rolling window). | For each date on the X-axis, MAU shows the number of unique users who access the site in the preceding 30 days. |
| WAU (Weekly Active Users) | The number of distinct users active in the past seven days (rolling window). | For each date, WAU counts unique users who accessed the site in the preceding seven days. |
| DAU (Daily Active Users) | The number of distinct users active on that date. | For each date, DAU counts unique users on that single day. |
| MoM (Month-over-Month Authenticated Users) | The number of distinct authenticated users in a given calendar month. | This is an aggregated calendar month view (for example, July 1–31), not a rolling window. |