Quickstart: Get started with Azure Video Analyzer
![]()
Alternatively, check out topics under Create video applications in the service.
Note
Azure Video Analyzer has been retired and is no longer available.
Azure Video Analyzer for Media is not affected by this retirement. It is now rebranded to Azure Video Indexer. Click here to read more.
This quickstart walks you through the steps to get started with Azure Video Analyzer. It uses an Azure VM as an IoT Edge device and a simulated live video stream.
After completing the setup steps, you'll be able to run the simulated live video stream through a pipeline that detects and reports any motion in that stream. The following diagram graphically represents that pipeline.

Prerequisites
An Azure account that has an active subscription. Create an account for free if you don't already have one.
Note
You will need an Azure subscription where you have access to both Contributor role, and User Access Administrator role. If you do not have the right permissions, please reach out to your account administrator to grant you those permissions.
Visual Studio Code, with the following extensions:
Tip
When you're installing the Azure IoT Tools extension, you might be prompted to install Docker. Feel free to ignore the prompt.
Set up Azure resources
The deployment process will take about 20 minutes. Upon completion, you will have certain Azure resources deployed in the Azure subscription, including:
- Video Analyzer account - This cloud service is used to register the Video Analyzer edge module, and for playing back recorded video and video analytics.
- Storage account - For storing recorded video and video analytics.
- Managed Identity - This is the user assigned managed identity used to manage access to the above storage account.
- Virtual machine - This is a virtual machine that will serve as your simulated edge device.
- IoT Hub - This acts as a central message hub for bi-directional communication between your IoT application, IoT Edge modules and the devices it manages.
Set up your development environment
Obtain your IoT Hub connection string
- In Azure portal, navigate to the IoT Hub you created as part of the above set up step
- Look for Shared access policies option in the left hand navigation, and click there.
- Click on the policy named iothubowner
- Copy the Primary connection string - it will look like
HostName=xxx.azure-devices.net;SharedAccessKeyName=iothubowner;SharedAccessKey=XXX
Connect to the IoT Hub
- Open Visual Studio Code, select View > Explorer. Or, select Ctrl+Shift+E.
- In the lower-left corner of the Explorer tab, select Azure IoT Hub.
- Select the More Options icon to see the context menu. Then select Set IoT Hub Connection String.
- When an input box appears, enter your IoT Hub connection string.
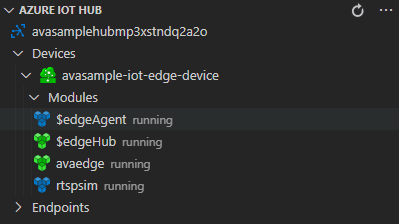
- In about 30 seconds, refresh Azure IoT Hub in the lower-left section. You should see the edge device
avasample-iot-edge-device, which should have the following modules deployed:- Video Analyzer edge module (module name avaedge)
- RTSP simulator (module name rtspsim)
Tip
If you have manually deployed Video Analyzer yourselves on an edge device (such as an ARM64 device), then you will see the module show up under that device, under the Azure IoT Hub. You can select that module, and follow the rest of the steps below.
Prepare to monitor the modules
When you use run this quickstart, events will be sent to the IoT Hub. To see these events, follow these steps:
In Visual Studio Code, open the Extensions tab (or press Ctrl+Shift+X) and search for Azure IoT Hub.
Right-click and select Extension Settings.
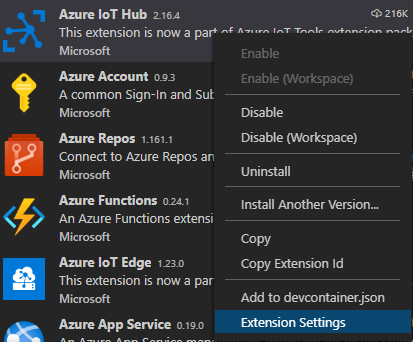
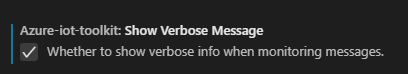
Search and enable "Show Verbose Message".
Open the Explorer pane in Visual Studio Code, and look for Azure IoT Hub in the lower-left corner.
Expand the Devices node.
Right-click on
avasample-iot-edge-device, and select Start Monitoring Built-in Event Endpoint.Note
You might be asked to provide Built-in endpoint information for the IoT Hub. To get that information, in Azure portal, navigate to your IoT Hub and look for Built-in endpoints option in the left navigation pane. Click there and look for the Event Hub-compatible endpoint under Event Hub compatible endpoint section. Copy and use the text in the box. The endpoint will look something like this:
Endpoint=sb://iothub-ns-xxx.servicebus.windows.net/;SharedAccessKeyName=iothubowner;SharedAccessKey=XXX;EntityPath=<IoT Hub name>
Use direct method calls
You can now analyze live video streams by invoking direct methods exposed by the Video Analyzer edge module. Read Video Analyzer direct methods to examine all the direct methods provided by the module. The schema for the direct methods can be found here.
Enumerate pipeline topologies
This step enumerates all the pipeline topologies in the module.
- Right-click on "avaedge" module and select Invoke Module Direct Method from the context menu.
- You will see an edit box pop in the top-middle of Visual Studio Code window. Enter
pipelineTopologyListin the edit box and press enter. - Next, copy, and paste the below JSON payload in the edit box and press enter.
{
    "@apiVersion" : "1.1"
}
Within a few seconds, you will see the following response in the OUTPUT window:
[DirectMethod] Invoking Direct Method [pipelineTopologyList] to [avasample-iot-edge-device/avaedge] ...
[DirectMethod] Response from [avasample-iot-edge-device/avaedge]:
{
  "status": 200,
  "payload": {
    "value": []
  }
}
The above response is expected, as no pipeline topologies have been created.
Set a pipeline topology
Using the same steps as above, you can invoke pipelineTopologySet to set a pipeline topology using the following JSON as the payload. You will be creating a pipeline topology named "MotionDetection".
{
    "@apiVersion": "1.1",
    "name": "MotionDetection",
    "properties": {
        "description": "Analyzing live video to detect motion and emit events",
        "parameters": [
            {
                "name": "rtspUrl",
                "type": "string",
                "description": "rtspUrl"
            },
            {
                "name": "rtspUserName",
                "type": "string",
                "description": "rtspUserName",
                "default": "dummyUserName"
            },
            {
                "name": "rtspPassword",
                "type": "string",
                "description": "rtspPassword",
                "default": "dummypw"
            }
        ],
        "sources": [
            {
                "@type": "#Microsoft.VideoAnalyzer.RtspSource",
                "name": "rtspSource",
                "transport": "tcp",
                "endpoint": {
                    "@type": "#Microsoft.VideoAnalyzer.UnsecuredEndpoint",
                    "credentials": {
                        "@type": "#Microsoft.VideoAnalyzer.UsernamePasswordCredentials",
                        "username": "${rtspUserName}",
                        "password": "${rtspPassword}"
                    },
                    "url": "${rtspUrl}"
                }
            }
        ],
        "processors": [
            {
                "@type": "#Microsoft.VideoAnalyzer.MotionDetectionProcessor",
                "sensitivity": "medium",
                "name": "motionDetection",
                "inputs": [
                    {
                        "nodeName": "rtspSource",
                        "outputSelectors": []
                    }
                ]
            }
        ],
        "sinks": [
            {
                "hubOutputName": "inferenceOutput",
                "@type": "#Microsoft.VideoAnalyzer.IotHubMessageSink",
                "name": "iotHubSink",
                "inputs": [
                    {
                        "nodeName": "motionDetection"
                    }
                ]
            }
        ]
    }
}
This JSON payload creates a topology that defines three parameters, where two of them have default values. The topology has one source node (RTSP source), one processor node (motion detection processor and one sink node (IoT Hub message sink). The visual representation of the topology is shown above.
Within a few seconds, you see the following response in the OUTPUT window.
{
  "status": 201,
  "payload": {
    "systemData": {
      "createdAt": "2021-03-21T18:16:46.491Z",
      "lastModifiedAt": "2021-03-21T18:16:46.491Z"
    },
    "name": "MotionDetection",
    "properties": {
      "description": "Analyzing live video to detect motion and emit events",
      "parameters": [
        {
          "name": "rtspPassword",
          "type": "string",
          "description": "rtspPassword",
          "default": "dummypw"
        },
        {
          "name": "rtspUrl",
          "type": "string",
          "description": "rtspUrl"
        },
        {
          "name": "rtspUserName",
          "type": "string",
          "description": "rtspUserName",
          "default": "dummyUserName"
        }
      ],
      "sources": [
        {
          "@type": "#Microsoft.VideoAnalyzer.RtspSource",
          "name": "rtspSource",
          "transport": "tcp",
          "endpoint": {
            "@type": "#Microsoft.VideoAnalyzer.UnsecuredEndpoint",
            "url": "${rtspUrl}",
            "credentials": {
              "@type": "#Microsoft.VideoAnalyzer.UsernamePasswordCredentials",
              "username": "${rtspUserName}",
              "password": "${rtspPassword}"
            }
          }
        }
      ],
      "processors": [
        {
          "@type": "#Microsoft.VideoAnalyzer.MotionDetectionProcessor",
          "sensitivity": "medium",
          "eventAggregationWindow": "PT1S",
          "name": "motionDetection",
          "inputs": [
            {
              "nodeName": "rtspSource",
              "outputSelectors": []
            }
          ]
        }
      ],
      "sinks": [
        {
          "@type": "#Microsoft.VideoAnalyzer.IotHubMessageSink",
          "hubOutputName": "inferenceOutput",
          "name": "iotHubSink",
          "inputs": [
            {
              "nodeName": "motionDetection",
              "outputSelectors": []
            }
          ]
        }
      ]
    }
  }
}
The returned status is 201. This status indicates that a new topology was created.
Try the following next steps:
- Invoke
pipelineTopologySetagain. The returned status code is 200. This code indicates that an existing topology was successfully updated. - Invoke
pipelineTopologySetagain, but change the description string. The returned status code is 200, and the description is updated to the new value. - Invoke
pipelineTopologyListas outlined in the previous section. Now you can see the "MotionDetection" topology in the returned payload.
Read the pipeline topology
Invoke pipelineTopologyGet by using the following payload.
{
    "@apiVersion" : "1.1",
    "name" : "MotionDetection"
}
Within a few seconds, you see the following response in the OUTPUT window:
{
  "status": 200,
  "payload": {
    "systemData": {
      "createdAt": "2021-03-21T18:16:46.491Z",
      "lastModifiedAt": "2021-03-21T18:16:46.491Z"
    },
    "name": "MotionDetection",
    "properties": {
      "description": "Analyzing live video to detect motion and emit events",
      "parameters": [
        {
          "name": "rtspPassword",
          "type": "string",
          "description": "rtspPassword",
          "default": "dummypw"
        },
        {
          "name": "rtspUrl",
          "type": "string",
          "description": "rtspUrl"
        },
        {
          "name": "rtspUserName",
          "type": "string",
          "description": "rtspUserName",
          "default": "dummyUserName"
        }
      ],
      "sources": [
        {
          "@type": "#Microsoft.VideoAnalyzer.RtspSource",
          "name": "rtspSource",
          "transport": "tcp",
          "endpoint": {
            "@type": "#Microsoft.VideoAnalyzer.UnsecuredEndpoint",
            "url": "${rtspUrl}",
            "credentials": {
              "@type": "#Microsoft.VideoAnalyzer.UsernamePasswordCredentials",
              "username": "${rtspUserName}",
              "password": "${rtspPassword}"
            }
          }
        }
      ],
      "processors": [
        {
          "@type": "#Microsoft.VideoAnalyzer.MotionDetectionProcessor",
          "sensitivity": "medium",
          "eventAggregationWindow": "PT1S",
          "name": "motionDetection",
          "inputs": [
            {
              "nodeName": "rtspSource",
              "outputSelectors": []
            }
          ]
        }
      ],
      "sinks": [
        {
          "@type": "#Microsoft.VideoAnalyzer.IotHubMessageSink",
          "hubOutputName": "inferenceOutput",
          "name": "iotHubSink",
          "inputs": [
            {
              "nodeName": "motionDetection",
              "outputSelectors": []
            }
          ]
        }
      ]
    }
  }
}
In the response payload, notice these details:
- The status code is 200, indicating success.
- The payload includes the
createdAttime stamp and thelastModifiedAttime stamp.
Create a live pipeline using the topology
Next, create a live pipeline that references the above pipeline topology. Invoke the livePipelineSet direct method with the following payload:
{
    "@apiVersion" : "1.1",
    "name": "mdpipeline1",
    "properties": {
        "topologyName": "MotionDetection",
        "description": "Sample pipeline description",
        "parameters": [
            {
                "name": "rtspUrl",
                "value": "rtsp://rtspsim:554/media/camera-300s.mkv"
            },
            {
                "name": "rtspUserName",
                "value": "testuser"
            },
            {
                "name": "rtspPassword",
                "value": "testpassword"
            }
        ]
    }
}
Notice that this payload:
- The payload above specifies the topology ("MotionDetection") to be used by the live pipeline.
- The payload contains parameter value for
rtspUrl, which did not have a default value in the topology payload. This value is a link to the below sample video:
Within few seconds, you see the following response in the OUTPUT window:
{
  "status": 201,
  "payload": {
    "systemData": {
      "createdAt": "2021-03-21T18:27:41.639Z",
      "lastModifiedAt": "2021-03-21T18:27:41.639Z"
    },
    "name": "mdpipeline1",
    "properties": {
      "state": "Inactive",
      "description": "Sample pipeline description",
      "topologyName": "MotionDetection",
      "parameters": [
        {
          "name": "rtspPassword",
          "value": "testpassword"
        },
        {
          "name": "rtspUrl",
          "value": "rtsp://rtspsim:554/media/camera-300s.mkv"
        },
        {
          "name": "rtspUserName",
          "value": "testuser"
        }
      ]
    }
  }
}
In the response payload, notice that:
- Status code is 201, indicating a new live pipeline was created.
- State is "Inactive", indicating that the live pipeline was created but not activated. For more information, see pipeline states.
Try the following direct methods as next steps:
- Invoke
livePipelineSetagain with the same payload and note that the returned status code is now 200. - Invoke
livePipelineSetagain but with a different description and note the updated description in the response payload, indicating that the live pipeline was successfully updated. - Invoke
livePipelineSet, but change the name to "mdpipeline2" andrtspUrlto "rtsp://rtspsim:554/media/lots_015.mkv". In the response payload, notice the newly created live pipeline (that is, status code 201).Note
As explained in Pipeline topologies, you can create multiple live pipelines, to analyze live video streams from many cameras using the same pipeline topology. If you do create additional live pipelines, take care to delete them during the cleanup step.
Activate the live pipeline
Next, you can activate the live pipeline - which starts the flow of (simulated) live video through the pipeline. Invoke the direct method livePipelineActivate with the following payload:
{
    "@apiVersion" : "1.1",
    "name" : "mdpipeline1"
}
Within a few seconds, you see the following response in the OUTPUT window.
{
  "status": 200,
  "payload": null
}
The status code of 200 indicates that the live pipeline was successfully activated.
Check the state of the live pipeline
Now invoke the livePipelineGet direct method with the following payload:
{
    "@apiVersion" : "1.1",
    "name" : "mdpipeline1"
}
Within a few seconds, you see the following response in the OUTPUT window.
{
  "status": 200,
  "payload": {
    "systemData": {
      "createdAt": "2021-03-21T18:27:41.639Z",
      "lastModifiedAt": "2021-03-21T18:27:41.639Z"
    },
    "name": "mdpipeline1",
    "properties": {
      "state": "Active",
      "description": "Sample pipeline description",
      "topologyName": "MotionDetection",
      "parameters": [
        {
          "name": "rtspPassword",
          "value": "testpassword"
        },
        {
          "name": "rtspUrl",
          "value": "rtsp://rtspsim:554/media/camera-300s.mkv"
        },
        {
          "name": "rtspUserName",
          "value": "testuser"
        }
      ]
    }
  }
}
In the response payload, notice the following details:
- The status code is 200, indicating success.
- The state is "Active", indicating the live pipeline is now active.
Observe results
The live pipeline that you created and activated above uses the motion detection processor node to detect motion in the incoming live video stream and sends events to IoT Hub sink. These events are then relayed to your IoT Hub as messages, which can now be observed. You will see messages in the OUTPUT window that have the following "body":
{
  "timestamp": 145471641211899,
  "inferences": [
    {
      "type": "motion",
      "motion": {
        "box": {
          "l": 0.514644,
          "t": 0.574627,
          "w": 0.3375,
          "h": 0.096296
        }
      }
    }
  ]
}
Notice this detail:
- The inferences section indicates that the type is motion. It provides additional data about the motion event, and provides a bounding box for the region of the video frame (at the given timestamp) where motion was detected.
Invoke additional direct method calls to clean up
Next, you can invoke direct methods to deactivate and delete the live pipeline (in that order).
Deactivate the live pipeline
Invoke thelivePipelineDeactivate direct method with the following payload:
{
    "@apiVersion" : "1.1",
    "name" : "mdpipeline1"
}
Within a few seconds, you see the following response in the OUTPUT window:
{
  "status": 200,
  "payload": null
}
The status code of 200 indicates that the live pipeline was successfully deactivated.
Next, try to invoke livePipelineGet as indicated previously in this article. Observe the state value.
Delete the live pipeline
Invoke the direct method livePipelineDelete with the following payload
{
    "@apiVersion" : "1.1",
    "name" : "mdpipeline1"
}
Within a few seconds, you see the following response in the OUTPUT window:
{
  "status": 200,
  "payload": null
}
A status code of 200 indicates that the live pipeline was successfully deleted.
If you also created the pipeline called "mdpipeline2", then you cannot delete the pipeline topology without also deleting this additional pipeline. Invoke the direct method livePipelineDelete again by using the following payload:
{
    "@apiVersion" : "1.1",
    "name" : "mdpipeline2"
}
Within a few seconds, you see the following response in the OUTPUT window:
{
  "status": 200,
  "payload": null
}
A status code of 200 indicates that the live pipeline was successfully deleted.
You can invoke livePipelineList by using the same payload as pipelineTopologyList. Observe that no live pipelines are enumerated.
Delete the pipeline topology
After all live pipelines have been deleted, you can invoke the pipelineTopologyDelete direct method with the following payload:
{
    "@apiVersion" : "1.1",
    "name" : "MotionDetection"
}
Within a few seconds, you see the following response in the OUTPUT window.
{
  "status": 200,
  "payload": null
}
A status code of 200 indicates that the topology was successfully deleted.
You can try to invoke pipelineTopologyList and observe that the module contains no topologies.
Clean up resources
If you want to try other quickstarts or tutorials, keep the resources that you created. Otherwise, go to the Azure portal, go to your resource groups, select the resource group where you ran this quickstart, and delete all the resources.