Troubleshoot Azure Video Analyzer
![]()
Alternatively, check out troubleshoot in the service.
Note
Azure Video Analyzer has been retired and is no longer available.
Azure Video Analyzer for Media is not affected by this retirement. It is now rebranded to Azure Video Indexer. Click here to read more.
This article covers troubleshooting steps for the Azure Video Analyzer edge module.
Troubleshoot deployment issues
Diagnostics
As part of your Video Analyzer deployment, you set up Azure resources such as IoT Hub and IoT Edge devices. As a first step to diagnosing problems, always ensure that the Edge device is properly set up by following these instructions:
- Run the
checkcommand. - Check your IoT Edge version.
- Check the status of the IoT Edge security manager and its logs.
- View the messages that are going through the IoT Edge hub.
- Restart containers.
- Check your firewall and port configuration rules.
Issues when using ARM template
If you encounter issues when using the ARM template (the Deploy to Azure button), use the steps in this quickstart to manually deploy the necessary resources.
Pre-deployment issues
If the edge infrastructure is fine, you can look for issues with the deployment manifest file. To deploy the Video Analyzer module on the IoT Edge device alongside any other IoT modules, you use a deployment manifest that contains the IoT Edge hub, IoT Edge agent, and other modules and their properties. You can use the following command to deploy the manifest file:
az iot edge set-modules --hub-name <iot-hub-name> --device-id avasample-iot-edge-device --content <path-to-deployment_manifest.json>
If the JSON code isn't well formed, you might receive the following error: Failed to parse JSON from file: '<deployment manifest.json>' for argument 'content' with exception: "Extra data: line 101 column 1 (char 5325)"
If you encounter this error, we recommend that you check the JSON for missing brackets or other issues with the structure of the file. To validate the file structure, you can use a client such as the Notepad++ with JSON Viewer plug-in or an online tool such as the JSON Formatter & Validator.
During deployment: IoT Edge Runtime response
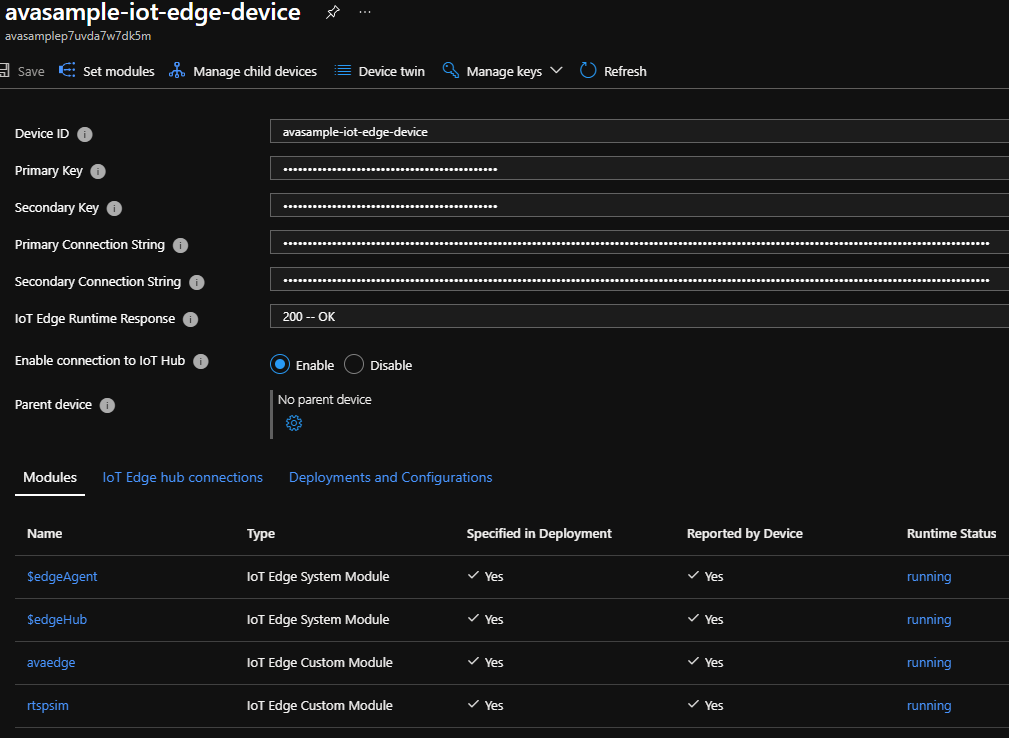
After the Video Analyzer module is deployed correctly on the IoT Edge device, you can use the Azure portal to run a diagnosis of the IoT Edge Runtime.
In the Azure portal, go to the IoT hub that's connected to your IoT Edge device.
Look for Automatic device management, and then select IoT Edge.
In the list of Edge devices, select the device that you want to diagnose, and open the management blade.

Check whether the IoT Edge Runtime response code is 200-OK. Other response codes include:
- 400 - The deployment configuration is malformed or invalid.
- 417 - The device doesn't have a deployment configuration set.
- 412 - The schema version in the deployment configuration is invalid.
- 406 - The IoT Edge device is offline or not sending status reports.
- 500 - An error occurred in the IoT Edge runtime.
Tip
If you experience issues running Azure IoT Edge modules in your environment, use Azure IoT Edge standard diagnostic steps as a guide for troubleshooting and diagnostics.
Post deployment: Reported properties and direct methods
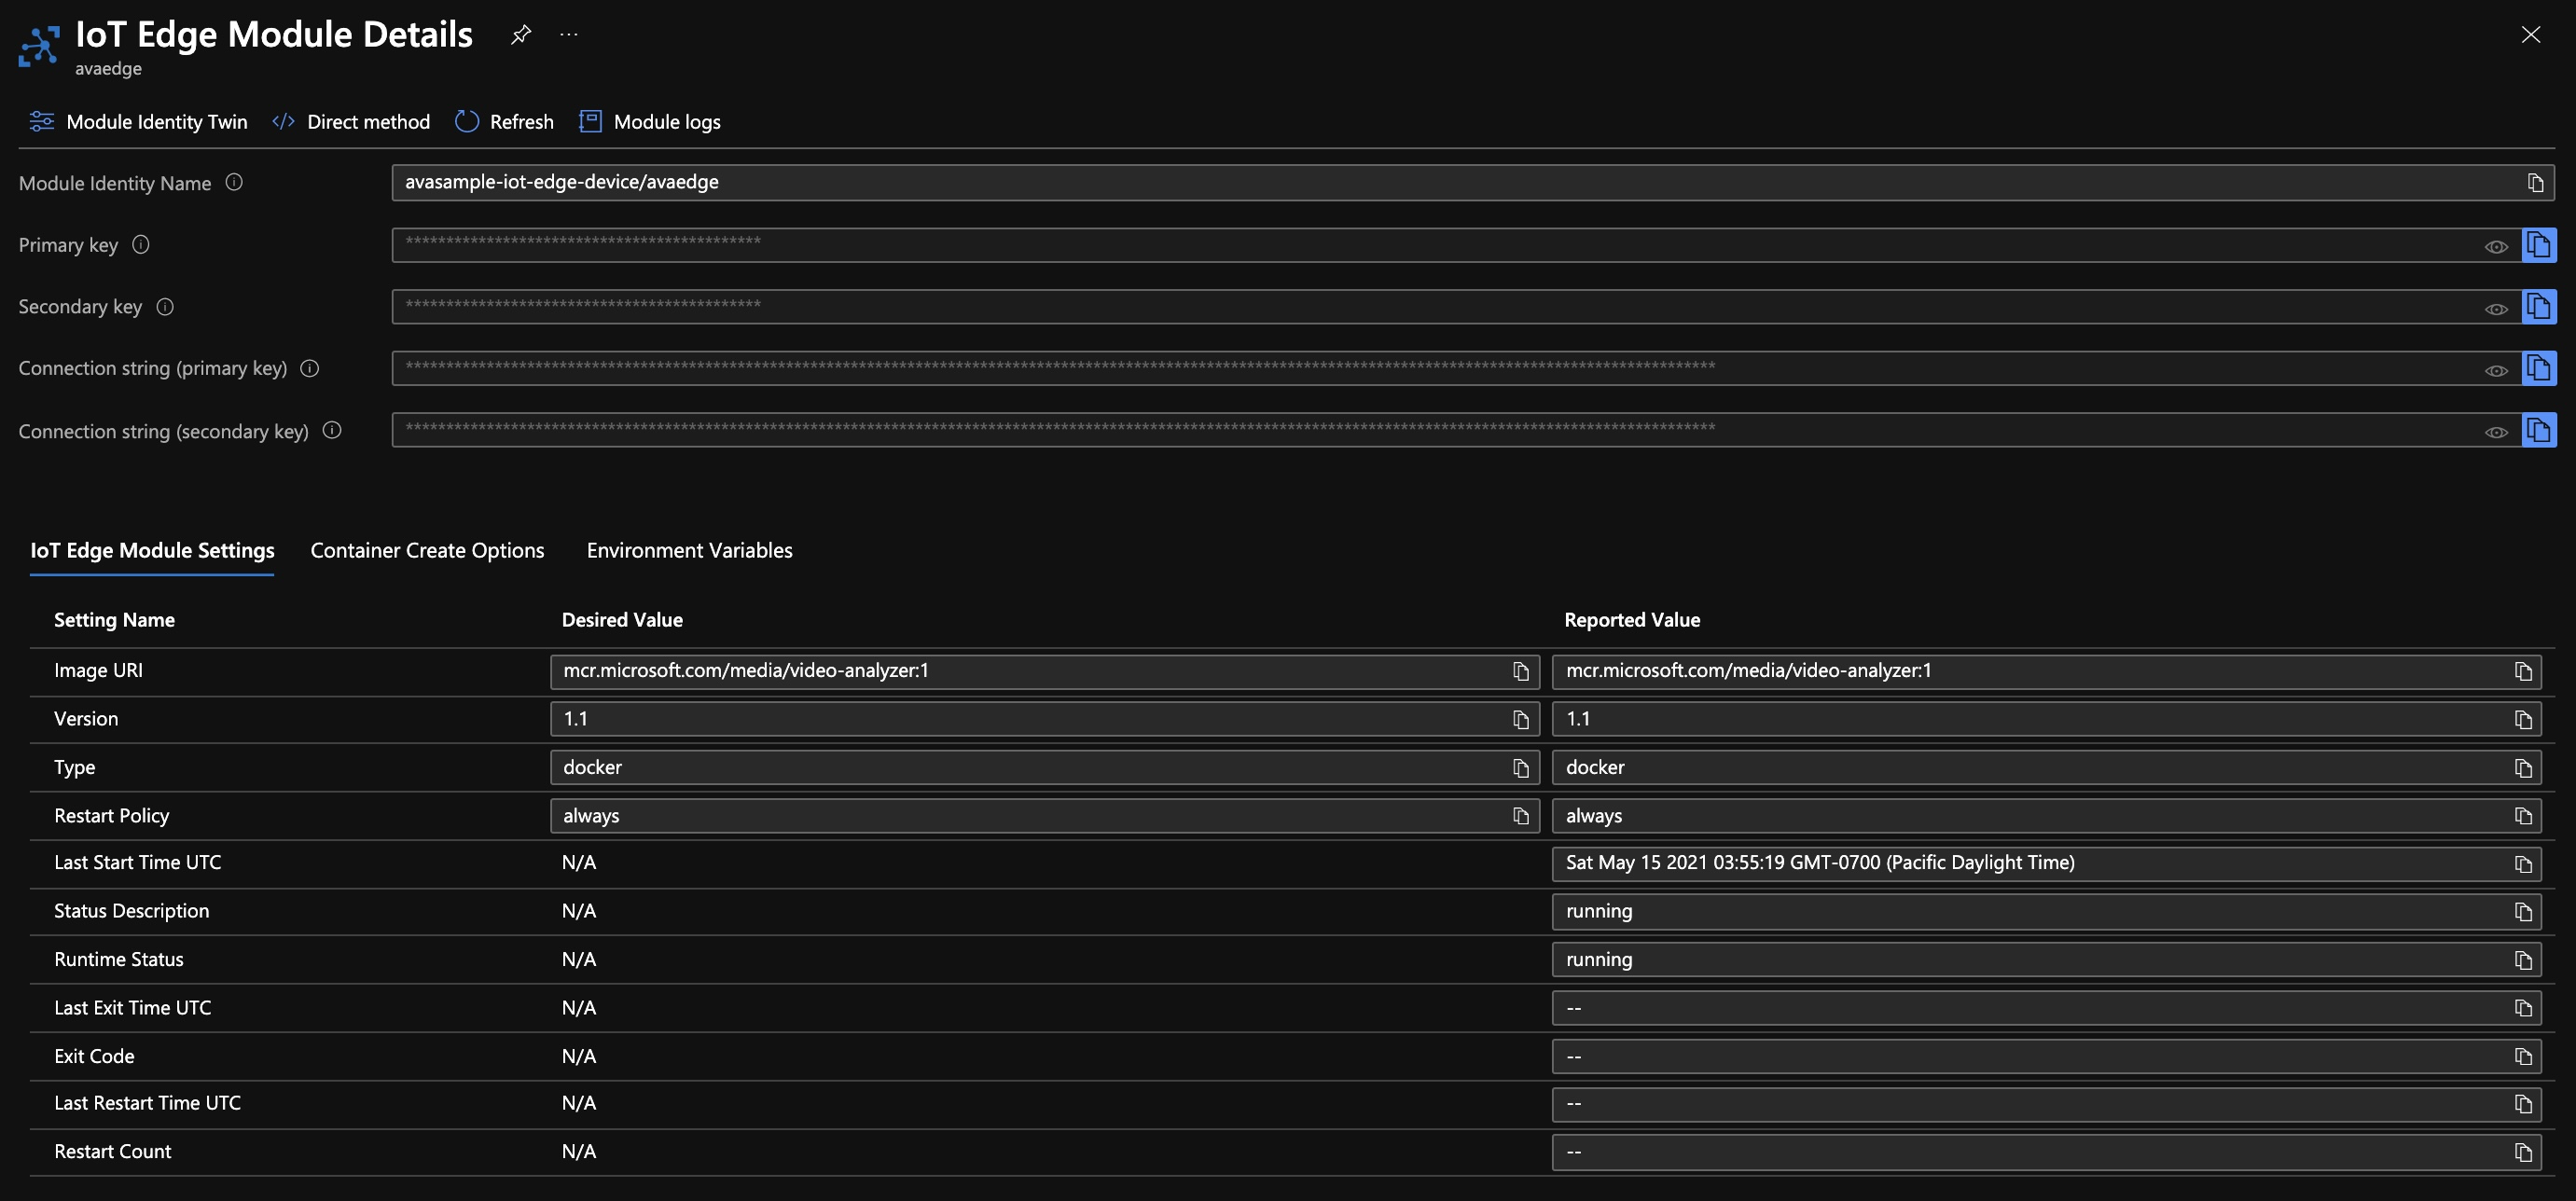
In the Azure portal, select and open the management blade for the Video Analyzer edge module. First, check the reported and desired properties, which can help you understand whether the module properties have synced with the deployment. If they haven't, you can restart your IoT Edge device. If the Specified in deployment and Reported by device columns indicate Yes, you can invoke direct methods on the Video Analyzer module, by clicking on the Direct method menu option.
You can use the Direct methods guide to call a few methods, especially simple ones such as pipelineTopologyList. The guide also specifies expected request and response payloads and error codes. After the simple direct methods are successful, you can be assured that the Video Analyzer edge module is functionally OK.

Keep in mind the following:
- If you get a status
501 code, check to ensure that the direct method name is accurate. If the method name and request payload are accurate, you should get results along with success code of 200. - If the request payload is inaccurate, you will get a status
400 codeand a response payload that indicates error code and message that should help with diagnosing the issue with your direct method call.
Post deployment: Diagnostic logs for issues
The container logs for your IoT Edge module should contain diagnostics information to help debug your issues you encounter while analyzing live video. You may be able to check container logs for issues and self-diagnose the issue.
If you've run all the preceding checks and are still encountering issues, gather logs from the IoT Edge device with the support bundle command for further analysis by the Azure team. You can contact us for support and to submit the collected logs.
Common error resolutions
Video Analyzer edge module works collaboratively with the IoT Edge agent and hub modules. Some of the common errors that you'll encounter with its deployment are caused by issues with the underlying IoT infrastructure. The errors include:
Edge Agent module reports 'empty config file' and no modules start on the device.
The IoT Edge security daemon fails with an invalid hostname.
The IoT Edge module is deployed successfully and then disappears from the device.
Tip
If you experience issues running Azure IoT Edge modules in your environment, use Azure IoT Edge standard diagnostic steps as a guide for troubleshooting and diagnostics.
If there are any additional issues that you may need help with, please collect logs and submit a support ticket. You can also reach out to us by sending us an email at videoanalyzerhelp@microsoft.com.
Working with external modules
Using pipeline extension processors you can extend the pipeline to send and receive data from other IoT Edge modules by using HTTP or gRPC protocols. As a specific example, this live pipeline can send video frames as images to an external inference module such as Yolo v3 and receive JSON-based analytics results using HTTP protocol. In such a topology, the destination for the events is mostly the IoT hub. In situations where you don't see the inference events on the hub, check for the following:
Check to see whether the hub that live pipeline is publishing to and the hub you're examining are the same. As you create multiple deployments, you might end up with multiple hubs and mistakenly check the wrong hub for events.
In Azure portal, check to see whether the external module is deployed and running. In the example image here, rtspsim, yolov3, tinyyolov3 and logAnalyticsAgent are IoT Edge modules running external to the avaedge module.
Check to see whether you're sending events to the correct URL endpoint. The external AI container exposes a URL and a port through which it receives and returns the data from POST requests. This URL is specified as an
endpoint: urlproperty for the HTTP extension processor. As seen in the topology URL, the endpoint is set to the inferencing URL parameter. Ensure that the default value for the parameter or the passed-in value is accurate. You can test to see whether it's working by using Client URL (cURL).As an example, here is a Yolo v3 container that's running on local machine with an IP address of 172.17.0.3.
curl -X POST http://172.17.0.3/score -H "Content-Type: image/jpeg" --data-binary @<fullpath to jpg>Result returned:
{"inferences": [{"type": "entity", "entity": {"tag": {"value": "car", "confidence": 0.8668569922447205}, "box": {"l": 0.3853073438008626, "t": 0.6063712999658677, "w": 0.04174524943033854, "h": 0.02989496027381675}}}]}Tip
Use Docker inspect command to find the IP address of the machine.
If you're running one or more live pipelines that use the pipeline extension processor, you should use the
samplingOptionsfield to manage the frames per second (fps) rate of the video feed.- In certain situations, where the CPU or memory of the edge machine is highly utilized, you can lose certain inference events. To address this issue, set a low value for the
maximumSamplesPerSecondproperty on thesamplingOptionsfield. You can set it to 0.5 ("maximumSamplesPerSecond": "0.5") on each instance of the pipeline and then re-run the instance to check for inference events on the hub.
- In certain situations, where the CPU or memory of the edge machine is highly utilized, you can lose certain inference events. To address this issue, set a low value for the

Multiple direct methods in parallel – timeout failure
Video Analyzer provides a direct method-based programming model that allows you to set up multiple topologies and multiple pipelines. As part of the topology and pipeline setup, you invoke multiple direct method calls on the IoT Edge module. If you invoke these multiple method calls in parallel, especially the ones that start and stop the pipelines, you might experience a timeout failure such as the following:
Assembly Initialization method Microsoft.Media.VideoAnalyzer.Test.Feature.Edge.AssemblyInitializer.InitializeAssemblyAsync threw exception. Microsoft.Azure.Devices.Common.Exceptions.IotHubException:
{"Message":"{\"errorCode\":504101,\"trackingId\":\"55b1d7845498428593c2738d94442607-G:32-TimeStamp:05/15/2020 20:43:10-G:10-TimeStamp:05/15/2020 20:43:10\",\"message\":\"Timed out waiting for the response from device.\",\"info\":{},\"timestampUtc\":\"2020-05-15T20:43:10.3899553Z\"}","ExceptionMessage":""}. Aborting test execution.
We recommend that you not call direct methods in parallel. Call them sequentially (that is, make one direct method call only after the previous one is finished).
Collect logs for submitting a support ticket
When self-guided troubleshooting steps don't resolve your problem, go the Azure portal and open a support ticket.
Warning
The logs may contain personally identifiable information (PII) such as your IP address. All local copies of the logs will be deleted as soon as we complete examining them and close the support ticket.
To gather the relevant logs that should be added to the ticket, follow the instructions below in order and upload the log files in the Details pane of the support request.
Reproduce the issue
Restart the Video Analyzer edge module.
Note
This step is required to gracefully terminate the edge module and get all log files in a usable format without dropping any events.
On the IoT Edge device, use the following command after replacing
<avaedge>with the name of your Video Analyzer edge module:sudo iotedge restart <avaedge>You can also restart modules remotely from the Azure portal. For more information, see Monitor and troubleshoot IoT Edge devices from the Azure portal.
Connect to the virtual machine from the IoT Hub page in the portal
Zip all the files in the debugLogs folder. These log files are not meant for self-diagnosis. They are meant for the Azure engineering team to analyze your issues.
In the following command, be sure to replace $DEBUG_LOG_LOCATION_ON_EDGE_DEVICE with the location of the debug logs on the Edge device that you set up earlier in Step 2.
sudo apt install zip unzip
zip -r debugLogs.zip $DEBUG_LOG_LOCATION_ON_EDGE_DEVICE
Attach the debugLogs.zip file to the support ticket.
Run the support bundle command, collect the logs and attach to the support ticket.
Configure Video Analyzer module to collect Verbose Logs
Configure your Video Analyzer module to collect Verbose logs by setting the logLevel and logCategories as follows:
"logLevel": "Verbose",
"logCategories": "Application,Events,MediaPipeline",
You can do this in either:
- In Azure portal, by updating the Module Identity Twin properties of the Video Analyzer module
- Or in your deployment manifest file, you can add these entries in the properties node of the Video Analyzer module

Use the support-bundle command
When you need to gather logs from an IoT Edge device, the easiest way is to use the support-bundle command. This command collects:
- Module logs
- IoT Edge security manager and container engine logs
- IoT Edge check JSON output
- Useful debug information
Run the
support-bundlecommand with the --since flag to specify how much time you want your logs to cover. For example, 2h will get logs for the last two hours. You can change the value of this flag to include logs for different periods.sudo iotedge support-bundle --since 2hThis command creates a file named support_bundle.zip in the directory where you ran the command.
Attach the support_bundle.zip file to the support ticket.
Video Analyzer edge module debug logs
To configure the Video Analyzer edge module to generate debug logs, do the following:
Sign in to the Azure portal, and go to your IoT hub.
On the left pane, select IoT Edge.
In the list of devices, select the ID of the target device.
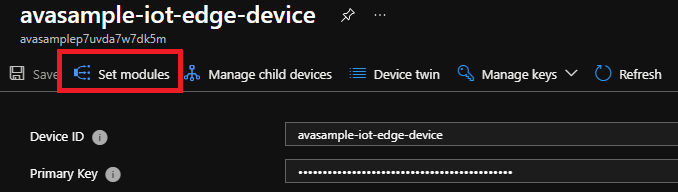
At the top of the pane, select Set Modules.
In the IoT Edge Modules section, look for and select avaedge.
Select Module Identity Twin. An editable pane opens.
Under desired key, add the following key/value pair:
"DebugLogsDirectory": "/var/lib/videoanalyzer/logs"Note
This command binds the logs folders between the Edge device and the container. If you want to collect the logs in a different location on the device:
- Create a binding for the Debug Log location in the Binds section, replacing the $DEBUG_LOG_LOCATION_ON_EDGE_DEVICE and $DEBUG_LOG_LOCATION with the location you want:
/var/$DEBUG_LOG_LOCATION_ON_EDGE_DEVICE:/var/$DEBUG_LOG_LOCATION - Use the following command, replacing $DEBUG_LOG_LOCATION with the location used in the previous step:
"DebugLogsDirectory": "/var/$DEBUG_LOG_LOCATION"
- Create a binding for the Debug Log location in the Binds section, replacing the $DEBUG_LOG_LOCATION_ON_EDGE_DEVICE and $DEBUG_LOG_LOCATION with the location you want:
Select Save.
You can stop log collection by setting the value in Module Identity Twin to null. Go back to the Module Identity Twin page and update the following parameter as:
"DebugLogsDirectory": ""
Best practices around logging
Monitoring and logging should help in understanding the taxonomy and how to generate logs that will help in debugging issues with Video Analyzer.
As gRPC server implementation differs across languages, there is no standard way of adding logging inside in the server.
As an example, if you build a gRPC server using .NET core, gRPC service adds logs under the Grpc category. To enable detailed logs from gRPC, configure the Grpc prefixes to the Debug level in your appsettings.json file by adding the following items to the LogLevel sub-section in Logging:
{
  "Logging": {
    "LogLevel": {
      "Default": "Debug",
      "System": "Information",
      "Microsoft": "Information",
      "Grpc": "Debug"
       }
  }
}
You can also configure this in the Startup.cs file with ConfigureLogging:
public static IHostBuilder CreateHostBuilder(string[] args) =>
    Host.CreateDefaultBuilder(args)
        .ConfigureLogging(logging =>
        {

           logging.AddFilter("Grpc", LogLevel.Debug);
        })
        .ConfigureWebHostDefaults(webBuilder =>
        {
            webBuilder.UseStartup<Startup>();
        });
Logging and diagnostics in gRPC on .NET provides some guidance for gathering some diagnostic logs from a gRPC server.
A failed gRPC connection
If a pipeline is active and streaming from a camera, the connection will be maintained by Video Analyzer.
Monitoring and balancing the load of CPU and GPU resources when these resources become bottlenecks
Video Analyzer edge module does not monitor or provide any hardware resource monitoring. Developers will have to use the hardware manufacturers monitoring solutions. However, if you use Kubernetes containers, you can monitor the device using the Kubernetes dashboard.
gRPC in .NET core documents also share some valuable information on Performance Best Practices and Load balancing.
Troubleshooting an inference server when it does not receive any frames and you are receiving, an "unknown" protocol error
There are several things you can do to get more information about the problem.
Include the "mediaPipeline log category in the desired properties of the Video Analyzer module and ensure the log level is set to
Information.To test network connectivity, you can run the following command from the edge device.
sudo docker exec avaedge /bin/bash -c "apt update; apt install -y telnet; telnet <inference-host> <inference-port>"If the command outputs a short string of jumbled text, then telnet was successfully able to open a connection to your inference server and open a binary gRPC channel. If you do not see this, then telnet will report a network error.
In your inference server you can enable additional logging in the gRPC library. This can give additional information about the gRPC channel itself. Doing this varies by language, here are instructions for C#.
Picking more images from buffer of gRPC without sending back result for first buffer
As a part of the gRPC data transfer contract, all messages that Video Analyzer sends to the gRPC inferencing server should be acknowledged. Not acknowledging the receipt of an image frame breaks the data contract and can result in undesired situations.
To use your gRPC server with Video Analyzer edge module, shared memory can be used for best performance. This requires you to use Linux shared memory capabilities exposed by the programming language/environment.
Open the Linux shared memory handle.
Upon receiving of a frame, access the address offset within the shared memory.
Acknowledge the frame processing completion so its memory can be reclaimed by Video Analyzer edge module
Note
If you delay in acknowledging the receipt of the frame to Video Analyzer for a long time, it can result in the shared memory becoming full and causing data drops.
Store each frame in a data structure of your choice (list, array, and so on) on the inferencing server.
You can then run your processing logic when you have the desired number of image frames.
Return the inferencing result back to Video Analyzer edge module when ready.
Next steps
Tutorial: Event-based video recording to cloud and playback from cloud