Note
Access to this page requires authorization. You can try signing in or changing directories.
Access to this page requires authorization. You can try changing directories.
Applies to: .NET in Linux
This article introduces how to use top and htop command line tools to monitor processes.
Prerequisites
As in the previous parts, this part is structured to put more emphasis on the theory and principals to follow when you start to troubleshoot. It doesn't have any prerequisites. However, you should have following items already set up if you followed all the steps of this training so far:
- Nginx has two websites:
- The first website listens for requests by using the myfirstwebsite host header (
http://myfirstwebsite), and routes the requests to the demo ASP.NET Core application that is listening on port 5000. - The second website listens for requests by using the buggyamb (
http://buggyamb) host header, and routes the requests to the second ASP.NET Core sample buggy application that is listening on port 5001.
- The first website listens for requests by using the myfirstwebsite host header (
- Both ASP.NET Core applications are running as services that restart automatically when the server is rebooted, or the applications stops responding or fails.
- A Linux local firewall is enabled and configured to allow SSH and HTTP traffic.
Goal of this part
When you troubleshoot a performance problem, you might have to monitor the CPU and memory usage of a process to understand how its resource consumption evolves over time. In Windows, you can use Task Manager to do it. Linux has several tools that aim to achieve the same thing.
This part will examine the top and htop command line tools to monitor processes.
top
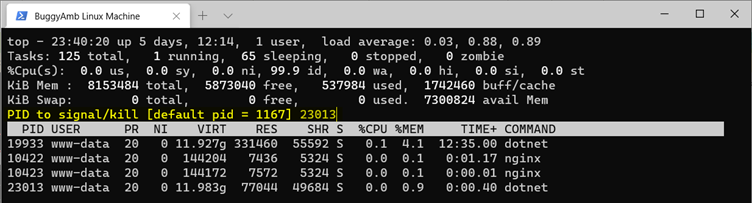
To open the Task Manager equivalent in Linux, run the top command.
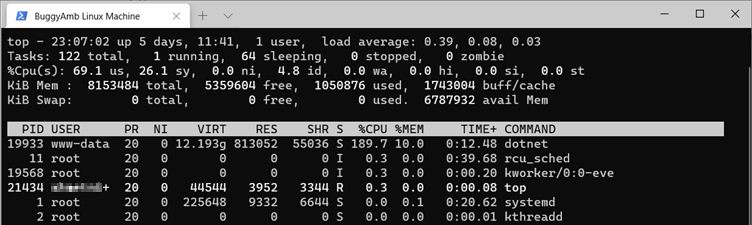
In this example, you can observe in the first listed process for PID 19933 that the process exhibits high CPU usage, and memory usage is also high.
Select and deselect columns
To add or remove columns in the view that the top tool provides, select F while you run the tool. The columns that are marked by an asterisk (*) are the ones that are selected for display. Use the arrow keys to move through the available columns, and use the Spacebar to select or deselect the columns. Then, select Esc to exit.
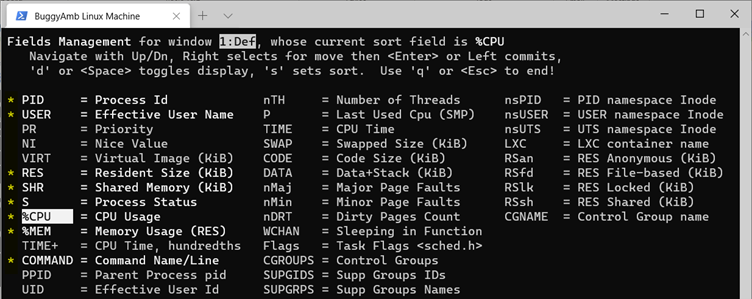
The changes will be saved for your user account. The next time that you run top, you'll see the columns that you selected.
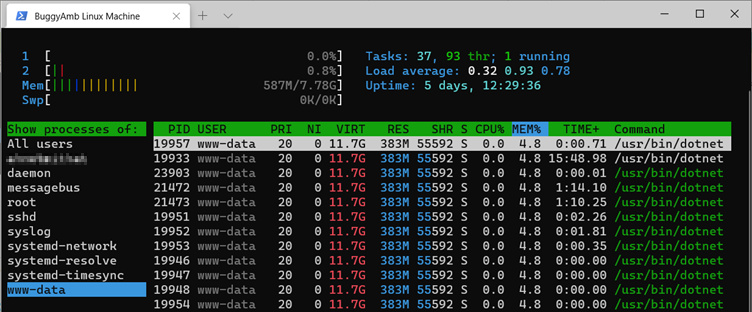
Filter the output by users
To be able to target problematic resource consumption scenarios, it's important to know how to filter the top output. One of the most common methods is to filter processes by username. You can select U, and then type the username. The following screenshot shows the top tool filtering the available process snapshots for the www-data user.
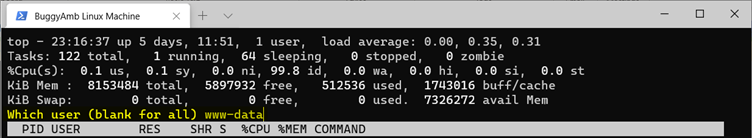
When you select Enter, you see the processes that are run by the given user (the www-data user in this example).

When you inspect the output of the filtered top view, you can see that two of the processes are .NET processes. These two processes run the two ASP.NET Core applications, while the other two processes belong to Nginx.
You can use filters when you run the top command directly. For example, if you run the top -u www-data command, it will yield the same output as you would get if you were to open the top tool and select U to filter by user.
Remove idle processes
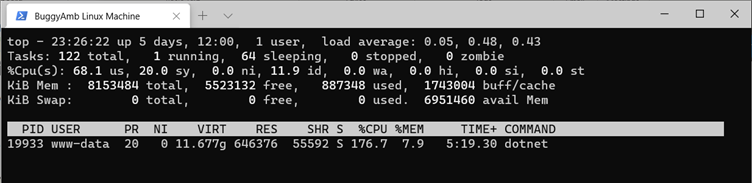
Select I or run the top -i command to filter the top output to show only the processes that are consuming CPU. The following screenshot shows the output of the top -i -u www-data command. Notice that the top output hides the idle processes even though there are four processes that were started by using the www-data user account. Only the process that has PID=19933 consumes CPU.
Select I again to toggle the switch and show the idle processes, too.
Kill processes
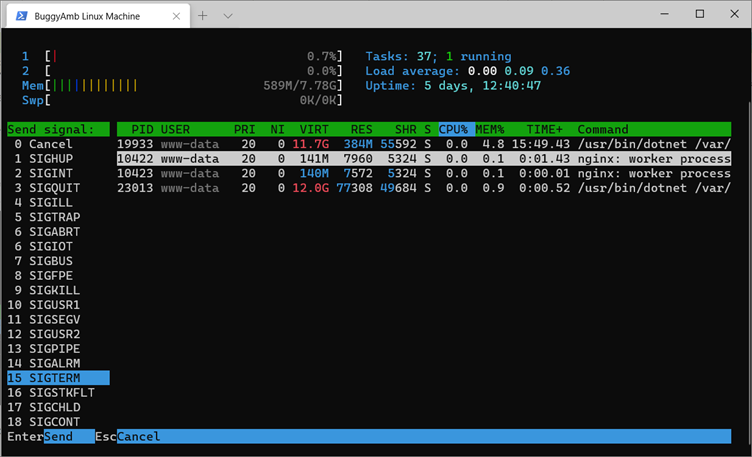
To kill or terminate a process, you have to send a kill signal to the process. You might recall that we used the sudo kill -9 <PID> command earlier to kill a process. You can also kill processes by using top. Select K to kill a process while top is running, and then type the PID of the process that you want to kill.
After you select Enter, top asks for the signal type. Select Enter one more time to send the "terminate" signal (15/sigterm).

After a few seconds, you'll see that the process for PID 122632 is missing from the list. Remember that in the lists, the "122632" process corresponds to the BuggyAmb ASP.NET Core application. Because it was configured to start automatically, you'll see that a new .NET process that has a new PID starts after the shutdown.
htop
Htop is a process viewer and a text mode application for system monitoring in real-time, similar to top. It's easy to use, and it displays a complete list of the processes that are running.
The htop tool is pre-installed in the distribution of Ubuntu Linux that is used to install the virtual server for this course. If htop isn't installed in your Linux distro, you can use the package managers in Linux to install it. (See Part 1.3 - Install .NET in Linux for details.)
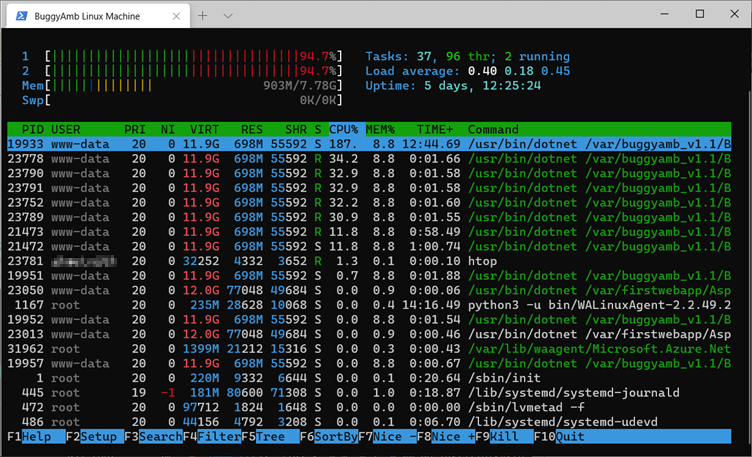
To start the tool, run the htop command. You see a colorful output that resembles the following one:
Note
The bottom line indicates the function keys that you can use. Select F6 to sort by different options, use the arrow keys to select the PERCENT_MEM column, and then select Enter. This sorts the processes by memory usage.

As with the top command, you can use keyboard shortcuts for several functions. For example, select U to select the username from a list.
However, there's something confusing in the htop output. Based on the output of the last examples, you should expect to see four processes for the www-data user. However, we see that there are many more entries. What could be causing this behavior?
The difference in the output occurs because htop shows both processes and their threads by default. Unless you want to see the threads, we recommend that you always disable thread view to make the output clearer. To disable thread view and see only the processes, select Shift+H. The following screenshot shows the processes without threads.

If you have to kill a process, select the process by using the arrow keys, select F9, and then select Enter to send the "terminate" signal.
This succinct overview should allow you to understand which processes are running and consuming resources on your system. To exit htop, select either F10 or Ctrl+C.
Next steps
The next part of this series (Part 3.3 - Debuggers, core dumps, and collecting core dumps) discusses debuggers and dump files.