Note
Access to this page requires authorization. You can try signing in or changing directories.
Access to this page requires authorization. You can try changing directories.
Applies to: .NET Core 2.1, .NET Core 3.1, .NET 5
This article introduces debuggers and core dumps and the tools to capture and analyze core dump files in Linux.
Prerequisites
As in the previous parts, this part is structured to put more emphasis on the theory and principles to follow when you start to troubleshoot. It doesn't have any prerequisites. However, you should have following items already set up if you followed all the steps of this training so far:
- Nginx has two websites:
- The first website listens for requests by using the myfirstwebsite host header (
http://myfirstwebsite), and routes the requests to the demo ASP.NET Core application that is listening on port 5000. - The second website listens for requests by using the buggyamb (
http://buggyamb) host header, and routes the requests to the second ASP.NET Core sample buggy application that is listening on port 5001.
- The first website listens for requests by using the myfirstwebsite host header (
- Both ASP.NET Core applications are running as services that restart automatically when the server is rebooted, or the applications stops responding or fails.
- A Linux local firewall is enabled and configured to allow SSH and HTTP traffic.
Goal of this part
This part introduces the concept of core dumps and debuggers, and the tools that you can use to capture and analyze core dump files. Most of the techniques and tools that are described in this part will be used in the next troubleshooting labs.
Core dump
Just like a user-mode memory dump in Windows, a core dump is a snapshot of the memory of a process. Core dumps are frequently needed to troubleshoot performance problems in Linux.
A core dump can be generated on-demand by a debugger (manual dump collection) or can be configured to be collected automatically after a process failure.
What happens when a process fails in Linux?
Most Linux systems have core dumps enabled by default. The system generates a core dump for any process that is terminated unexpectedly. This is similar to the manner in which Windows Error Reporting (WER) generates dumps for processes that terminate abnormally.
Here are some key aspects of how a Linux system behaves related to core dump file generation:
- By default, a core dump file is generated when a process is terminated unexpectedly.
- The Core dump file is named "core" and is created in the current working directory or in the /var/lib/systemd/coredump directory.
- Although the default behavior is for the operating system to generate a core dump file, this setting can be overwritten in /proc/sys/kernel/core_pattern to directly pipe the core dump file output into another application.
These defaults settings and some others, such as the size limits, can be set in configuration files. The following resources go into greater depth about this subject:
External link: Ubuntu man page core - core dump file
Apport: Ubuntu's way to manage core dumps
In Ubuntu, the apport system service manages core dump generation. Even if the operating system's core dump generation is disabled, apport will still create core dump files.
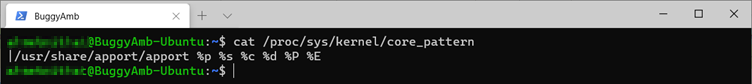
Apport uses /proc/sys/kernel/core_pattern to directly pipe the core dump file into apport. If you run the cat /proc/sys/kernel/core_pattern command while apport is running, you should see the following result.
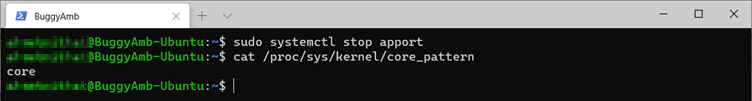
If you disable apport, this doesn't prevent core dump generation upon process termination. Instead, it simply stops apport. The system will then revert to its default behavior by generating core dumps itself. If you run the same cat /proc/sys/kernel/core_pattern after apport is stopped, you'll see the following default system behavior.
Disable automatic core dump generation
To disable automatic core dump file generation, do the following steps:
- Stop and disable apport.
- Disable the system's default action.
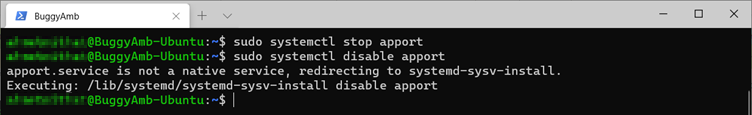
Apport can be stopped and disabled the same as any other service. Use the sudo systemctl stop apport command and the sudo systemctl disable apport command to stop the service, and then disable it to prevent it from being restarted.
To disable the operating system's automatic dump file generation for all processes that are running under all user accounts on the computer, you have to take the steps that are provided in such articles as this one.
Capture core dump and debuggers
Several tools are available to capture a core dump file, such as gcore, gdb, and several tools to analyze a core dump file, such as objdump, kdump, gdb, and lldb.
However, you'll encounter some significant difficulties when you work with these tools to try to do .NET debugging:
- Configuration could be difficult compared to the process of setting up symbols for the WinDbg debugger on Windows.
- Core dump files are large because these tools don't know which memory region is used in a .NET Core process, and they can't trim the memory information to only what is needed.
- Dump files aren't portable. You'll have to analyze the dump files on the Linux computer on which they were generated. If you want to analyze the dump files on different Linux computer, then extra steps are necessary to configure the host computer for the debugging session.
lldb
Lldb is the recommended tool for analyzing .NET Core dump. The .NET SDK includes useful tools to configure lldb correctly. However, you have to install at least version 3.9 to be able to do such debugging analysis for .NET Core.
To install lldb 3.9 or a later version, use Package Manager (for example: sudo apt install lldb).
Tools and commands available in the .NET Core runtime and SDK
Several useful tools are included together with .NET Core runtime. For example, createdump is installed as part of every runtime installation of .NET Core.
You can also develop your own tools or choose to make use of several third-party tools. The Microsoft .NET Core platform also includes some .NET Core tools that are helpful to debug .NET Core problems. These include the following:
- dotnet-dump
- dotnet-gcdump
- dotnet-symbol
To install these tools together with the others, you have to have .NET Core SDK installed. For more information about .NET Core SDK, see: .NET SDK overview.
Note
Procdump is also worthy of a mention, although it's not part of SDK. An in-depth discussion of ProcDump options can be found at the end of this part.
createdump
Createdump is installed in every .NET Core version. For more information, see the implementation details.
Createdump is the best way to generate a core dump file in Linux. This is because the dump files that are generated automatically by the system might not include all the managed states. Also, some SOS or dotnet-dump commands may display "UNKNOWN" for type and function names.
Similarly, the manual dump files that are created by using gdb or gcore won't include all the managed state information, and some SOS or dotnet-dump commands might display "UNKNOWN" for type and function names, too. The recommend way to capture manual dump files is by using createdump or some other .NET Core tool, such as procdump.
Here are some important features of createdump:
- Minimally sized minidumps are automatically generated.
- It's easy to configure with a non-root user.
- You can use it to capture on-demand (manual) or system failure core dump files.
- Most stack overflow failures are detected.
You have to use lldb 3.9 or a later version to analyze the core dump files that are captured by using createdump.
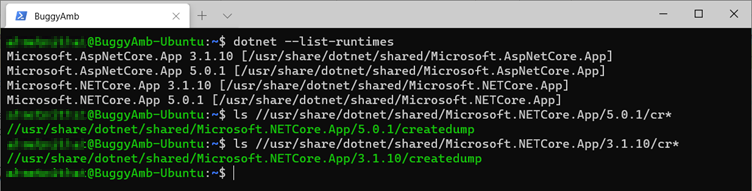
You can find createdump in the .NET Core installation directory. To find this directory, run the dotnet --list-runtimes command. As shown in the following screenshot, separate createdump file was created for the two versions of active runtimes.
dotnet-dump
You have to have .NET Core SDK installed to be able to install this tool. Dotnet-dump was introduced in the .NET Core 3.0 SDK. It helps to collect and analyze core dump files without needing any native debugger. It lets you run SOS commands to analyze failures and garbage collector (GC) output.
Note
Dotnet-dump isn't a native debugger. Therefore, some features, such as displaying the native stack frames, aren't available. The dump file that is generated isn't portable, and you can't open it in Windows.
To install this tool, run the following command:
dotnet tool install -g dotnet-dump
You'll use this tool to capture and analyze core dump files in the upcoming lab sections.
dotnet-gcdump
This is another tool that requires .NET Core SDK. Dotnet-gcdump is available in .NET Core 3.1 or later versions.
This is an interesting approach for analyzing GC heaps. The idea behind this tool is that a full process dump file isn't required for investigations in many scenarios. Therefore, the tool captures only the managed heap information and generates a report based on it.
Most importantly, the dump files that are generated by this tool are portable and can be analyzed in PerfView or Visual Studio in Windows.
As briefly explained here, a full garbage collection is triggered by this tool to stream the information to an "event pipe" to generate the dump file.
Note
Because a full Gen 2 garbage collection is triggered in the target process, the performance characteristics of the application can be changed. As you might expect, while the information is written to the core dump file, the threads will be suspended. The larger the heap size, the longer are the pauses to write the information to the file, and the longer the threads will stay paused.
The information that's contained inside such core dump files will be useful in the following circumstances:
- Comparing the number of objects by type on the managed heap
- Analyzing object roots
- Determining what objects have a reference to what type
- Other statistical analysis about objects on the heap
After the data is generated, the file can be exported outside of the computer on which it was created, and it can be analyzed in PerfView or in Visual Studio.
To install this tool, run the following command:
dotnet tool install -g dotnet-gcdump
You'll use this command to generate some reports for .NET Core heaps in the upcoming lab sections.
dotnet-symbol
Dotnet-symbol is a useful tool to get symbols for managed debugging. It was introduced in .NET Core 2.1. As for the two other tools that are mentioned earlier, these tools also require .NET Core SDK to be installed.
Dotnet-symbol downloads all the files that are needed for debugging (symbols, modules, SOS, and DAC for the coreclr module) for any given core dump files.
To install this tool, run the following command:
dotnet tool install -g dotnet-symbol
You'll use this tool to configure the debugger in the upcoming lab sections.
procdump
A linux version of ProcDump is also available. It has some limited feature sets compared to its Windows counterpart. It doesn't support every feature that the Windows version does. For example, it can't be configured to collect core dump files when the process crashes or throws a first-chance exception. However it is still a powerful tool.
The following command-line options for ProcDump trigger core dump files generation in the specified conditions.
-C: CPU exceeds or equals a specified value (0 to 100 * nCPU)
-c: CPU is less than a specified value (0 to 100 * nCPU)
-M: The memory commit exceeds or equals a specified value (MB)
-m: The memory commit is less than a specified value (MB)
-T: The thread count exceeds or equals a specified value
-F: The filedescriptor count exceeds or equals a specified value
Follow the installation instructions to install ProcDump in your environment.
You'll use this tool to capture a core dump file that's based on CPU usage in the upcoming lab sections.
A note about selecting the SDK version
By default, the SDK installs in a "side-by-side" configuration. This means that multiple versions can run together on a single computer. How the version gets picked when you're running CLI commands is explained in more detail in the Select the .NET Core version to use article. However, the process for selecting an SDK version can be summarized as follows:
- .NET Core searches for a global.json file iteratively reverse navigating the path upward from the current working directory.
- .NET Core uses the SDK that's specified in the first global.json that's found.
- .NET Core uses the latest installed SDK if no global.json instance is found.
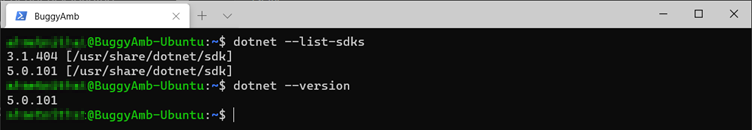
For example, on the test Linux virtual machine, you should have both the .NET Core 3.1 and 5.0 SDKs installed. If you run .NET Core by including the --version switch, you should see that the latest version is used.
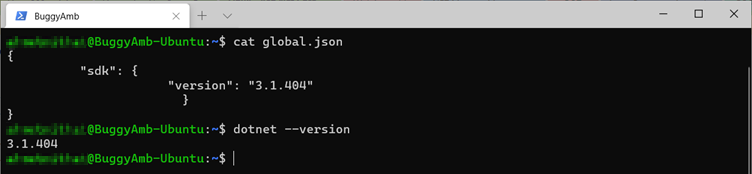
Now, create a global.json file in the current directory (your home directory), and set the version explicitly by using the cat tool, as shown. Then, check the version again. It is now showing the exact SDK version that you put inside the global.json file.
This is important to know when you run some SDK commands, such as creating an application by using the .NET Core new command. However, you won't have to do this when you use the dotnet-dump and dotnet-gcdump tools.
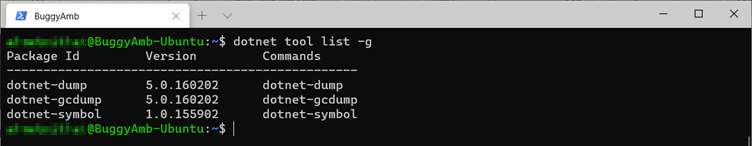
.NET Core SDK installs the latest version of the tools regardless of which SDK you selected. For example, if you ran the commands to install the dotnet-dump, dotnet-gcdump, and dotnet-symbol tools for .NET Core SDK 3.1, the latest versions of these tools will be downloaded and installed, as shown in the following screenshot (where version 5 of the tools for dotnet-dump and dotnet-gcdump have been installed).
The following articles are great resources for more information about .NET Core tools:
Note
Selecting the runtime version to use is different than selecting the SDK version. If you want to use a specific version of the .NET runtime, use the --fx-version <VERSION> option, as explained in this article.
Next steps
You're now ready to begin the troubleshooting labs. In the labs, you'll learn how to use the tools that are discussed here to troubleshoot problems.