Note
Access to this page requires authorization. You can try signing in or changing directories.
Access to this page requires authorization. You can try changing directories.
Applies to: .NET Core 2.1, .NET Core 3.1, .NET 5
This article introduces the process of reproducing the .NET Core crash problem in Linux. This article also discusses how to check the Nginx tool and system logs for symptoms and indications of the crash.
Prerequisites
The minimum requirement to follow these troubleshooting labs is to have an ASP.NET Core application to demonstrate low-CPU and high-CPU performance problems.
You can find several sample applications to achieve this goal on the internet. For example, you can download and set up Microsoft's simple webapi sample to demonstrate undesirable behavior. Or, you can use BuggyAmb ASP.NET Core application as the sample project.
If you have followed the previous parts of this series, you should have the following setup ready to go:
- Nginx is configured to host two websites:
- The first listens for requests by using the myfirstwebsite host header (
http://myfirstwebsite) and routing requests to the demo ASP.NET Core application that listens on port 5000. - The second listens for requests by using buggyamb host header (
http://buggyamb) and routing requests to the second ASP.NET Core sample buggy application that listens on port 5001.
- The first listens for requests by using the myfirstwebsite host header (
- Both ASP.NET Core applications should be running as services that restart automatically when the server is restarted or the application stops responding.
- The Linux local firewall is enabled and configured to allow SSH and HTTP traffic.
Note
If your setup isn't ready, go to "Part 2 Create and run ASP.NET Core apps."
To continue this lab, you must have at least one problematic ASP.NET Core web application that is running behind Nginx.
Goal of this lab
This article is the first of two lab parts. The lab work is divided as follows:
Part 1: You'll reproduce the crash issue, check Nginx and system logs to search for the crash symptoms and indicators, and then troubleshoot by generating a crash dump file. Finally, you'll gather the system-generated core dump file from the crash report that's generated by the Ubuntu manager, apport.
Part 2: You'll install and configure lldb to work together with a .NET Core debugger extension named SOS. You'll also analyze the dump file in lldb.
Reproduce a crash problem
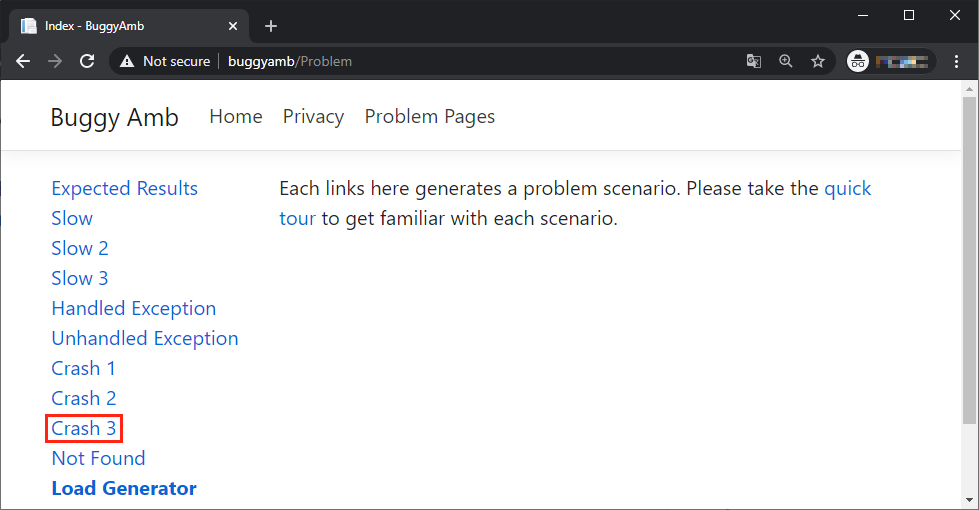
When you browse to the site URL, http://buggyamb/, and select the Problem Pages link, you'll see links to some problem scenarios. There are three different crash scenarios. However, for this lab, you'll troubleshoot only the third crash scenario.
Before you select any link, select Expected Results, and verify that your application is working as expected. You should see an output that resembles the following.
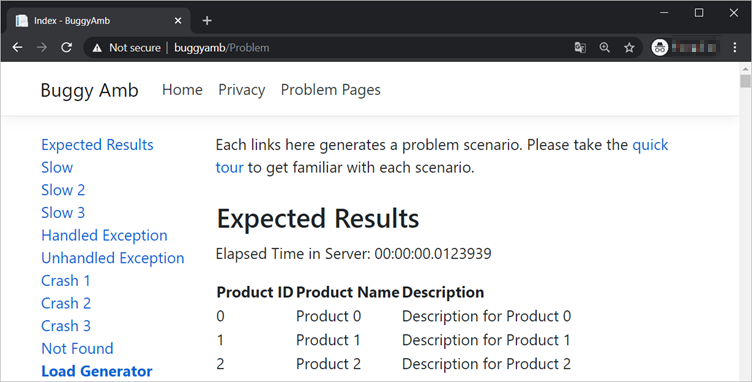
The page should load quickly (in less than one second), and display a list of products.
To test the first "slow page" scenario, select the Slow link. The page will eventually show the same output as the Expected Results page, but it will render much more slowly than expected.
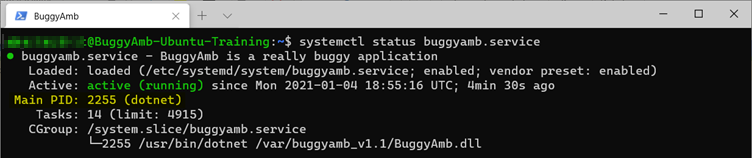
Before you reproduce the crash problem, note the process ID of the buggy application. You'll use this information to verify that your application restarts. Run the systemctl status buggyamb.service command to get the current PID. In the following results, the PID of the process that's running the service is 2255.
Select the Crash 3 link. The page loads and displays following message:
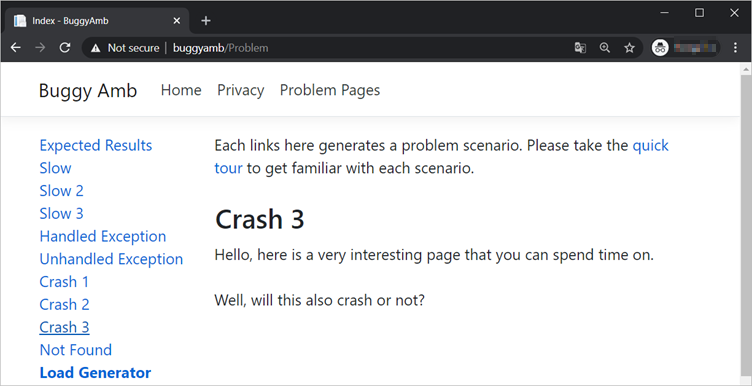
This message asks the user to consider the following question: Will this page cause the process to crash? Run the same systemctl status buggyamb.service command, and you should see the same PID. This indicates that a crash didn't occur.
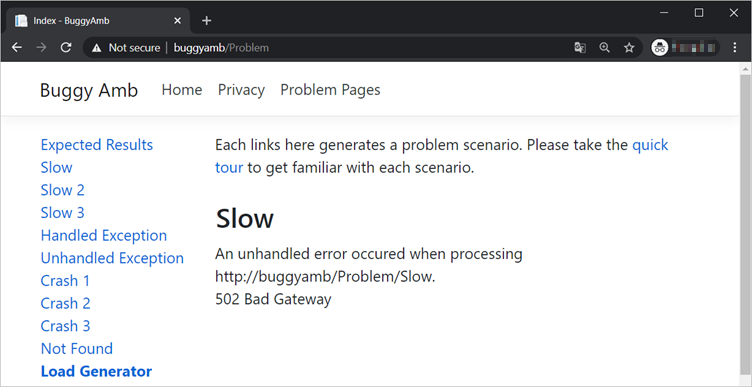
Select Expected Results, and then select Slow. Although you should see the correct page after you select Expected Results, selecting Slow should generate the following error message.
Even if you select any other link on the webpage, you'll experience the same error for a short while. After 10–15 seconds, everything will start to respond as expected again.
To check whether the PID is changed, run systemctl status buggyamb.service again. This time, you should notice that the process seems to have stopped because the PID is changed. In the previous example, the process PID was 2255. In the following example, it's changed to 2943. Apparently, the website made good on its promise to crash the process.

Troubleshooting the steps of repro
Here's a summary of the repro steps:
- Select Crash 3. The page loads correctly but returns a confusing message that suggests that the process will crash.
- Select Slow. You receive an "HTTP 502 - Bad Gateway" error message instead of the product table.
- After the problem starts, none of the pages render for the next 10–15 seconds.
- After 10–15 seconds, the application starts responding correctly.
The "HTTP 502 - Bad Gateway" error message by itself doesn't tell you much. However, it should provide a first clue: This is a proxy error, and it can occur if a proxy can't communicate with the application that's running behind the proxy. In the proposed setup, Nginx is working as a reverse proxy to the ASP.NET Core application. Therefore, this error from Nginx indicates that it wasn't able to reach the back-end application when it forwarded incoming requests.
Verify that Nginx works correctly
Before you continue, you might want to check whether Nginx is working correctly. This step isn't mandatory because you know that the application is crashing. However, you can still verify the status of Nginx by checking the Nginx logs. You practiced similar troubleshooting steps earlier in the "Installing and configuring Nginx" section.
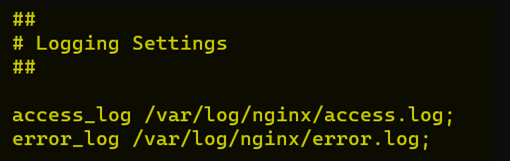
Nginx has two kinds of logs: Access logs and error logs. These are stored in the /var/log/nginx/ folder.
Access logs are just like IIS log files. Open and examine them, just as you did in the previous section. The logs don't show any new information other than the "HTTP 502" response status code that you already encountered during the navigation attempts on the site's pages.
Inspect the error logs by using the cat /var/log/nginx/error.log command. This log is more helpful and clear. It shows that Nginx was able to process the request, but the connection between Nginx and the buggy application closed before the final response was sent.

This log clearly indicates that what you see isn't a Nginx problem.
Check system logs by using the journalctl command
If the ASP.NET Core application is crashing, symptoms should appear somewhere.
Because the buggy application is running as a system service, its operation is logged in the system log files. System log files are like system event logs in Windows. The journalctl command is used to view and manipulate systemd logs.
You can run the journalctl command without switches to see all the logs. However, the output will be a large file. It's in your best interest to learn how to filter the content. For example, you can run the following command:
journalctl -r --identifier=buggyamb-identifier --since "10 minute ago"
The following switches are available:
-r: Print the logs in reverse order so that the newest is listed first.--identifier: Remember theSyslogIdentifier=buggyamb-identifierline in the service file of the test application. (You can use this to force logs to show only entries that apply to the problematic application.)--since: Show information that was logged over the specified previous period. Example:--since "10 minute ago"or--since "2 hour ago".
There are several useful switches for the journalctl command that can help you to filter the logs. To familiarize yourself with this command, we recommend that you consult the help page by running man journalctl.
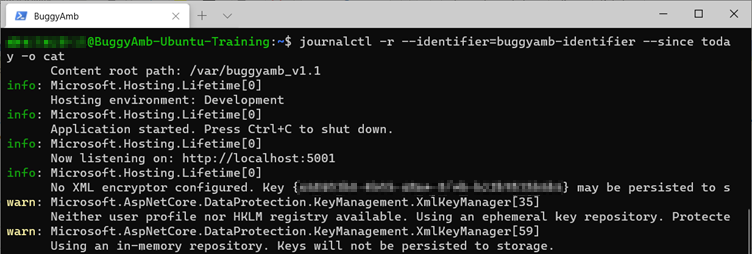
Run journalctl -r --identifier=buggyamb-identifier --since today -o cat. You should notice that some warning messages are generated.
To see the details, scroll down by using the arrow keys. You'll find a System.Net.WebException exception.
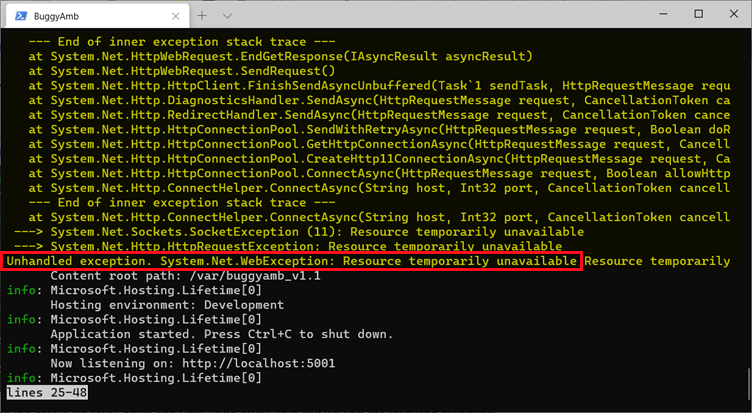
If you closely examine the logs, you'll see the code file name and the line number on which the problem occurred. For this lab, we'll assume that this information isn't available. This is because, in real world scenarios, you might not be able to retrieve this kind of information. Therefore, the objective is to continue by analyzing a crash dump to learn the cause of the crash.
Get a core dump file after a crash
Recall some of the key system behavior when a process is terminated:
- By default, a core dump file is generated.
- The core dump is named core and is created in the current working folder or in the /var/lib/systemd/coredump folder.
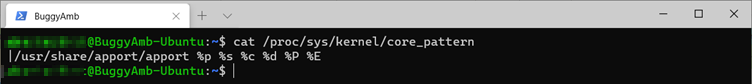
Although the default behavior is for the system to generate a core dump file, this setting can be overwritten in /proc/sys/kernel/core_pattern to directly pipe the resulting core dump file into another application. When you used Ubuntu in the previous parts in this series, you learned that apport manages core dump file generation in Ubuntu. The core_pattern file is overwritten to pipe the core dump to apport.
Apport uses /var/crash folder to store its report files. If you inspect this folder, you should see a file that was already generated after a crash.
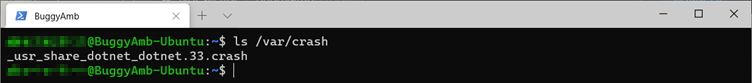
However, this isn't the core dump file. This is a report file that contains several pieces of information together with the dump file. You have to unpack this file to get the core dump file.
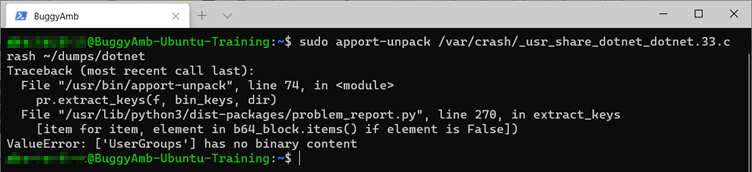
Create a dumps folder under your home folder. You'll be instructed to extract the report there. The command for unpacking the apport report file is apport-unpack. Run the following command:
sudo apport-unpack /var/crash/_usr_share_dotnet_dotnet.33.crash ~/dumps/dotnet
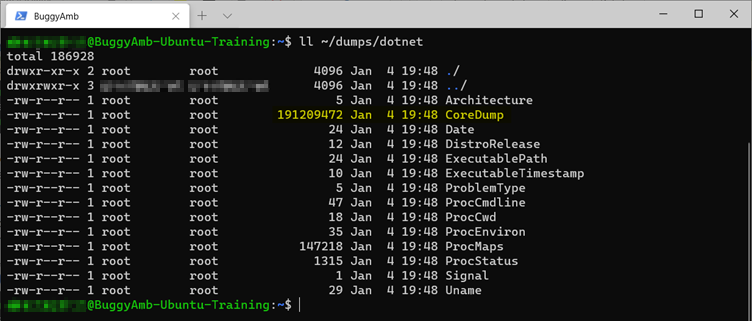
This command creates the /dumps folder. The apport-unpack command will create the /dumps/dotnet folder. Here's the result.
In the ~/dumps/dotnet folder, you should see the dump file. The file is named CoreDump, and it should be around 191 MB.
Extracting the auto-generated core dump file can be a cumbersome process. In the next lab, you'll see that it's easier to capture core dump files by using createdump.
Next steps
Lab 1.2 Open and analyze system-generated core dump files in lldb debugger, you'll see how to open this dump file in the lldb debugger to do a quick analysis.