Note
Access to this page requires authorization. You can try signing in or changing directories.
Access to this page requires authorization. You can try changing directories.
Applies to: .NET Core 2.1, .NET Core 3.1, .NET 5
This article discusses how to install and configure the lldb debugger in Linux, and then open and analyze system-generated .NET Core dump files.
Prerequisites
The minimum requirement to follow these troubleshooting labs is to have an ASP.NET Core application to demonstrate low-CPU and high-CPU performance problems.
You can find several sample applications to achieve this goal on the internet. For example, you can download and set up Microsoft's simple webapi sample to demonstrate undesirable behavior. Or, you can use BuggyAmb ASP.NET Core application as the sample project.
If you have followed the previous parts of this series, you should have the following setup ready to go:
- Nginx is configured to host two websites:
- The first listens for requests by using the myfirstwebsite host header (
http://myfirstwebsite) and routing requests to the demo ASP.NET Core application that listens on port 5000. - The second listens for requests by using buggyamb host header (
http://buggyamb) and routing requests to the second ASP.NET Core sample buggy application that listens on port 5001.
- The first listens for requests by using the myfirstwebsite host header (
- Both ASP.NET Core applications should be running as services that restart automatically when the server is restarted or the application stops responding.
- The Linux local firewall is enabled and configured to allow SSH and HTTP traffic.
Note
If your setup isn't ready, go to "Part 2 Create and run ASP.NET Core apps."
To continue this lab, you must have at least one problematic ASP.NET Core web application running behind Nginx.
Goal of this lab
This article is the second of two lab parts for debugging crashes of ASP.NET Core applications on Linux.
In Lab 1.1 Reproduce and troubleshoot a crash problem, you followed the steps to reproduce a crash problem, and started troubleshooting. You checked Nginx and the system logs, and proceeded to troubleshoot by gathering and analyzing a memory dump file. You extracted the crash core dump file that was generated by apport, Ubuntu's core dump file manager.
In this part, you'll install and configure the lldb debugger to work together with the .NET Core debugger extension that's named SOS, and then open the dump file in lldb to analyze it.
Install lldb
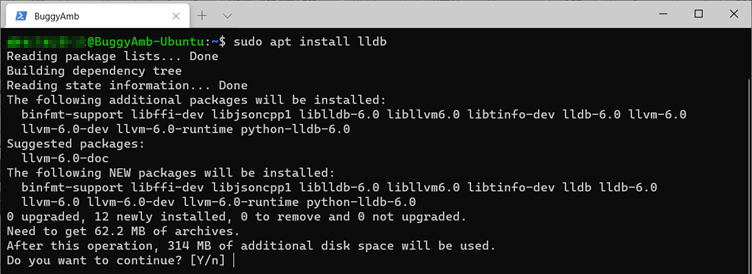
For this lab, you must install lldb 3.9 or a later version. Instructions for several Linux distros are detailed in Installing LLDB on Linux. For this section, we recommend you use the apt install command: sudo apt install lldb. In the following screenshot, you can see that the lldb-6.0 is installed together with some dependencies.
After the installation is finished, you have to configure lldb so that it can automatically load SOS when a core dump file is opened.
Configure lldb
Before you open the core dump file in lldb, follow these required steps to set the symbol path, download the symbols, and load the SOS automatically when lldb is opened:
Install the dotnet-symbol tool:
dotnet tool install -g dotnet-symbolDownload the symbols for the target dump file:
dotnet-symbol <path_of_dump_file>Install SOS:
Install the dotnet-sos global tool:
dotnet tool install -g dotnet-sosInstall SOS:
dotnet-sos install
Install the dotnet-symbol tool
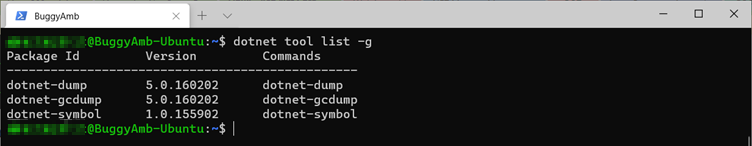
You should have already installed the dotnet-symbol tool together with dotnet-dump and dotnet-gcdump tools in the previous part. If you haven't installed these tools yet, install them before you proceed. To do this, run the dotnet tool install -g dotnet-symbol command to install dotnet-symbols. The, install dotnet-dump and dotnet-gcdump, if you haven't already done this. You should now have three tools installed, as shown in the following screenshot.
Download symbols for the dump file
In part 1, you were instructed how to unpack the core dump file from the apport report. Now it's time to download the symbol files. As explained in this article, symbols operate at a high level. They serve as mappings between the source code and the binaries. These mappings are used by debuggers to resolve the function or method names, source line information, or local variable names when they read a call stack.
You'll use the dotnet-symbol ~/dumps/dotnet/CoreDump -o ~/dumps/symbols --host-only command to download the symbols for the memory dump file to the ~/dumps/symbols directory.
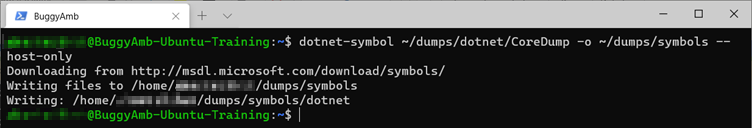
You may receive several "HTTP 404 not found" error messages when you download symbol files if you don't add the --host-only switch. You can safely ignore these messages. The --host-only parameter will download only the host program. This is all that lldb needs to start debugging the ASP.NET Core application.
The next step is to install the SOS-managed debugging extension. This will expose the .NET debugging commands that are required to run the analysis.
Install SOS
What is SOS? According to the official documentation, SOS is a debugger extension that enables a developer to inspect the managed state of a .NET application, including the ASP.NET Core and other .NET-based applications such as .NET WPF and .NET Windows Forms. SOS is a cross-platform extension that can be loaded by WinDbg or a cdb debugger on Windows and by lldb on Linux and macOS.
To install SOS, you must first install the following dotnet-sos tool:
dotnet tool install -g dotnet-sos
Then, install SOS:
dotnet-sos install
The following screenshot shows the result of a successful installation. Notice that the dotnet-sos tool has configured the lldb debugger so that the SOS extension should be loaded automatically when the debugger starts.

You're finally ready to open the dump file by using lldb.
Open core dump in lldb
To open the core dump, you have to use lldb and the following syntax:
lldb --core <dump path> <host-program>
The <host-program> is the native program that started the .NET Core application. This is usually dotnet, unless the application is self-contained. If this is a self-contained application, then this variable is the name of the application without the .dll extension.
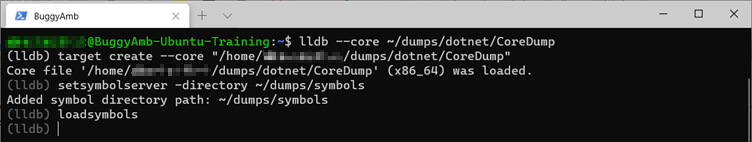
Assuming you're following along by using the same folder names, the path to the memory dump file that you generated in the previous section should be ~/dumps/dotnet/CoreDump. Therefore, you'll run lldb --core ~/dumps/dotnet/CoreDump to open the file.
The following screenshot shows the lldb debugger that has opened the memory dump file.

Set symbols
Recall that you downloaded the symbol files by using the dotnet-symbol command in the ~/dumps/symbols directory. The first command that you should run inside the debugger is to set the symbol server path to the directory that you set for the symbol downloads:
setsymbolserver -directory ~/dumps/symbols
Next, load the symbols: loadsymbols
Run lldb and SOS commands
There are several lldb commands. You can list these by using the help command. In the list, you can see that the SOS commands are also listed under user defined commands. SOS is a plugin for lldb. You can retrieve plugin help information by using the same help command.
Note
You might want to clear the lldb output occasionally. To do this, press Ctrl+L.
To begin, look at the thread's native call stack by using the bt ("back trace") command. This command shows the call stack of the active thread.
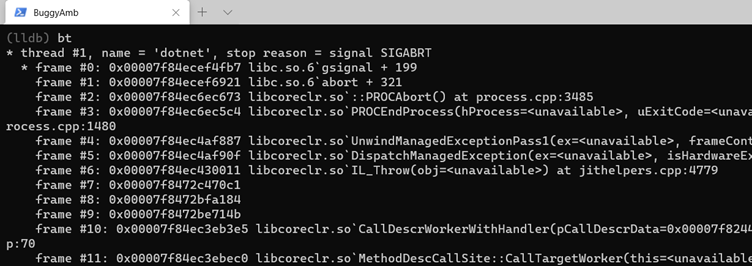
Next, examine the managed call stack by using the SOS clrstack command.
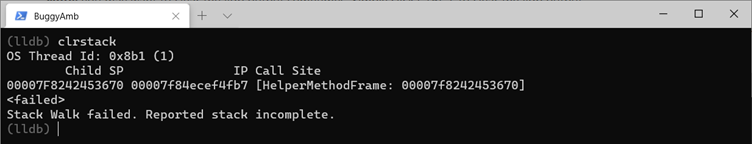
You should not be able to retrieve any information. The stack walk will fail because the reported stack is incomplete. This is related to what was discussed before: The auto-generated core dump file can't collect all managed states.
Also recall that an exception occurred, and this caused the process to crash. Take a look at the exception information by running the SOS pe command.
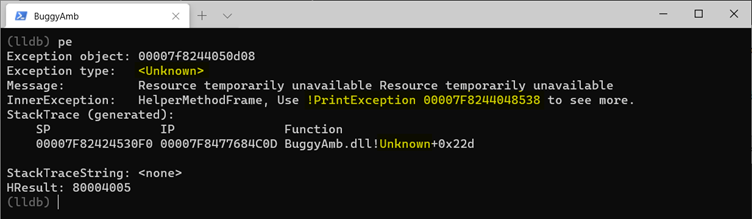
As you can see in the output, the pe command displays the information about the last exception, if any, that was thrown in the current thread.
The exception message in this case is resource temporarily unavailable. However, the type of exception and the function names aren't resolved. Instead, their values are indicated as unknown.
The address of the exception is also displayed. You can try to pass this address as a parameter in the pe command to see whether more details are available. Then, run pe 00007F8244048538.
Note
In this command, replace the address with the address that's displayed in the dump file.
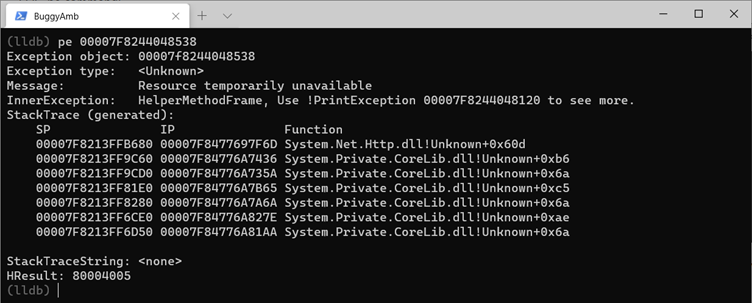
Even if you want to display the objects that are referenced in the stack, you see the same value of unknown.
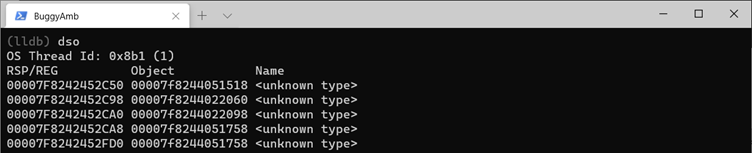
You can try to retrieve more information by selecting an address of one of the objects on the stack, and reviewing the object by using the dumpobj <address> command.
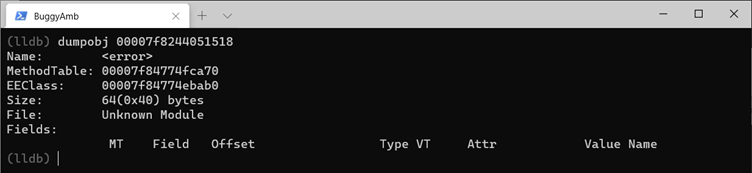
However, you'll likely conclude that this command will also have a limited effect because it returns only more unknown messages. It's time to stop working with the auto-generated dump file. Run the exit command to end the lldb session.
To summarize, the dump file that's generated by system gives you some information, but you're still missing some important information. In the next part, you'll be presented the recommended approach to capture a crash dump.
Next steps
Lab 1.3 Troubleshooting a crash problem - Capture core crash dumps with createdump tool