Note
Access to this page requires authorization. You can try signing in or changing directories.
Access to this page requires authorization. You can try changing directories.
APPLIES TO:  Power BI Desktop
Power BI service
Power BI Desktop
Power BI service
A visual calculation is a DAX calculation that you define and run directly on a visual, instead of adding it to the semantic model. Because a visual calculation works with the data already shown in the visual, you can express common business calculations - like running totals, moving averages, and period-over-period comparisons - without navigating filter context or model relationships. The result is usually shorter DAX that's easier to maintain and often performs better than an equivalent measure.
This article explains what visual calculations are, how they behave in the visual matrix, how the parameters that control them work, and how they differ from measures and calculated columns, so you can decide when a visual calculation is the right choice.
Here's an example visual calculation that defines a running sum for Sales Amount. The DAX required is straightforward:
Running sum = RUNNINGSUM([Sales Amount])
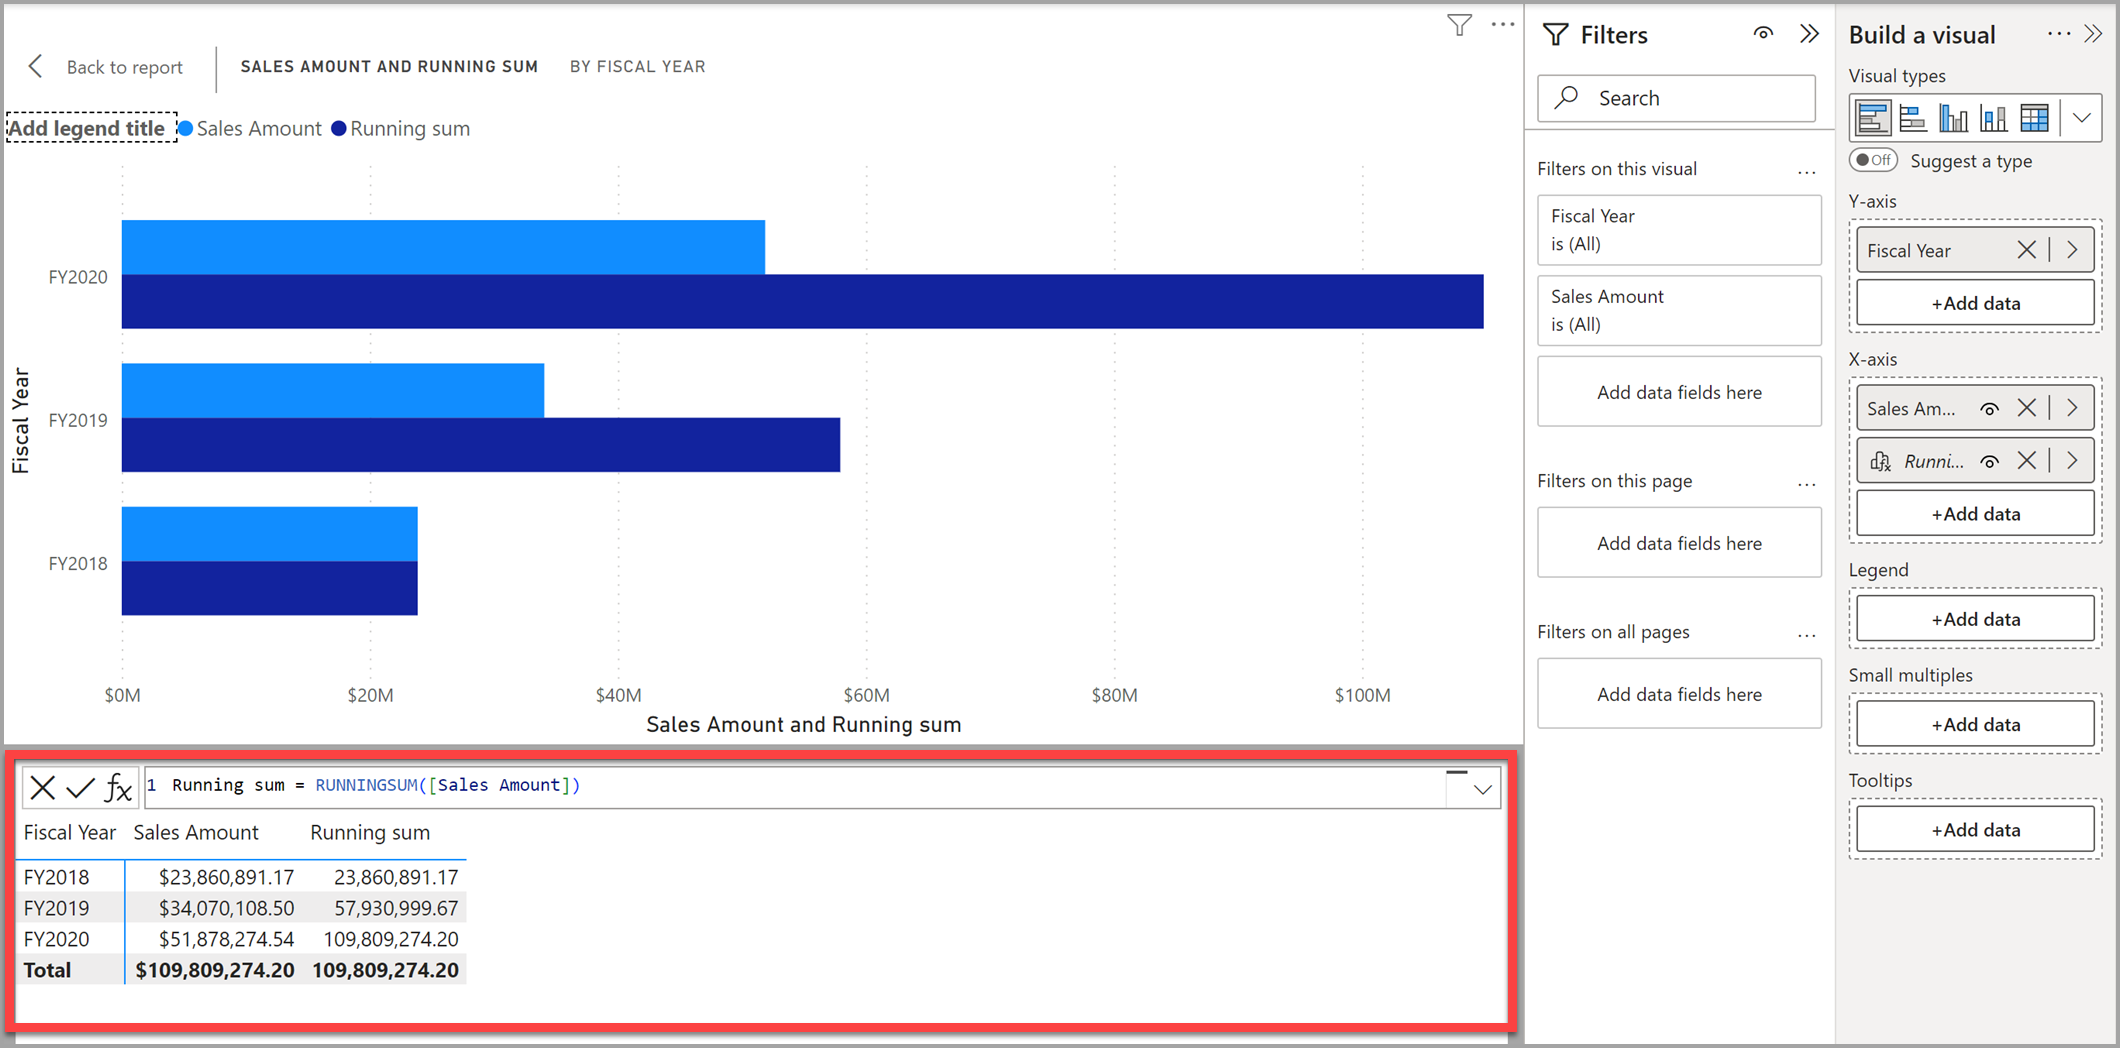
A calculation can refer to any data in the visual, including columns, measures, or other visual calculations. This ability removes the complexity of the semantic model and simplifies the process of writing DAX. You can use visual calculations to complete common business calculations such as running sums or moving averages.
Visual calculations differ from the other calculation options in DAX:
- Visual calculations aren't stored in the model. Instead, you store them on the visual. This limitation means visual calculations can only refer to what's on the visual. You must add anything in the model to the visual before the visual calculation can refer to it. This restriction frees visual calculations from being concerned with the complexity of filter context and the model.
- Visual calculations combine the simplicity of context from calculated columns with the on-demand calculation flexibility from measures.
- Compared to measures, visual calculations operate on aggregated data instead of the detail level, which often leads to performance benefits. When a calculation can be achieved either by a new measure or a visual calculation, the latter often leads to better performance.
- Since visual calculations are part of the visual, they can refer to the visual structure, which leads to more flexibility.
For a more in-depth comparison of ways of adding calculations in Power BI, see Use calculations options in Power BI Desktop.
Table and matrix visuals also expose visual calculations through the custom totals experience, which lets you change what the total row shows without writing DAX. For more information, see the table and matrix visual articles.
To learn how to add or edit a visual calculation, see Create visual calculations.
How visual calculations work
You create visual calculations in Edit mode, which opens over the selected visual. The edit surface has three parts: a preview of the visual, a formula bar for the DAX expression, and a visual matrix that displays results as you type.
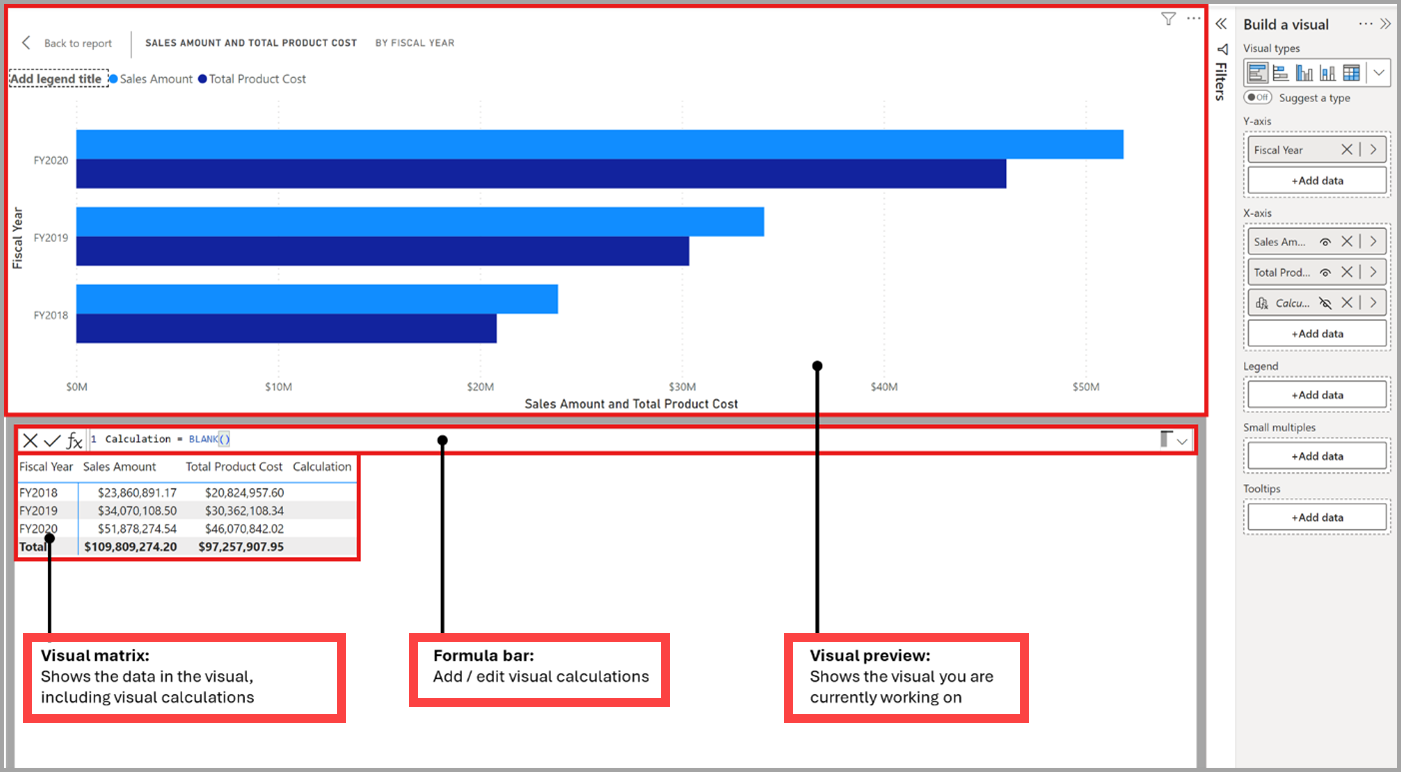
Because you store a visual calculation on the visual, it can reference anything on the visual - columns, measures, or other visual calculations - but nothing else in the model. Most visual calculations evaluate row-by-row against the visual matrix, so aggregation functions like SUM are usually unnecessary. You can't use functions that depend on model relationships - USERELATIONSHIP, RELATED, and RELATEDTABLE.
After you add a visual calculation, it appears in the field list on the visual and renders on the visual itself.
DAX functions available in visual calculations
Many existing DAX functions work in visual calculations. Because visual calculations work within the confines of the visual matrix, functions that rely on model relationships such as USERELATIONSHIP, RELATED, or RELATEDTABLE aren't available.
Visual calculations also introduce a set of functions specific to visual calculations. Many of these functions are easier-to-use shortcuts to DAX window functions.
| Function | Description | Example | Shortcut to |
|---|---|---|---|
| COLLAPSE | The calculation is evaluated at a higher level of the axis. | Percent of parent = DIVIDE([Sales Amount], COLLAPSE([Sales Amount], ROWS)) | N/A |
| COLLAPSEALL | The calculation is evaluated at the total level of the axis. | Percent of grand total = DIVIDE([Sales Amount], COLLAPSEALL([Sales Amount], ROWS)) | N/A |
| EXPAND | The calculation is evaluated at a lower level of the axis. | Average of children = EXPAND(AVERAGE([Sales Amount]), ROWS) | N/A |
| EXPANDALL | The calculation is evaluated at the leaf level of the axis. | Average of leaf level = EXPANDALL(AVERAGE([Sales Amount]), ROWS) | N/A |
| FIRST | Refers to the first row of an axis. | ProfitVSFirst = [Profit] - FIRST([Profit]) | INDEX(1) |
| ISATLEVEL | Reports whether a specified column is present at the current level. | IsFiscalYearAtLevel = ISATLEVEL([Fiscal Year]) | N/A |
| LAST | Refers to the last row of an axis. | ProfitVSLast = [Profit] - LAST([Profit]) | INDEX(-1) |
| LOOKUP | Evaluates an expression in the visual matrix using the current context. | LookupSalesFor2025WithContext = LOOKUP(SUM([Sales]), [Year], "2025") | N/A |
| LOOKUPWITHTOTALS | Evaluates an expression in the visual matrix with totals. | LookupSalesFor2025WithTotals = LOOKUPWITHTOTALS(SUM([Sales]), [Year], "2025") | N/A |
| MOVINGAVERAGE | Adds a moving average on an axis. | MovingAverageSales = MOVINGAVERAGE([Sales Amount], 2) | WINDOW |
| NEXT | Refers to a next row of an axis. | ProfitVSNext = [Profit] - NEXT([Profit]) | OFFSET(1) |
| PREVIOUS | Refers to a previous row of an axis. | ProfitVSPrevious = [Profit] - PREVIOUS([Profit]) | OFFSET(-1) |
| RANGE | Refers to a slice of rows of an axis. | AverageSales = AVERAGEX(RANGE(1), [Sales Amount]) | WINDOW |
| RUNNINGSUM | Adds a running sum on an axis. | RunningSumSales = RUNNINGSUM([Sales Amount]) | WINDOW |
Parameters that control calculation flow
Some visual calculation functions accept optional parameters that control how the calculation traverses the visual matrix:
- Axis and Reset are specific to visual calculations. They reference the visual structure rather than specific fields.
- OrderBy and PartitionBy also work in calculated columns and measures. They reference fields directly.
The following sections describe each parameter and when to use one over another.
Axis
Many functions have an optional Axis parameter, which you can use only in visual calculations. The Axis parameter influences how the visual calculation traverses the visual matrix. The Axis parameter defaults to the first axis in the visual. For many visuals, the first axis is ROWS, which means that the visual calculation is evaluated row-by-row in the visual matrix, from top to bottom. The following table shows the valid values for the Axis parameter:
| Axis icon | Axis name | Description |
|---|---|---|

|
ROWS | Calculates vertically across rows from top to bottom. |

|
COLUMNS | Calculates horizontally across columns from left to right. |

|
ROWS COLUMNS | Calculates vertically across rows from top to bottom, continuing column by column from left to right. |

|
COLUMNS ROWS | Calculates horizontally across columns from left to right, continuing row by row from top to bottom. |
Note
If you specify an axis that isn't present on the visual, the calculation ignores that axis.
Reset
Many functions include an optional Reset parameter that you can use only in visual calculations. The Reset parameter controls if and when the function resets its value to 0 or switches to a different scope while traversing the visual matrix. It controls this behavior by partitioning the target column. As calculations occur within a partition, how the column is divided into partitions determines if a calculation resets.
The default value for the Reset parameter is NONE, which means the visual calculation never restarts.
The Reset parameter accepts different types of values:
- Integers
- Column references
- Special synonyms: HIGHESTPARENT, LOWESTPARENT, NONE
In every case, the parameter specifies a single level in the visual calculation hierarchy (the target level). However, how the calculation interprets this level can vary.
The Reset behavior operates in two different modes: absolute and relative.
When you use integer values for the parameter or their equivalents NONE, HIGHESTPARENT, and LOWESTPARENT, you can choose between these two modes by the integer's signal: positive values perform a reset in absolute mode, and negative values perform a reset in relative mode (and zero does no reset at all, the default behavior).
If you specify a column reference, you're also operating in absolute mode. These values determine how the target column is partitioned and therefore if it resets. The following sections describe these two modes:
Absolute reset mode
Absolute mode is a behavior of the Reset parameter in visual calculations. This mode indicates that the calculation should partition by the target column and all those columns above it. This rule applies at every level in the calculation. At levels above the target column (where the target column isn't present, and possibly other columns), the calculation partitions by the remaining columns available. The positive integer value identifies the target column starting from the top (the top column is 1, the next is 2, and so on). It goes up to N (the number of columns in the hierarchy), and any higher values are trimmed down. Alternatively, you can specify the column directly.
For example, consider a visual calculation with these hierarchy levels: Year, Quarter, Month, and Day. The following table shows how the calculation partitions at each level depending on the value of Reset:
| Level / value | Reset = 1 or Year | Reset = 2 or Quarter | Reset = 3 or Month | Reset = 4 or Day |
|---|---|---|---|---|
| Day level | Year | Quarter and Year | Month, Quarter and Year | Day, Month, Quarter and Year |
| Month level | Year | Quarter and Year | Month, Quarter and Year | Month, Quarter and Year |
| Quarter level | Year | Quarter and Year | Quarter and Year | Quarter and Year |
| Year level | Year | Year | Year | Year |
| Grand total level | None | None | None | None |
Relative reset mode
Relative mode is a behavior of the Reset parameter in visual calculations. Given a negative integer value –X, at each level the calculation partitions by all columns X levels or more above it in the hierarchy (or doesn't partition at all if no such level exists). Valid values for this mode are between -1 and -N+1 (where N is the number of columns in the hierarchy), and any lower values are trimmed up. Again, consider a visual calculation with these hierarchy levels: Year, Quarter, Month, and Day. The following table shows how the calculation partitions at each level depending on the value of Reset
| Level / value | Reset = -1 | Reset = -2 | Reset = -3 |
|---|---|---|---|
| Day level | Month, Quarter and Year | Quarter and Year | Year |
| Month level | Quarter and Year | Year | None |
| Quarter level | Year | None | None |
| Year level | None | None | None |
| Grand total level | None | None | None |
Reset parameter synonyms
The Reset parameter also provides the following synonyms:
- NONE is the default value. It doesn't reset the calculation and is equivalent to 0.
- HIGHESTPARENT performs an absolute reset by the highest level and is equivalent to 1.
- LOWESTPARENT performs a relative reset by the immediate parent and is equivalent to -1.
Examples of using the Reset parameter
Consider a visual calculation with these hierarchy levels: Year, Quarter, Month, and Day. The following visual calculations are equivalent and return the sum of Sales Amount that restarts for every year, regardless of the level the calculation is evaluated on (see absolute reset mode):
RUNNINGSUM([Sales Amount], HIGHESTPARENT)
RUNNINGSUM([Sales Amount], 1)
RUNNINGSUM([Sales Amount], [Year])
In contrast, the following visual calculations both return the sum of Sales Amount that starts from 0 for every immediate parent, which depends on which level the calculation is evaluated on (see relative reset mode).
RUNNINGSUM([Sales Amount], LOWESTPARENT)
RUNNINGSUM([Sales Amount], -1)
Finally, this visual calculation does not reset, and continues adding the Sales Amount value for each day to the previous values, without restarting.
RUNNINGSUM([Sales Amount])
OrderBy and PartitionBy
The OrderBy parameter accepts ORDERBY, and the PartitionBy parameter accepts PARTITIONBY. Unlike Axis and Reset, you can use these parameters in calculated columns, measures, and visual calculations, and they refer to fields directly.
Not all functions provide these parameters. Visual calculation-exclusive functions don't provide a PartitionBy parameter. Window functions only provide a Reset parameter if you use them in a visual calculation. The Relation parameter on window functions is available whether or not you use it in a visual calculation, but it only accepts an Axis if you use it in a visual calculation.
Choose between these parameters
You don't need to specify all of these parameters, and you can combine them. To decide which parameter to use:
- Prefer Axis and Reset when you want field-agnostic behavior that follows the visual structure. Referring to the visual structure is more flexible than explicitly referencing fields.
- Use OrderBy and PartitionBy when you want to pin the calculation to specific fields regardless of the visual layout.
- Use PartitionBy instead of Reset when the axis has only one level. Reset expects multiple levels on the axis, so it doesn't work when there's only one field or when multiple fields exist in a single level on the axis.
Parameter pickers
Parameter pickers make it easy to select values for parameters in visual calculation functions. For example, in the following image, you see the Look up a value with totals template loaded:
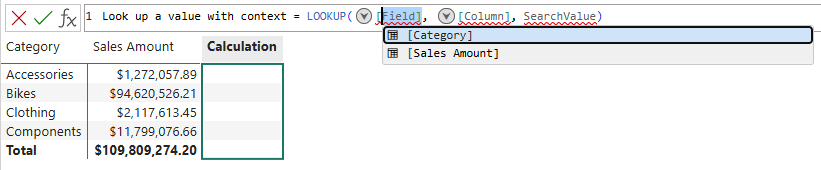
You can also activate the parameter pickers by using the CTRL+SPACE keyboard shortcut.
Visual calculation templates
Visual calculations include templates to make it easier to write common calculations. The template button in visual calculations edit mode opens a menu of available templates.
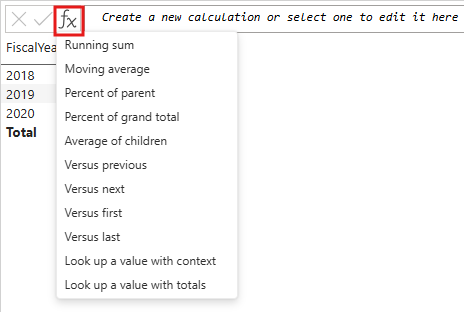
The following templates are available:
- Running sum. Calculates the sum of values, adding the current value to the preceding values. Uses the RUNNINGSUM function.
- Moving average. Calculates an average of a set of values in a given window by dividing the sum of the values by the size of the window. Uses the MOVINGAVERAGE function.
- Percent of parent. Calculates the percentage of a value relative to its parent. Uses the COLLAPSE function.
- Percent of grand total. Calculates the percentage of a value relative to all values, using the COLLAPSEALL function.
- Average of children. Calculates the average value of the set of child values. Uses the EXPAND function.
- Versus previous. Compares a value to a preceding value, using the PREVIOUS function.
- Versus next. Compares a value to a subsequent value, using the NEXT function.
- Versus first. Compares a value to the first value, using the FIRST function.
- Versus last. Compares a value to the last value, using the LAST function.
- Look up a value with context. Find a value or evaluate an expression on the visual matrix within the current context, using the LOOKUP function.
- Look up a value with totals. Find a value or evaluate an expression on the visual matrix with totals, using the LOOKUPWITHTOTALS function.
Hide fields on the visual
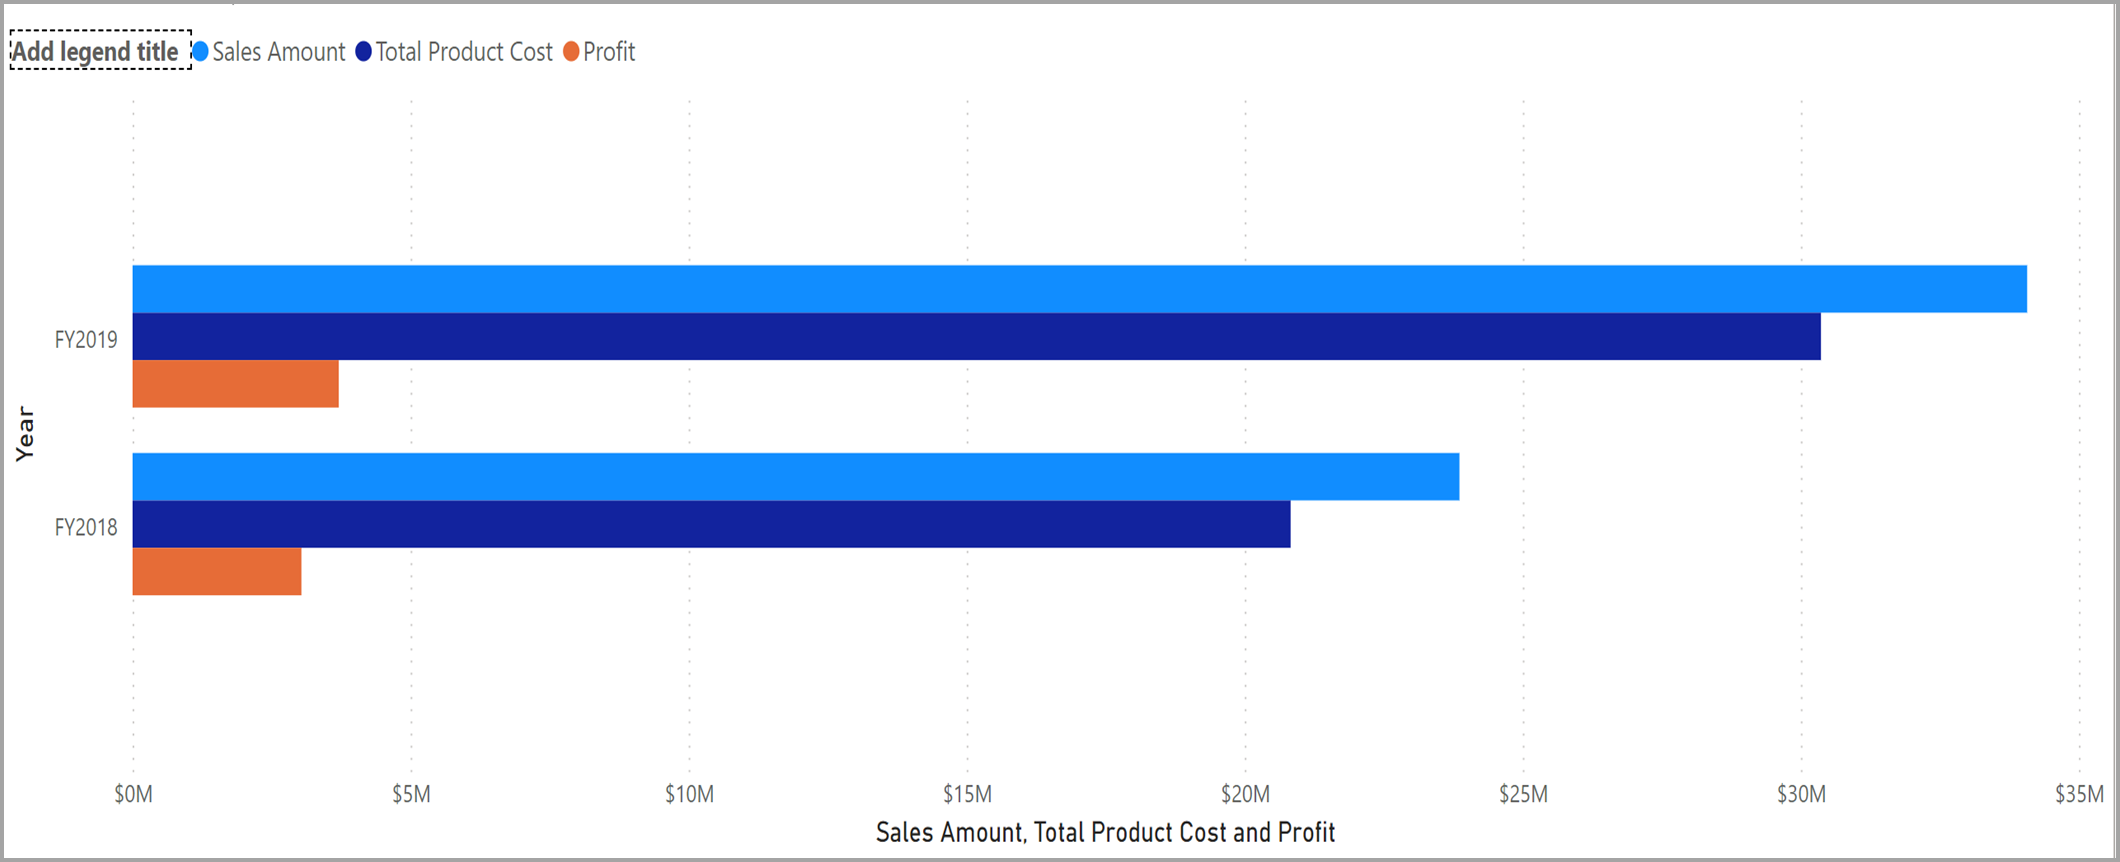
In visual calculations edit mode, you can hide fields from the visual just like you hide columns and tables in the modeling view. For example, to show only the Profit visual calculation, hide Sales Amount and Total Product Cost from view.
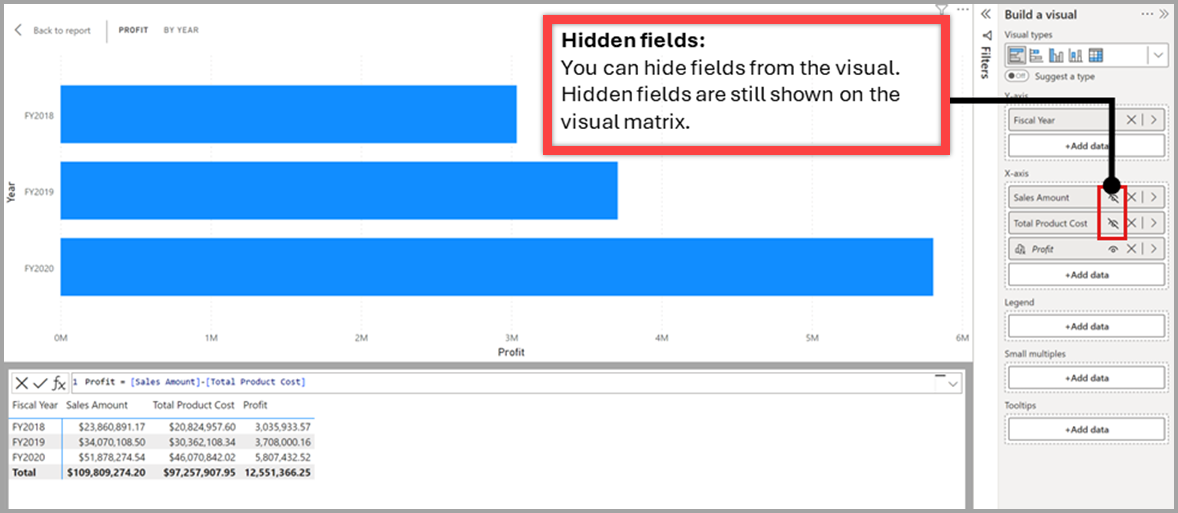
Hiding fields doesn't remove them from the visual or from the visual matrix, so your visual calculations can still refer to them and continue to work. A hidden field still appears on the visual matrix but isn't shown on the resulting visual. Only include hidden fields if they're necessary for your visual calculations to work.
Format a visual calculation
Format a visual calculation by using data types and formatting options, or by using a custom visual level format string. The Data format options in the General section of the formatting pane control the format.
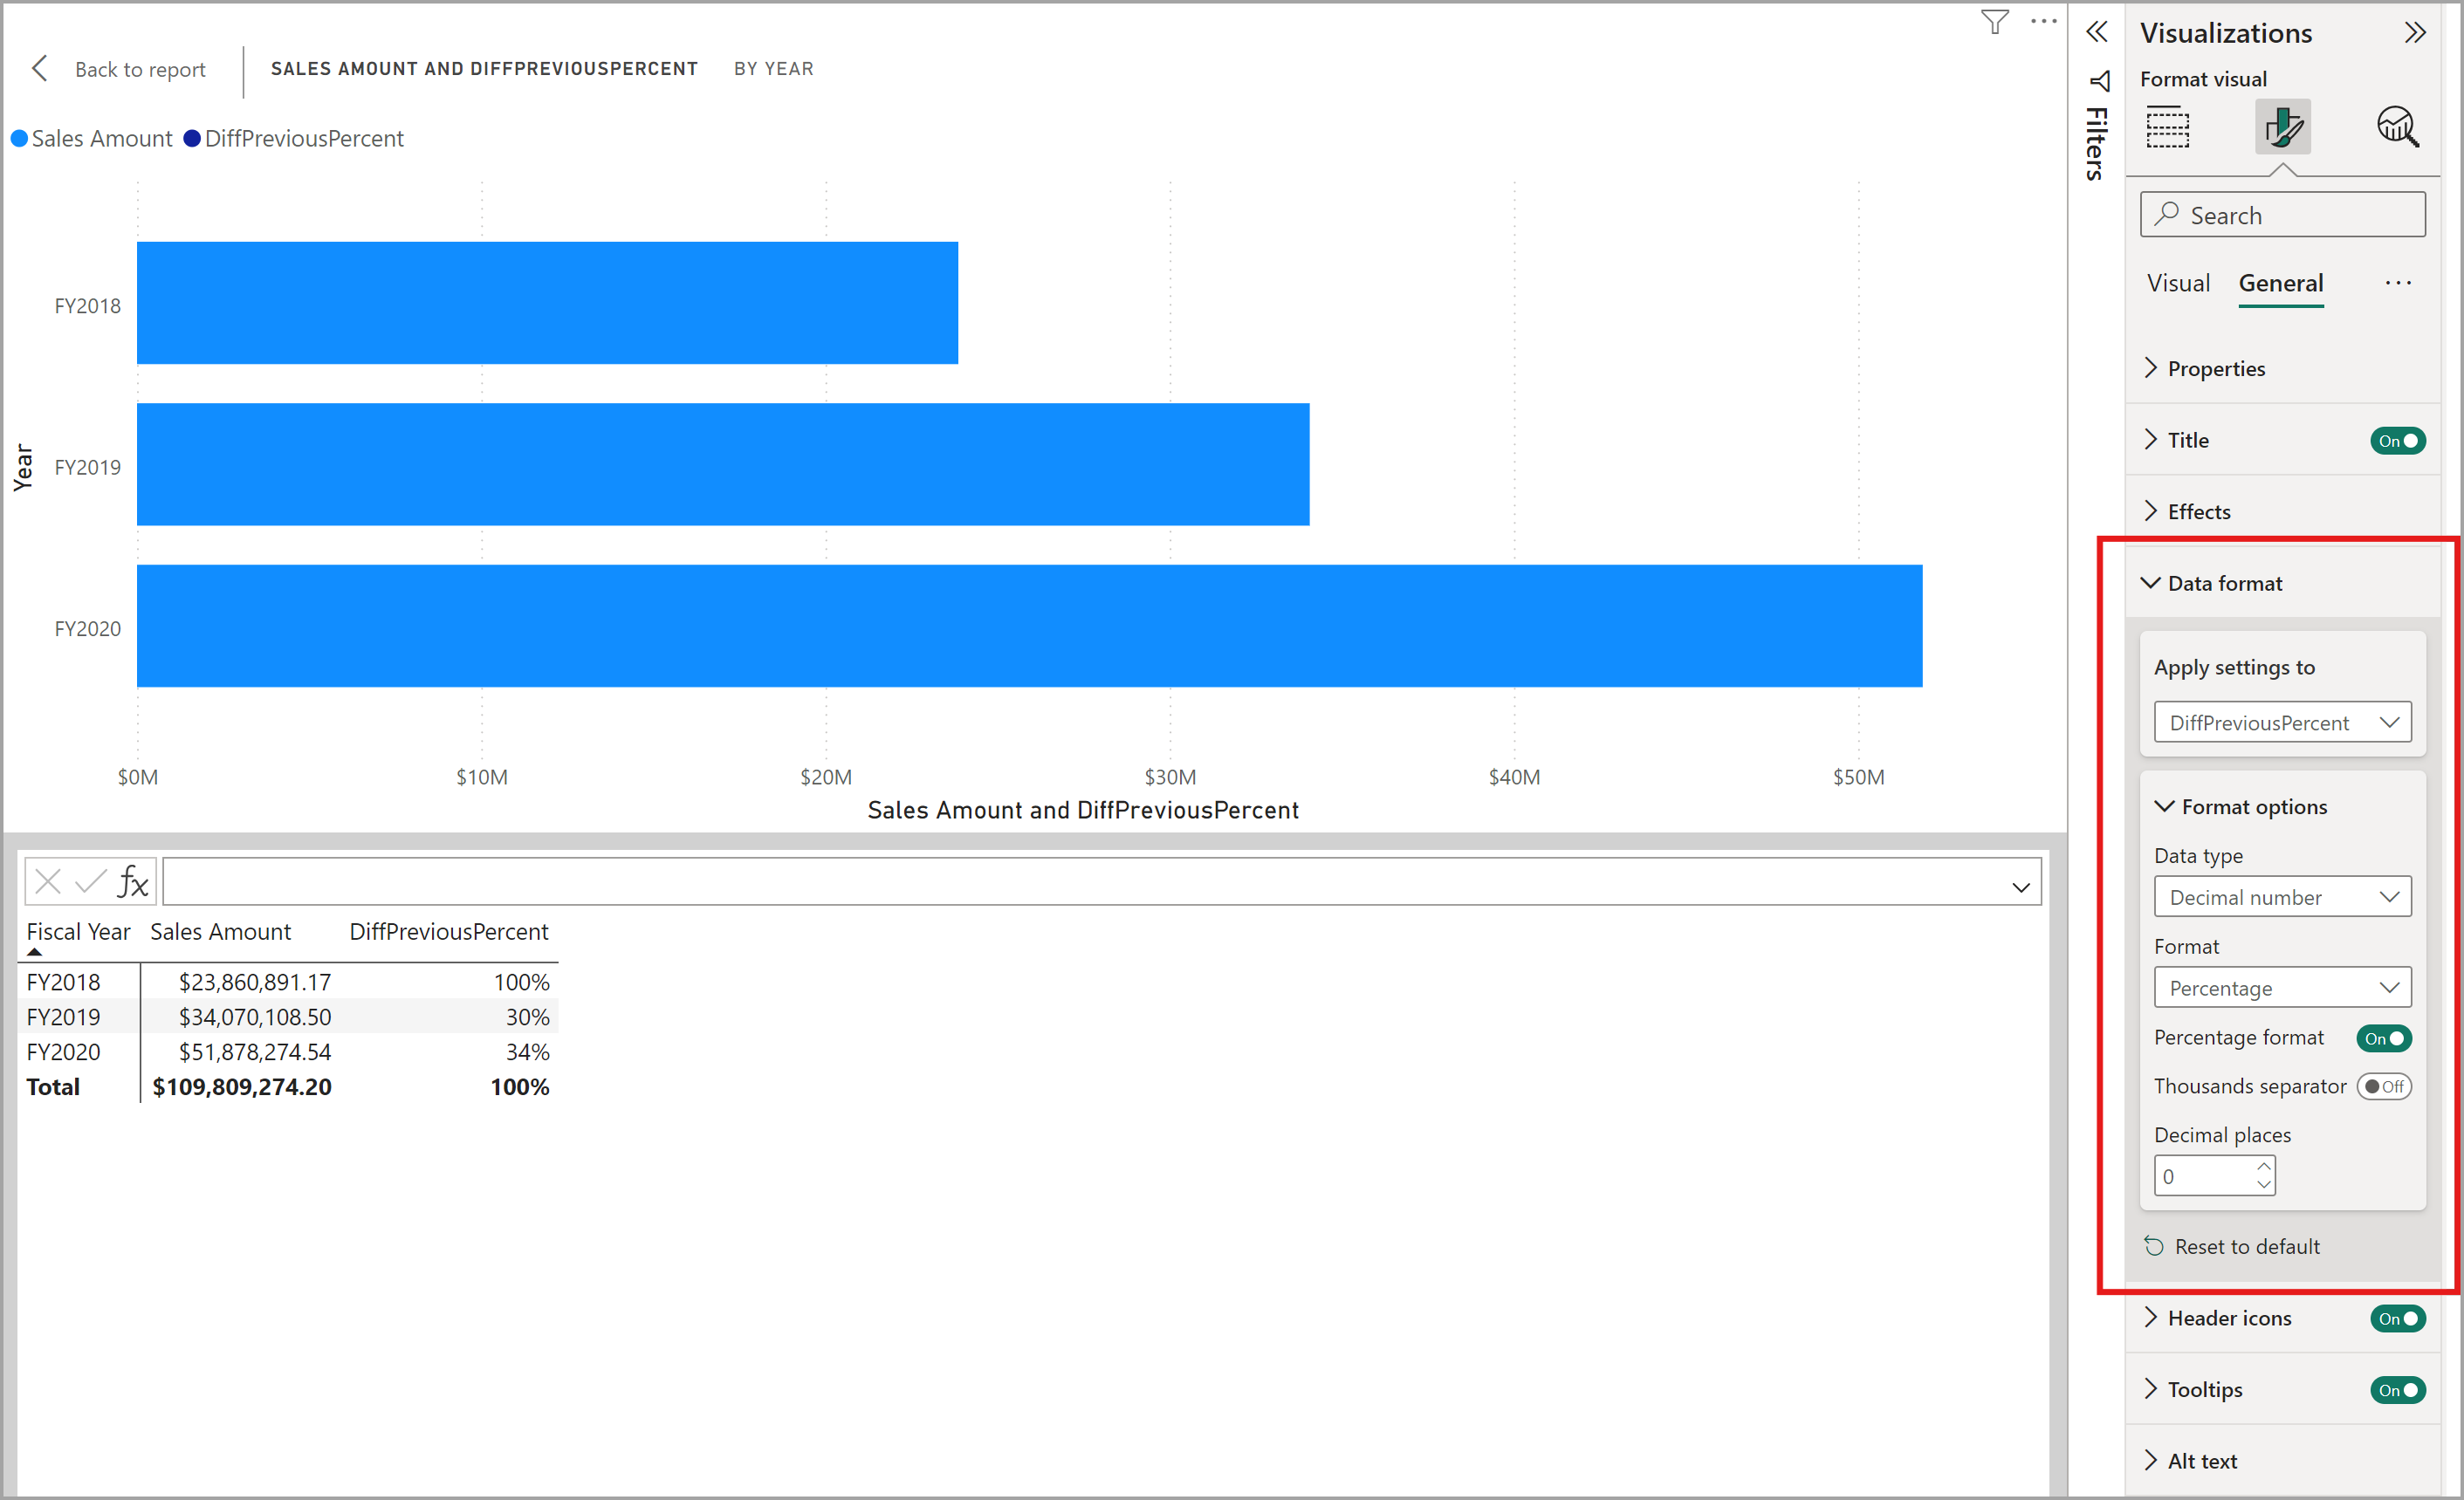
Considerations and limitations
Unsupported visual types
Visual calculations and hidden fields don't work with the following visuals:
- Slicer, R visual, Python visual
- Key Influencers, Decomposition Tree, Q&A, Smart Narrative
- Metrics, Paginated Report, Power Apps, Power Automate
- Small multiples, Play axis on Scatter chart
- Custom visuals
Unsupported features
The following features aren't available with visual calculations:
- Filtering, sorting, or changing aggregations
- Self-referencing (a calculation can't refer to itself)
- Copy/paste or reuse across visuals
- Data categories, data limits, or show items with no data
- Dynamic format strings (can't set or use as format string)
- Personalization of visual calculations or hidden fields
- See records drill-through
- IntelliSense in Power BI embedded
Publishing and sharing limitations
- Can't pin to dashboards
- Can't use Publish to web
- Data exports exclude visual calculation results; hidden fields only appear in underlying data exports
Other limitations
- Field parameters work with visual calculations but have some limitations.
- Live connections to SQL Server Analysis Services require version 2025 or later.
Related content
For more information on using visual calculations, see the following resources:
- Create visual calculations
- Training module: Create visual calculations in Power BI Desktop
- Use calculations options in Power BI Desktop
- Create measures for data analysis in Power BI Desktop
- Create and format table visualizations in Power BI - includes custom totals, which are powered by visual calculations.