Note
Ang pag-access sa pahinang ito ay nangangailangan ng pahintulot. Maaari mong subukang mag-sign in o magpalit ng mga direktoryo.
Ang pag-access sa pahinang ito ay nangangailangan ng pahintulot. Maaari mong subukang baguhin ang mga direktoryo.
In this section of the tutorial, you create a semantic model from your lakehouse data and define the relationships between fact and dimension tables. With the data model in place, you can build Power BI reports.
Prerequisites
Before you begin, you must complete the previous tutorials in this series:
Create a semantic model
Power BI is natively integrated in Fabric. When you create a semantic model from a lakehouse, it uses Direct Lake mode, which loads data directly from OneLake into memory for fast analysis without importing or duplicating data.
In your browser, go to your Fabric workspace in the Fabric portal.
Select the wwilakehouse lakehouse to open it.
Select SQL analytics endpoint from the Lakehouse dropdown menu at the top right of the screen.
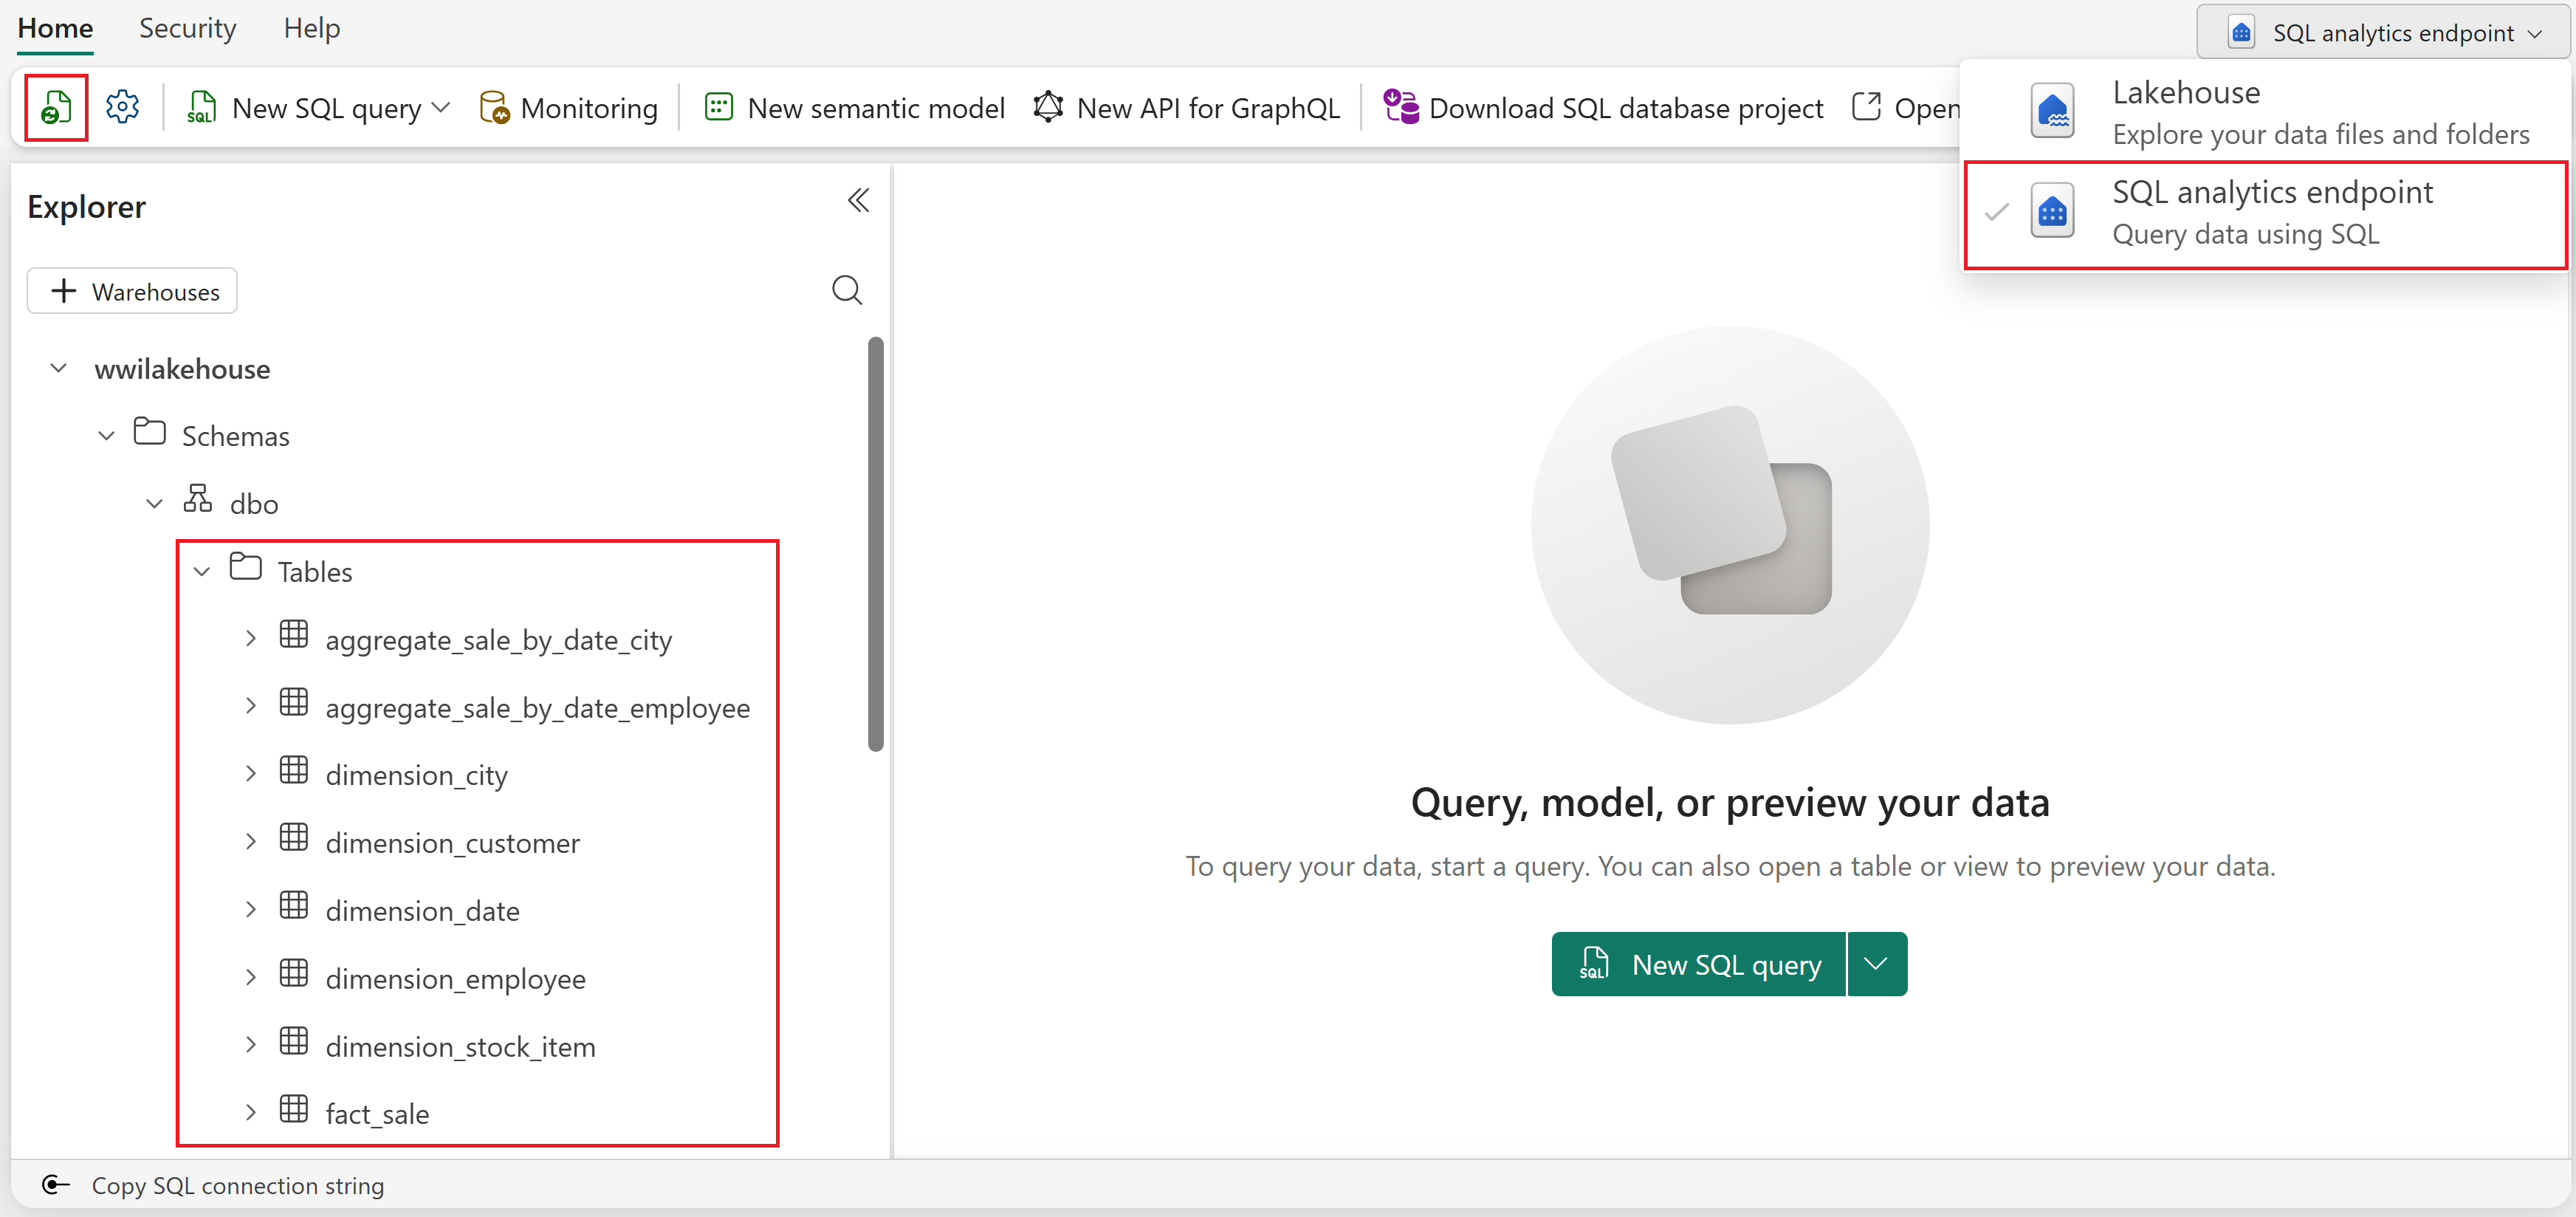
From the SQL analytics endpoint pane, you should be able to see all the tables you created. If you don't see them yet, select the Refresh icon at the top left.
Select New semantic model from the ribbon.
In the New semantic model dialog box:
- Enter a name for your semantic model (for example, "WWI Sales Model")
- Select the workspace to save it in
- Select all the tables you created in this tutorial series
- Select Confirm

Troubleshoot missing tables with lakehouse schemas
If you enabled lakehouse schemas and get an error like "We can't access the source Delta table" when creating the semantic model, the tables might not be registered in the Spark metastore. To resolve the issue, open a notebook attached to your lakehouse and run the following code to explicitly register the tables:
Tip
You can go back to the notebook you used in the previous tutorial and add this code as a new cell instead of creating a new notebook.
tables = ['fact_sale', 'dimension_city', 'dimension_customer', 'dimension_date',
          'dimension_employee', 'dimension_stock_item',
          'aggregate_sale_by_date_city', 'aggregate_sale_by_date_employee']

for table in tables:
    df = spark.read.format("delta").load(f"Tables/{table}")
    df.write.mode("overwrite").option("overwriteSchema", "true").format("delta").saveAsTable(table)
After the code runs successfully, go back to the SQL analytics endpoint and create the semantic model again.
Define table relationships
To create reports that combine data from multiple tables, you define relationships between the fact table and each dimension table. These relationships tell Power BI how to join the tables when building visualizations.
Go to your workspace and select the semantic model you created to open it.
Select Open from the toolbar to open the web modeling experience.
In the top right corner, select the dropdown and choose Editing to switch to editing mode.
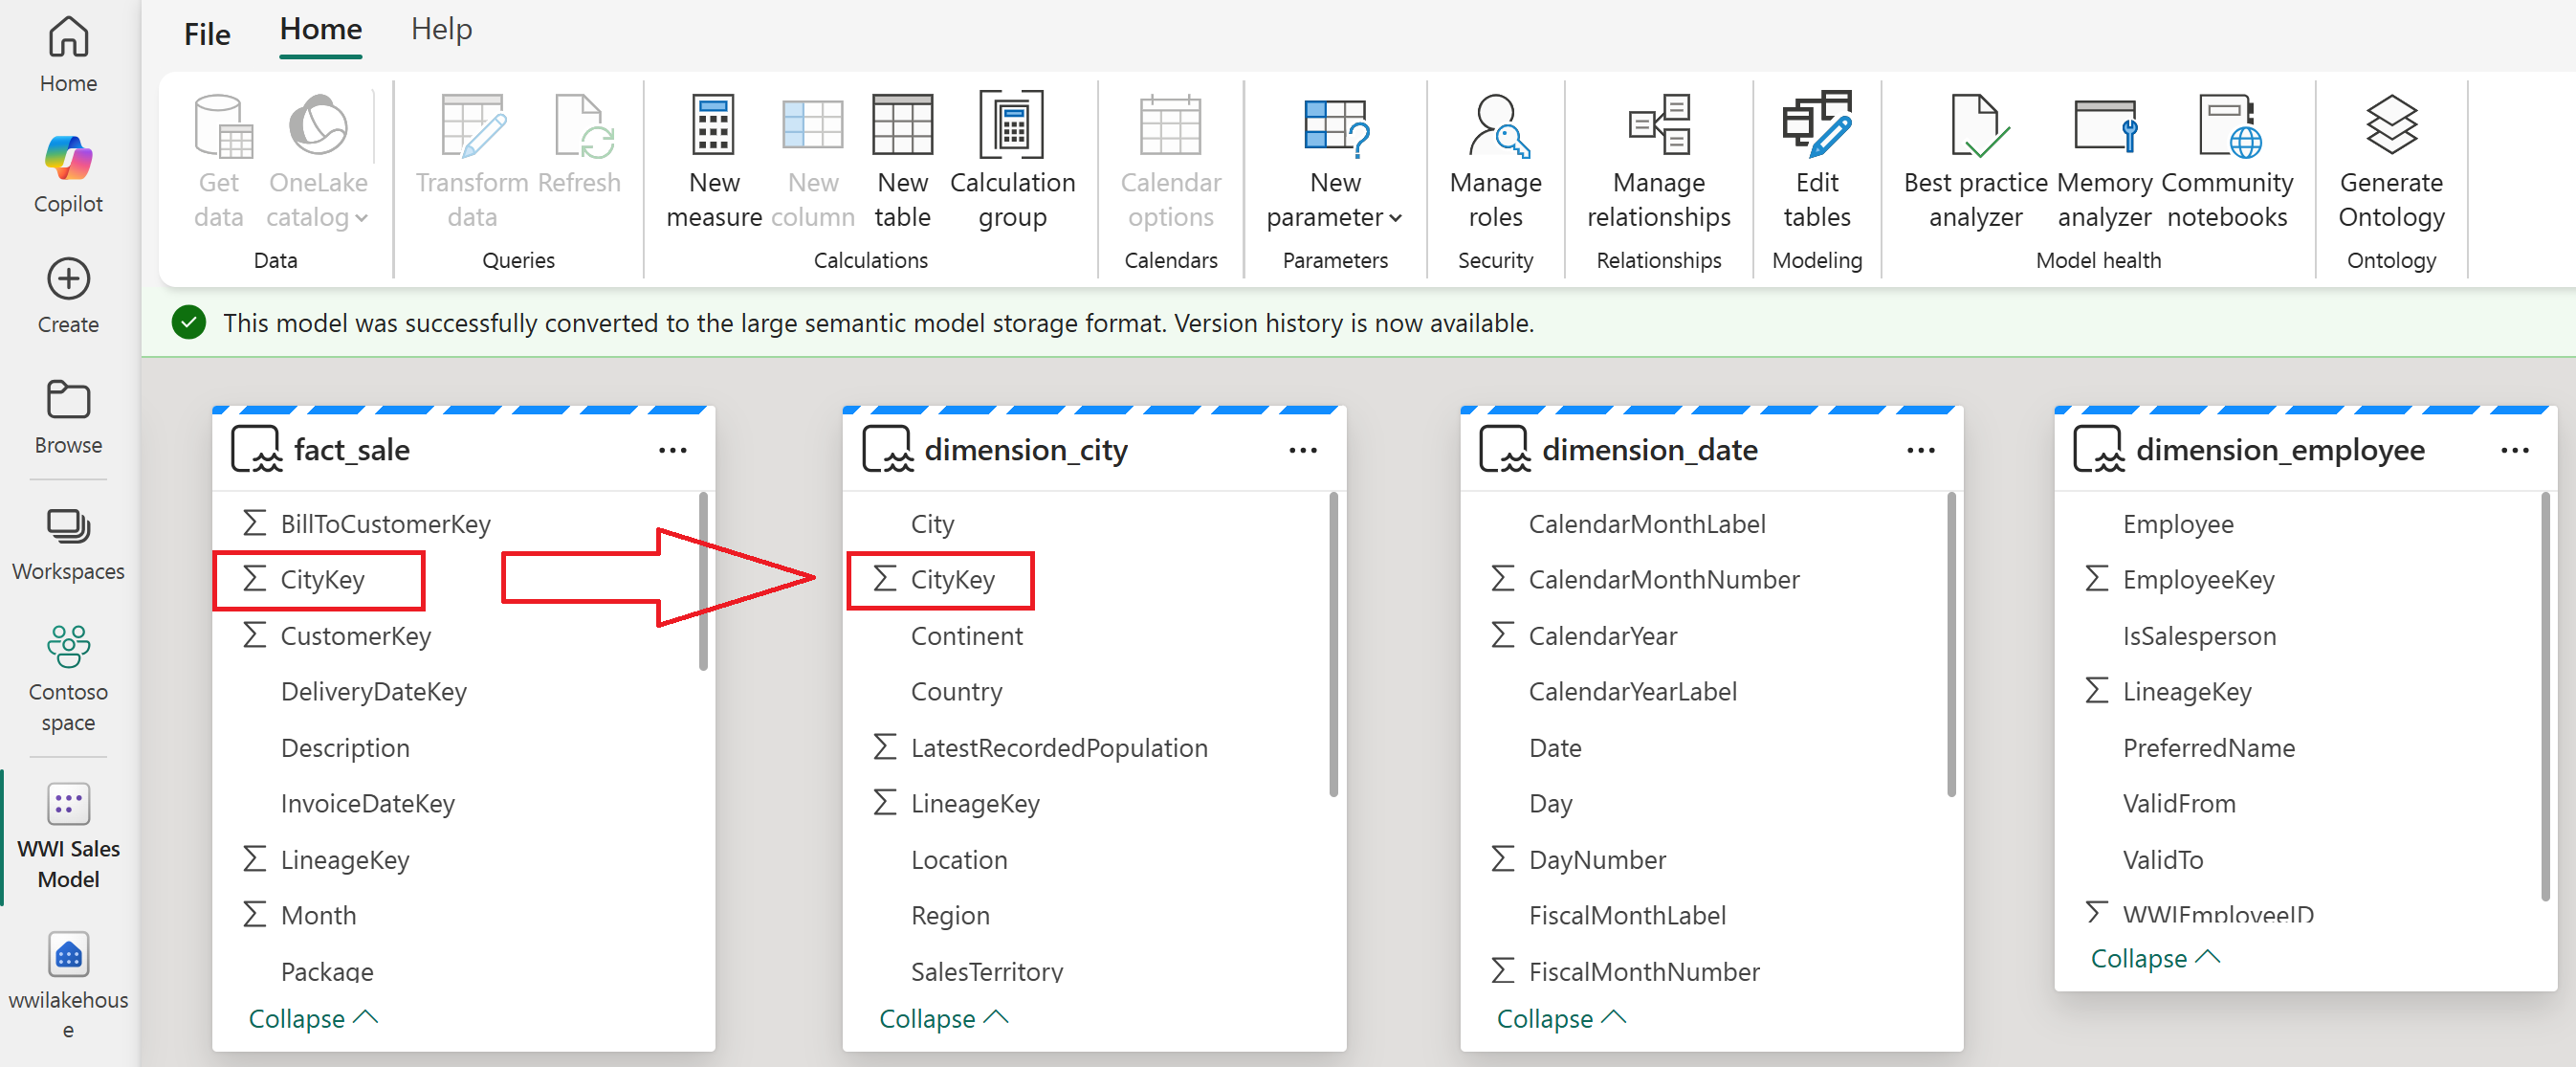
From the fact_sale table, select and drag the CityKey field to the CityKey field in the dimension_city table to create a relationship.
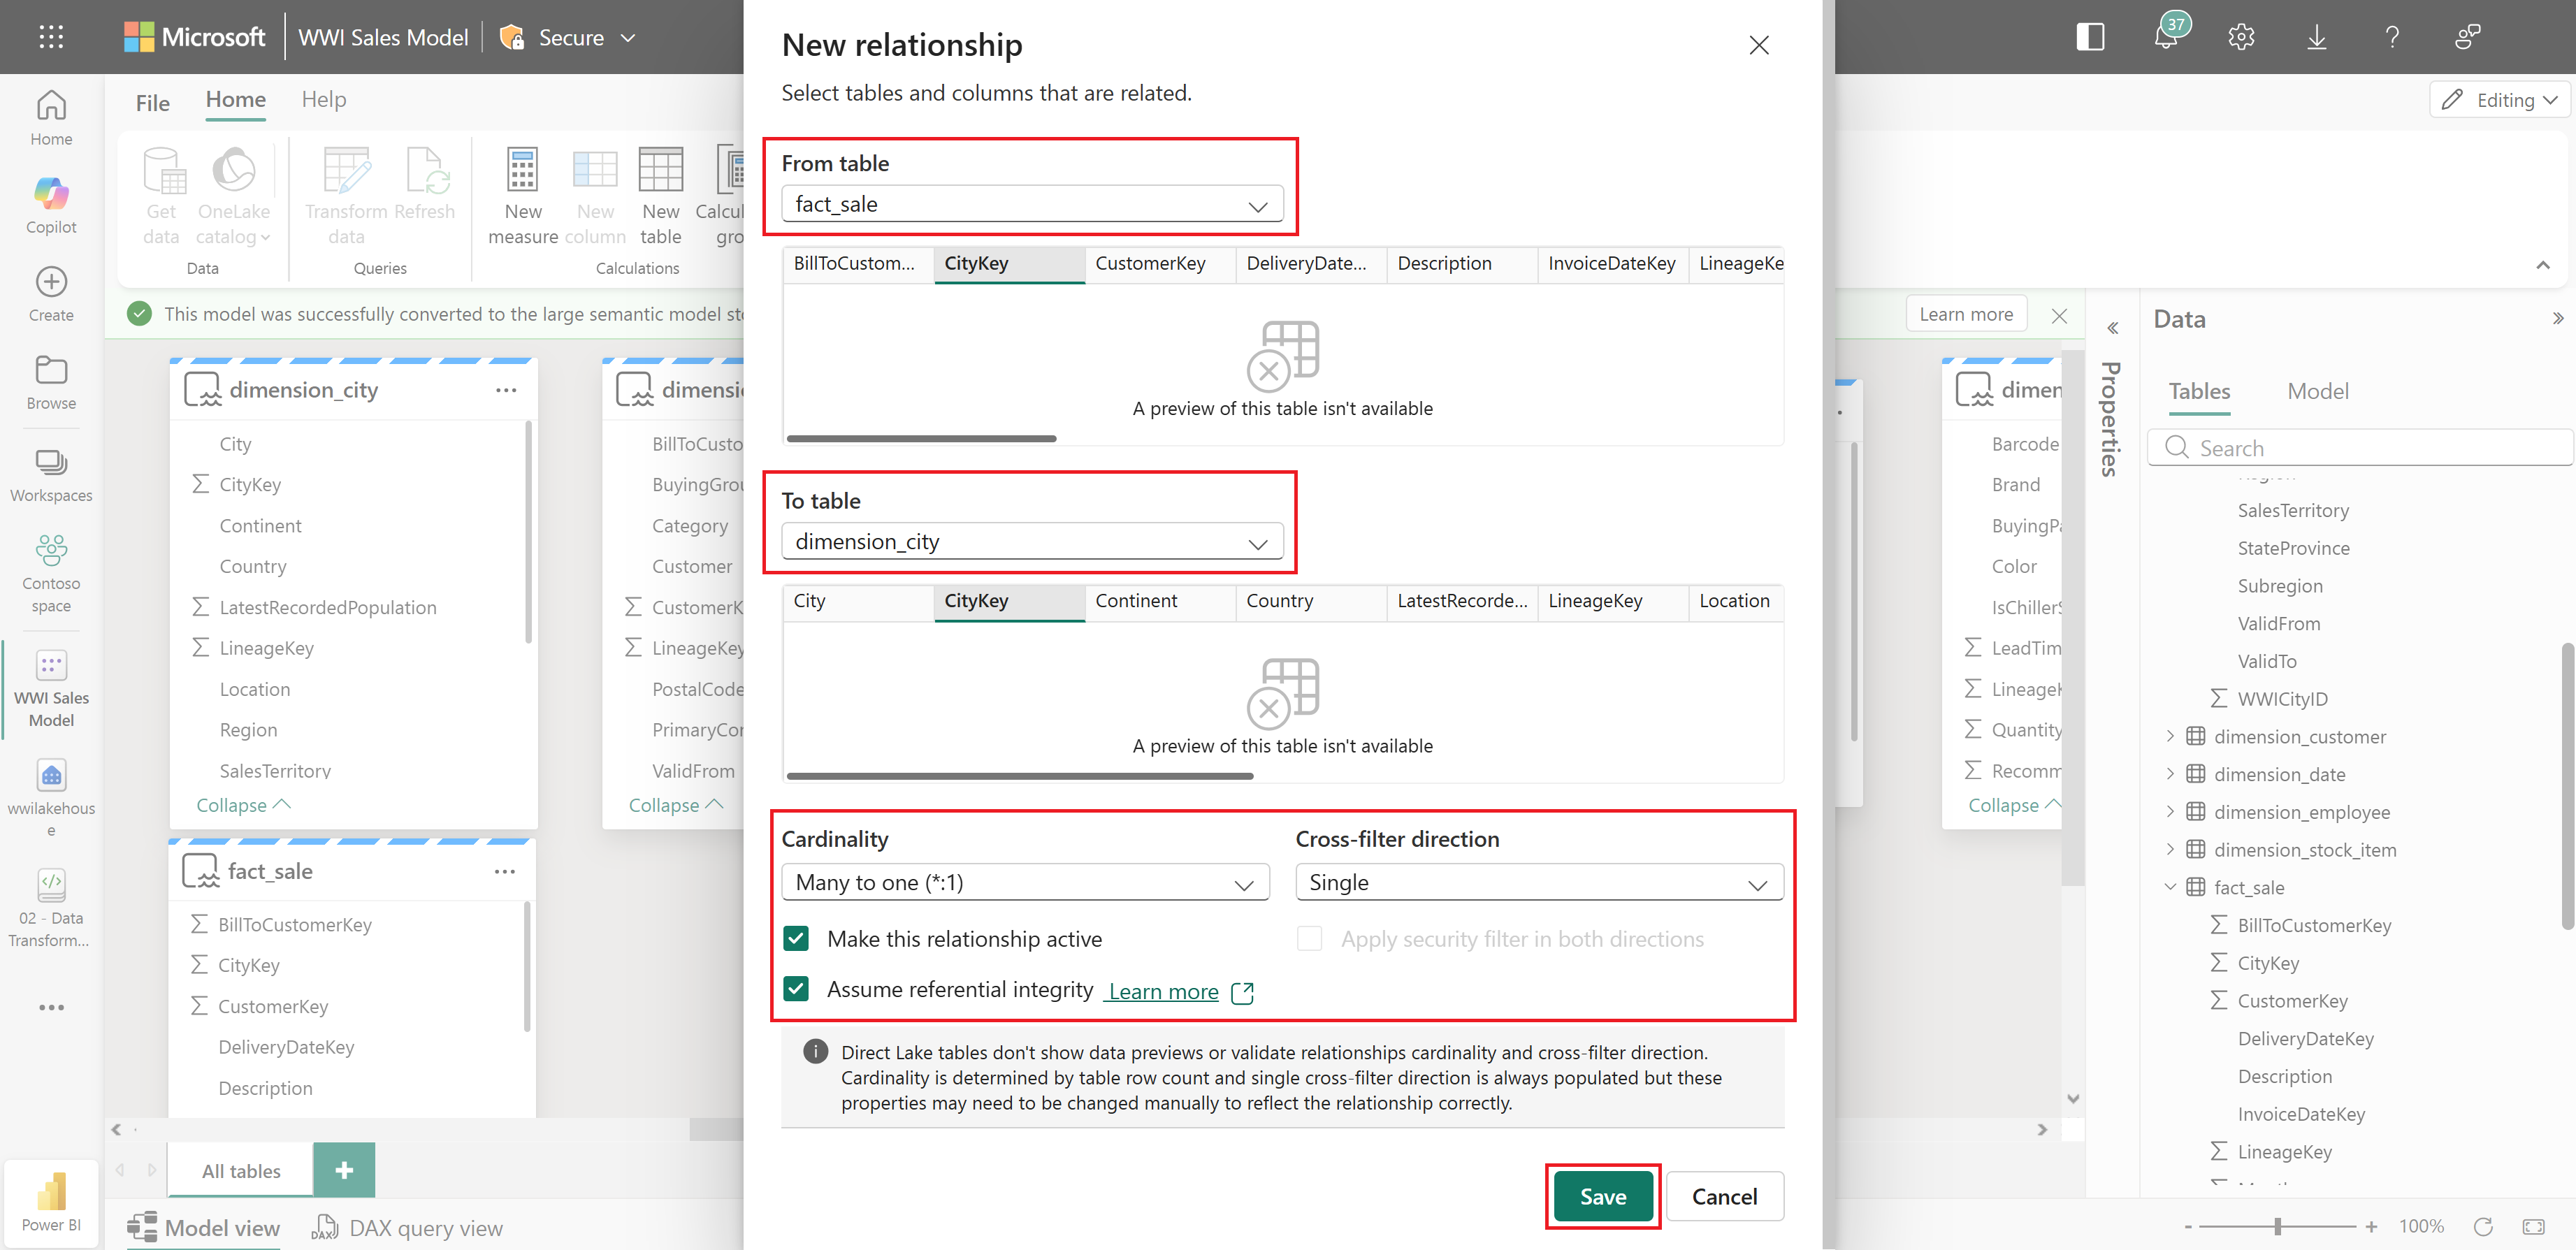
The New relationship dialog box appears with the following default settings:
- From table: fact_sale and the column CityKey.
- To table: dimension_city and the column CityKey.
- Cardinality: Many to one (*:1).
- Cross filter direction: Single.
- Make this relationship active: selected.
Select the box next to Assume referential integrity, and then select Save.
Note
When defining relationships for this report, make sure fact_sale is always the From table and the dimension_* table is the To table, not vice versa.
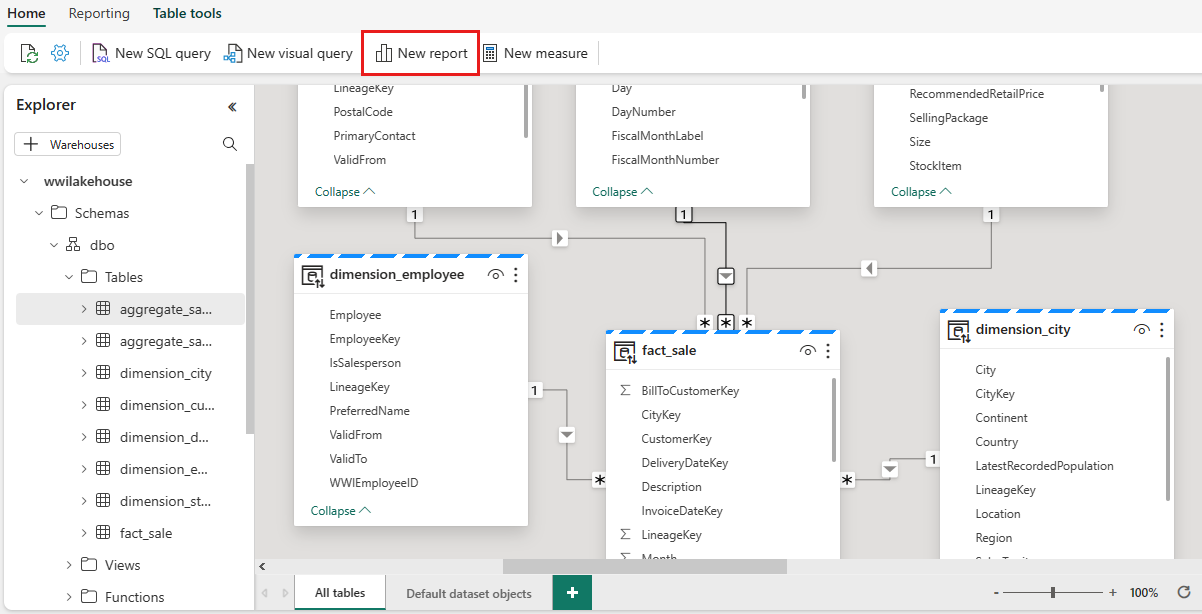
Repeat the previous steps to create relationships for the remaining dimension tables. For each relationship, select and drag the key column from fact_sale to the matching column in the dimension table. Use the same New relationship settings as before, including Assume referential integrity.
Drag from fact_sale To table To column StockItemKey dimension_stock_item StockItemKey SalespersonKey dimension_employee EmployeeKey CustomerKey dimension_customer CustomerKey InvoiceDateKey dimension_date Date After you add these relationships, your data model is ready for reporting as shown in the following image:


Build a report
With the semantic model and relationships in place, your data model is ready for reporting. From the semantic model, select New report in the ribbon to open the Power BI report canvas where you can create visualizations using your data.
To learn more about creating reports, see Create reports on semantic models in Microsoft Fabric.