Tutorial: Memantau kluster Service Fabric pada Azure
Pemantauan dan diagnostik sangat penting untuk mengembangkan, menguji, dan menyebarkan beban kerja di lingkungan cloud apa pun. Tutorial ini adalah bagian kedua dari rangkaian, dan menunjukkan kepada Anda cara memantau dan mendiagnosis kluster Service Fabric menggunakan aktivitas, penghitung kinerja, dan laporan kesehatan. Untuk informasi lebih lanjut, baca gambaran umum tentang pemantauan kluster dan pemantauan infrastruktur.
Dalam tutorial ini, Anda akan mempelajari cara:
- Lihat aktivitas Service Fabric
- Mengajukan kueri EventStore API for peristiwa kluster
- Memantau infrastruktur/mengumpulkan penghitung perf
- Lihat laporan kesehatan kluster
Dalam tutorial ini, Anda akan belajar cara:
- Membuat kluster Windows yang aman di Azure menggunakan templat
- Memantau kluster
- Menskalakan kluster lebih kecil atau lebih besar
- Meningkatkan runtime kluster
- Menghapus Kluster
Catatan
Sebaiknya Anda menggunakan modul Azure Az PowerShell untuk berinteraksi dengan Azure. Untuk memulai, lihat Menginstal Azure PowerShell. Untuk mempelajari cara bermigrasi ke modul Az PowerShell, lihat Memigrasikan Azure PowerShell dari AzureRM ke Az.
Prasyarat
Sebelum Anda memulai tutorial ini:
- Jika Anda tidak memiliki langganan Azure, buatlah akun gratis
- Pasang Azure PowerShell atau Azure CLI.
- Membuat kluster Windows yang aman
- Mengatur pengumpulan diagnostik untuk kluster
- Mengaktifkan layanan EventStore pada kluster
- Mengonfigurasi log Azure Monitor dan agen Analitik Log untuk kluster
Lihat peristiwa Service Fabric menggunakan log Azure Monitor
Log Azure Monitor mengumpulkan dan menganalisis telemetri dari aplikasi dan layanan yang dihosting di cloud dan menyediakan alat analisis untuk membantu Anda memaksimalkan ketersediaan dan kinerjanya. Anda dapat menjalankan kueri di log Monitor Azure untuk mendapatkan wawasan dan memecahkan masalah apa yang terjadi pada kluster.
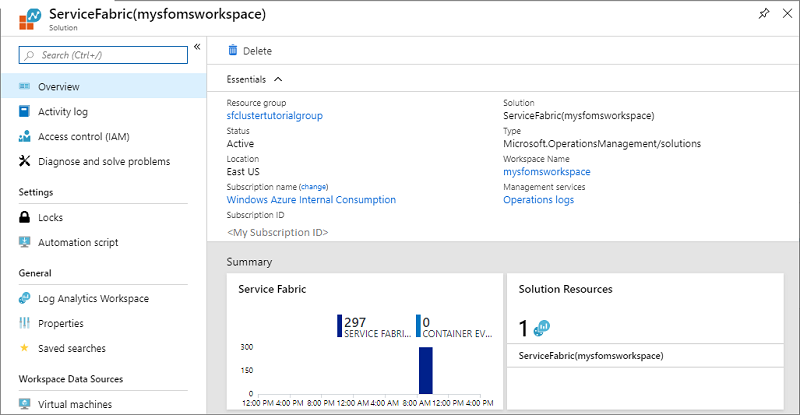
Untuk mengakses solusi Service Fabric Analytics, buka portal Azure dan pilih grup sumber daya tempat Anda membuat solusi Service Fabric Analytics.
Pilih sumber daya ServiceFabric(mysfomsworkspace).
Pada Ringkasan Anda melihat petak peta dalam bentuk grafik untuk setiap solusi yang diaktifkan, termasuk yang untuk Service Fabric. Klik grafik Service Fabric untuk melanjutkan ke solusi Service Fabric Analytics.
Gambar berikut menunjukkan halaman beranda solusi Service Fabric Analytics. Halaman beranda ini menyediakan tampilan snapshot tentang apa yang terjadi di kluster Anda.
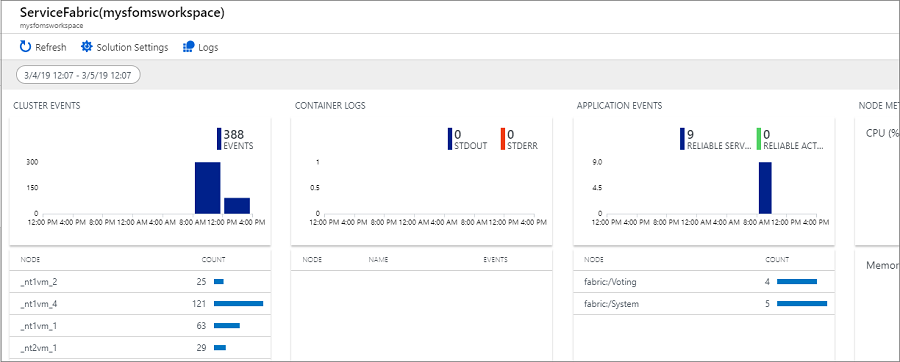
Jika Anda mengaktifkan diagnostik pada pembuatan kluster, Anda dapat melihat peristiwa untuk
- Peristiwa kluster Service Fabric
- Peristiwa model pemrograman Reliable Actor
- Peristiwa model pemrograman Reliable Service
Catatan
Selain peristiwa Service Fabric out of the box, peristiwa sistem yang lebih terperinci dapat dikumpulkan dengan memperbarui konfigurasi ekstensi diagnostik Anda.
Lihat Peristiwa Service Fabric, termasuk tindakan pada node
Pada halaman Service Fabric Analytics, klik grafik untuk Aktivitas kluster. Log untuk semua aktivitas sistem yang telah dikumpulkan muncul. Sebagai referensi, ini berasal dari WADServiceFabricSystemEventsTable di akun Penyimpanan Azure, dan demikian pula reliable service dan reliable actor yang Anda lihat selanjutnya berasal dari tabel masing-masing.
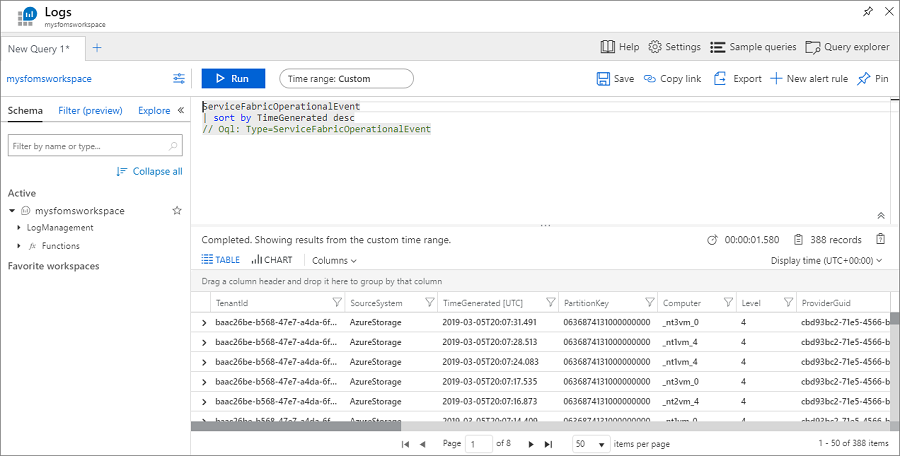
Kueri menggunakan bahasa kueri Kusto, yang bisa Anda ubah untuk memperbaiki apa yang Anda cari. Misalnya, untuk menemukan semua tindakan yang diambil pada node di kluster, Anda dapat menggunakan kueri berikut. ID peristiwa yang digunakan di bawah ini ditemukan dalam referensi peristiwa saluran operasional.
ServiceFabricOperationalEvent
| where EventId < 25627 and EventId > 25619
Bahasa kueri Kusto sangat kuat. Berikut adalah beberapa kueri berguna lainnya.
Buat tabel pencarian ServiceFabricEvent sebagai fungsi yang ditentukan pengguna dengan menyimpan kueri sebagai fungsi dengan alias ServiceFabricEvent:
let ServiceFabricEvent = datatable(EventId: int, EventName: string)
[
    ...
    18603, 'NodeUpOperational',
    18604, 'NodeDownOperational',
    ...
];
ServiceFabricEvent
Kembalikan aktivitas operasional yang terekam dalam satu jam terakhir:
ServiceFabricOperationalEvent
| where TimeGenerated > ago(1h)
| join kind=leftouter ServiceFabricEvent on EventId
| project EventId, EventName, TaskName, Computer, ApplicationName, EventMessage, TimeGenerated
| sort by TimeGenerated
Kembalikan aktivitas operasional dengan EventId == 18604 dan EventName == 'NodeDownOperational':
ServiceFabricOperationalEvent
| where EventId == 18604
| project EventId, EventName = 'NodeDownOperational', TaskName, Computer, EventMessage, TimeGenerated
| sort by TimeGenerated
Kembalikan aktivitas operasional dengan EventId == 18604 dan EventName == 'NodeUpOperational':
ServiceFabricOperationalEvent
| where EventId == 18603
| project EventId, EventName = 'NodeUpOperational', TaskName, Computer, EventMessage, TimeGenerated
| sort by TimeGenerated
Kembalikan Laporan Kesehatan dengan HealthState == 3 (Kesalahan) dan mengekstrak properti tambahan dari bidang EventMessage:
ServiceFabricOperationalEvent
| join kind=leftouter ServiceFabricEvent on EventId
| extend HealthStateId = extract(@"HealthState=(\S+) ", 1, EventMessage, typeof(int))
| where TaskName == 'HM' and HealthStateId == 3
| extend SourceId = extract(@"SourceId=(\S+) ", 1, EventMessage, typeof(string)),
         Property = extract(@"Property=(\S+) ", 1, EventMessage, typeof(string)),
         HealthState = case(HealthStateId == 0, 'Invalid', HealthStateId == 1, 'Ok', HealthStateId == 2, 'Warning', HealthStateId == 3, 'Error', 'Unknown'),
         TTL = extract(@"TTL=(\S+) ", 1, EventMessage, typeof(string)),
         SequenceNumber = extract(@"SequenceNumber=(\S+) ", 1, EventMessage, typeof(string)),
         Description = extract(@"Description='([\S\s, ^']+)' ", 1, EventMessage, typeof(string)),
         RemoveWhenExpired = extract(@"RemoveWhenExpired=(\S+) ", 1, EventMessage, typeof(bool)),
         SourceUTCTimestamp = extract(@"SourceUTCTimestamp=(\S+)", 1, EventMessage, typeof(datetime)),
         ApplicationName = extract(@"ApplicationName=(\S+) ", 1, EventMessage, typeof(string)),
         ServiceManifest = extract(@"ServiceManifest=(\S+) ", 1, EventMessage, typeof(string)),
         InstanceId = extract(@"InstanceId=(\S+) ", 1, EventMessage, typeof(string)),
         ServicePackageActivationId = extract(@"ServicePackageActivationId=(\S+) ", 1, EventMessage, typeof(string)),
         NodeName = extract(@"NodeName=(\S+) ", 1, EventMessage, typeof(string)),
         Partition = extract(@"Partition=(\S+) ", 1, EventMessage, typeof(string)),
         StatelessInstance = extract(@"StatelessInstance=(\S+) ", 1, EventMessage, typeof(string)),
         StatefulReplica = extract(@"StatefulReplica=(\S+) ", 1, EventMessage, typeof(string))
Kembalikan bagan waktu aktivitas dengan EventId != 17523:
ServiceFabricOperationalEvent
| join kind=leftouter ServiceFabricEvent on EventId
| where EventId != 17523
| summarize Count = count() by Timestamp = bin(TimeGenerated, 1h), strcat(tostring(EventId), " - ", case(EventName != "", EventName, "Unknown"))
| render timechart
Dapatkan aktivitas operasional Service Fabric yang diagregasikan dengan layanan dan node tertentu:
ServiceFabricOperationalEvent
| where ApplicationName  != "" and ServiceName != ""
| summarize AggregatedValue = count() by ApplicationName, ServiceName, Computer
Render hitungan peristiwa Service Fabric menurut EventId / EventName menggunakan kueri lintas sumber daya:
app('PlunkoServiceFabricCluster').traces
| where customDimensions.ProviderName == 'Microsoft-ServiceFabric'
| extend EventId = toint(customDimensions.EventId), TaskName = tostring(customDimensions.TaskName)
| where EventId != 17523
| join kind=leftouter ServiceFabricEvent on EventId
| extend EventName = case(EventName != '', EventName, 'Undocumented')
| summarize ["Event Count"]= count() by bin(timestamp, 30m), EventName = strcat(tostring(EventId), " - ", EventName)
| render timechart
Lihat aktivitas aplikasi Service Fabric
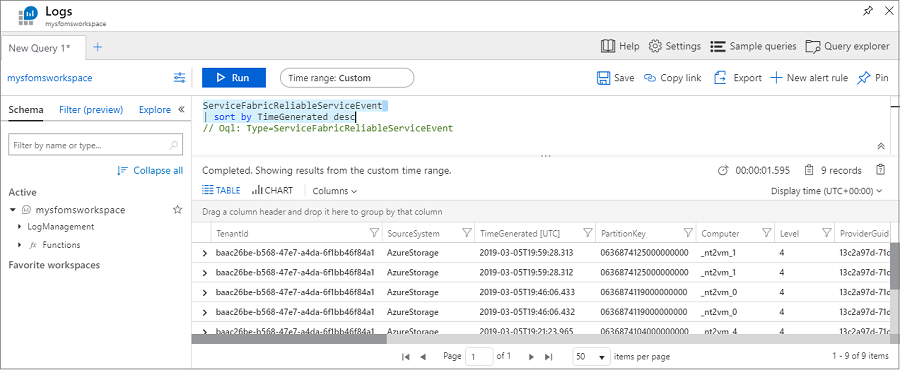
Anda dapat melihat aktivitas untuk layanan yang andal dan aplikasi aktor andal yang disebarkan pada kluster. Pada halaman Service Fabric Analytics, klik grafik untuk Aktivitas Aplikasi.
Jalankan kueri berikut ini untuk melihat peristiwa dari aplikasi layanan anda yang andal:
ServiceFabricReliableServiceEvent
| sort by TimeGenerated desc
Anda dapat melihat berbagai aktivitas ketika layanan runasync dimulai dan selesai yang biasanya terjadi pada penyebaran dan peningkatan.
Anda juga dapat menemukan peristiwa untuk layanan yang andal dengan ServiceName == "fabric:/Watchdog/WatchdogService":
ServiceFabricReliableServiceEvent
| where ServiceName == "fabric:/Watchdog/WatchdogService"
| project TimeGenerated, EventMessage
| order by TimeGenerated desc
Aktivitas aktor yang andal dapat dilihat dengan cara yang serupa:
ServiceFabricReliableActorEvent
| sort by TimeGenerated desc
Untuk mengonfigurasi aktivitas yang lebih terperinci untuk aktor yang andal, Anda perlu mengubah scheduledTransferKeywordFilter di konfigurasi untuk ekstensi diagnostik pada template kluster. Detail tentang nilai-nilai untuk ini ada dalam referensi peristiwa reliable actor.
"EtwEventSourceProviderConfiguration": [
                {
                    "provider": "Microsoft-ServiceFabric-Actors",
                    "scheduledTransferKeywordFilter": "1",
                    "scheduledTransferPeriod": "PT5M",
                    "DefaultEvents": {
                    "eventDestination": "ServiceFabricReliableActorEventTable"
                    }
                },
Lihat penghitung kinerja dengan log Azure Monitor
Untuk melihat penghitung kinerja, buka portal Azure dan grup sumber daya tempat Anda membuat solusi Service Fabric Analytics.
Pilih sumber daya ServiceFabric(mysfomsworkspace), lalu Log Analytics Workspace, dan lalu Pengaturan Tingkat Lanjut.
Klik Data, lalu klik Penghitung Performa Windows. Ada daftar penghitung default yang dapat Anda pilih untuk diaktifkan dan Anda juga dapat mengatur interval pengumpulannya. Anda juga dapat menambahkan penghitung kinerja tambahan untuk dikumpulkan. Format yang tepat direferensikan dalam artikel ini. Klik Simpan, lalu klik OK.
Tutup bilah Pengaturan Tingkat Lanjut dan pilih Ringkasan ruang kerja di bawah judul Umum. Untuk setiap solusi yang diaktifkan ada petak peta grafis, termasuk untuk Service Fabric. Klik grafik Service Fabric untuk melanjutkan ke solusi Service Fabric Analytics.
Ada petak peta grafis untuk saluran operasional dan acara layanan yang andal. Representasi grafis aliran data untuk penghitung yang telah Anda pilih akan muncul di bawah Metrik Node.
Pilih grafik Metrik Kontainer untuk melihat detail tambahan. Anda juga dapat mengkueri data penghitung kinerja yang serupa dengan peristiwa kluster dan filter pada node, nama penghitung perf, dan nilai menggunakan bahasa kueri Kusto.
Mengkueri layanan EventStore
Layanan EventStore menyediakan cara untuk memahami keadaan kluster atau beban kerja Anda pada titik waktu tertentu. EventStore adalah layanan Service Fabric yang kuat yang menyimpan peristiwa dari kluster. Aktivitas diekspos melalui Service Fabric Explorer, REST, dan API. EventStore mengkueri kluster secara langsung untuk mendapatkan data diagnostik pada entitas apa pun di kluster Anda Untuk melihat daftar lengkap peristiwa yang tersedia di EventStore, lihat Aktivitas Service Fabric.
API EventStore dapat dikueri secara terprogram menggunakan Pustaka klien Service Fabric.
Berikut adalah contoh permintaan untuk semua aktivitas kluster antara 2018-04-03T18:00:00Z dan 2018-04-04T18:00:00Z, melalui fungsi GetClusterEventListAsync.
var sfhttpClient = ServiceFabricClientFactory.Create(clusterUrl, settings);

var clstrEvents = sfhttpClient.EventsStore.GetClusterEventListAsync(
    "2018-04-03T18:00:00Z",
    "2018-04-04T18:00:00Z")
    .GetAwaiter()
    .GetResult()
    .ToList();
Berikut adalah contoh lain yang meminta kueri untuk kesehatan kluster dan semua peristiwa simpul pada bulan September 2018 dan mencetaknya.
const int timeoutSecs = 60;
var clusterUrl = new Uri(@"http://localhost:19080"); // This example is for a Local cluster
var sfhttpClient = ServiceFabricClientFactory.Create(clusterUrl);

var clusterHealth = sfhttpClient.Cluster.GetClusterHealthAsync().GetAwaiter().GetResult();
Console.WriteLine("Cluster Health: {0}", clusterHealth.AggregatedHealthState.Value.ToString());


Console.WriteLine("Querying for node events...");
var nodesEvents = sfhttpClient.EventsStore.GetNodesEventListAsync(
    "2018-09-01T00:00:00Z",
    "2018-09-30T23:59:59Z",
    timeoutSecs,
    "NodeDown,NodeUp")
    .GetAwaiter()
    .GetResult()
    .ToList();
Console.WriteLine("Result Count: {0}", nodesEvents.Count());

foreach (var nodeEvent in nodesEvents)
{
    Console.Write("Node event happened at {0}, Node name: {1} ", nodeEvent.TimeStamp, nodeEvent.NodeName);
    if (nodeEvent is NodeDownEvent)
    {
        var nodeDownEvent = nodeEvent as NodeDownEvent;
        Console.WriteLine("(Node is down, and it was last up at {0})", nodeDownEvent.LastNodeUpAt);
    }
    else if (nodeEvent is NodeUpEvent)
    {
        var nodeUpEvent = nodeEvent as NodeUpEvent;
        Console.WriteLine("(Node is up, and it was last down at {0})", nodeUpEvent.LastNodeDownAt);
    }
}
Memantau kesehatan kluster
Service Fabric memperkenalkan model kesehatan dengan entitas kesehatan di mana komponen sistem dan pengawas dapat melaporkan kondisi lokal yang mereka pantau. Penyimpanan kesehatan mengagregasi semua data kesehatan untuk menentukan apakah entitas sehat.
Kluster ini secara otomatis diisi dengan laporan kesehatan yang dikirim oleh komponen sistem. Baca selengkapnya di Gunakan laporan kesehatan sistem untuk memecahkan masalah.
Service Fabric memaparkan kueri kesehatan untuk setiap jenis entitas yang didukung. Mereka dapat diakses melalui API, menggunakan metode di FabricClient.HealthManager, cmdlet PowerShell, dan REST. Kueri ini mengembalikan informasi kesehatan lengkap tentang entitas: status kesehatan agregat, aktivitas kesehatan entitas, status kesehatan anak (jika berlaku), evaluasi tidak sehat (ketika entitas tidak sehat), dan statistik kesehatan anak (jika berlaku).
Mendapatkan kesehatan kluster
Cmdlet Get-ServiceFabricClusterHealth mengembalikan kesehatan entitas kluster dan berisi keadaan kesehatan aplikasi dan node (anak-anak dari kluster). Pertama, sambungkan ke kluster menggunakan cmdlet Connect-ServiceFabricCluster.
Status kluster adalah 11 node, aplikasi sistem, dan fabric:/Voting dikonfigurasi seperti yang dijelaskan.
Contoh berikut mendapatkan kesehatan kluster dengan menggunakan kebijakan kesehatan default. 11 node sehat tetapi status kesehatan agregat kluster adalah Kesalahan karena aplikasi fabric:/Voting berada dalam Kesalahan. Perhatikan bagaimana evaluasi yang tidak sehat memberikan detail tentang kondisi yang memicu kesehatan agregat.
Get-ServiceFabricClusterHealth

AggregatedHealthState   : Error
UnhealthyEvaluations    :
                          100% (1/1) applications are unhealthy. The evaluation tolerates 0% unhealthy applications.

                          Application 'fabric:/Voting' is in Error.

                          	33% (1/3) deployed applications are unhealthy. The evaluation tolerates 0% unhealthy deployed applications.

                          	Deployed application on node '_nt2vm_3' is in Error.

                          		50% (1/2) deployed service packages are unhealthy.

                          		Service package for manifest 'VotingWebPkg' and service package activation ID '8723eb73-9b83-406b-9de3-172142ba15f3' is in Error.

                          			'System.Hosting' reported Error for property 'CodePackageActivation:Code:SetupEntryPoint:131959376195593305'.
                          			There was an error during CodePackage activation.The service host terminated with exit code:1


NodeHealthStates        :
                          NodeName              : _nt2vm_3
                          AggregatedHealthState : Ok

                          NodeName              : _nt1vm_4
                          AggregatedHealthState : Ok

                          NodeName              : _nt2vm_2
                          AggregatedHealthState : Ok

                          NodeName              : _nt1vm_3
                          AggregatedHealthState : Ok

                          NodeName              : _nt2vm_1
                          AggregatedHealthState : Ok

                          NodeName              : _nt1vm_2
                          AggregatedHealthState : Ok

                          NodeName              : _nt2vm_0
                          AggregatedHealthState : Ok

                          NodeName              : _nt1vm_1
                          AggregatedHealthState : Ok

                          NodeName              : _nt1vm_0
                          AggregatedHealthState : Ok

                          NodeName              : _nt3vm_0
                          AggregatedHealthState : Ok

                          NodeName              : _nt2vm_4
                          AggregatedHealthState : Ok

ApplicationHealthStates :
                          ApplicationName       : fabric:/System
                          AggregatedHealthState : Ok

                          ApplicationName       : fabric:/Voting
                          AggregatedHealthState : Error

HealthEvents            : None
HealthStatistics        :
                          Node                  : 11 Ok, 0 Warning, 0 Error
                          Replica               : 4 Ok, 0 Warning, 0 Error
                          Partition             : 2 Ok, 0 Warning, 0 Error
                          Service               : 2 Ok, 0 Warning, 0 Error
                          DeployedServicePackage : 3 Ok, 1 Warning, 1 Error
                          DeployedApplication   : 1 Ok, 1 Warning, 1 Error
                          Application           : 0 Ok, 0 Warning, 1 Error
Contoh berikut mendapatkan kesehatan kluster dengan menggunakan kebijakan aplikasi kustom. Ini memfilter hasil untuk hanya mendapatkan aplikasi dan node dalam kesalahan atau peringatan. Dalam contoh ini tidak ada node yang dikembalikan, karena semuanya sehat. Hanya aplikasi fabric:/Voting yang mematuhi filter aplikasi. Karena kebijakan kustom menetapkan untuk mempertimbangkan peringatan sebagai kesalahan untuk aplikasi fabric:/Voting, aplikasi dievaluasi sebagai kesalahan dan begitu juga dengan kluster.
$appHealthPolicy = New-Object -TypeName System.Fabric.Health.ApplicationHealthPolicy
$appHealthPolicy.ConsiderWarningAsError = $true
$appHealthPolicyMap = New-Object -TypeName System.Fabric.Health.ApplicationHealthPolicyMap
$appUri1 = New-Object -TypeName System.Uri -ArgumentList "fabric:/Voting"
$appHealthPolicyMap.Add($appUri1, $appHealthPolicy)
Get-ServiceFabricClusterHealth -ApplicationHealthPolicyMap $appHealthPolicyMap -ApplicationsFilter "Warning,Error" -NodesFilter "Warning,Error" -ExcludeHealthStatistics

AggregatedHealthState   : Error
UnhealthyEvaluations    :
                          100% (1/1) applications are unhealthy. The evaluation tolerates 0% unhealthy applications.

                          Application 'fabric:/Voting' is in Error.

                          	100% (5/5) deployed applications are unhealthy. The evaluation tolerates 0% unhealthy deployed applications.

                          	Deployed application on node '_nt2vm_3' is in Error.

                          		50% (1/2) deployed service packages are unhealthy.

                          		Service package for manifest 'VotingWebPkg' and service package activation ID '8723eb73-9b83-406b-9de3-172142ba15f3' is in Error.

                          			'System.Hosting' reported Error for property 'CodePackageActivation:Code:SetupEntryPoint:131959376195593305'.
                          			There was an error during CodePackage activation.The service host terminated with exit code:1

                          	Deployed application on node '_nt2vm_2' is in Error.

                          		50% (1/2) deployed service packages are unhealthy.

                          		Service package for manifest 'VotingWebPkg' and service package activation ID '2466f2f9-d5fd-410c-a6a4-5b1e00630cca' is in Error.

                          			'System.Hosting' reported Error for property 'CodePackageActivation:Code:SetupEntryPoint:131959376486201388'.
                          			There was an error during CodePackage activation.The service host terminated with exit code:1

                          	Deployed application on node '_nt2vm_4' is in Error.

                          		100% (1/1) deployed service packages are unhealthy.

                          		Service package for manifest 'VotingWebPkg' and service package activation ID '5faa5201-eede-400a-865f-07f7f886aa32' is in Error.

                          			'System.Hosting' reported Warning for property 'CodePackageActivation:Code:SetupEntryPoint:131959376207396204'. The evaluation treats
                          Warning as Error.
                          			There was an error during CodePackage activation.The service host terminated with exit code:1

                          	Deployed application on node '_nt2vm_0' is in Error.

                          		100% (1/1) deployed service packages are unhealthy.

                          		Service package for manifest 'VotingWebPkg' and service package activation ID '204f1783-f774-4f3a-b371-d9983afaf059' is in Error.

                          			'System.Hosting' reported Error for property 'CodePackageActivation:Code:SetupEntryPoint:131959375885791093'.
                          			There was an error during CodePackage activation.The service host terminated with exit code:1

                          	Deployed application on node '_nt3vm_0' is in Error.

                          		50% (1/2) deployed service packages are unhealthy.

                          		Service package for manifest 'VotingWebPkg' and service package activation ID '2533ae95-2d2a-4f8b-beef-41e13e4c0081' is in Error.

                          			'System.Hosting' reported Error for property 'CodePackageActivation:Code:SetupEntryPoint:131959376108346272'.
                          			There was an error during CodePackage activation.The service host terminated with exit code:1

NodeHealthStates        : None
ApplicationHealthStates :
                          ApplicationName       : fabric:/Voting
                          AggregatedHealthState : Error

HealthEvents            : None
Mendapatkan kesehatan node
Cmdlet Get-ServiceFabricNodeHealth mengembalikan kesehatan entitas node dan berisi aktivitas kesehatan yang dilaporkan pada node. Pertama, sambungkan ke kluster dengan menggunakan cmdlet Connect-ServiceFabricCluster. Contoh berikut mendapatkan kesehatan node tertentu dengan menggunakan kebijakan kesehatan default:
Get-ServiceFabricNodeHealth _nt1vm_3
Contoh berikut mendapatkan kesehatan semua node dalam kluster:
Get-ServiceFabricNode | Get-ServiceFabricNodeHealth | select NodeName, AggregatedHealthState | ft -AutoSize
Mendapatkan kesehatan layanan sistem
Dapatkan kesehatan agregat layanan sistem:
Get-ServiceFabricService -ApplicationName fabric:/System | Get-ServiceFabricServiceHealth | select ServiceName, AggregatedHealthState | ft -AutoSize
Langkah berikutnya
Dalam tutorial ini, Anda mempelajari cara:
- Lihat aktivitas Service Fabric
- Mengajukan kueri EventStore API for peristiwa kluster
- Memantau infrastruktur/mengumpulkan penghitung perf
- Lihat laporan kesehatan kluster
Selanjutnya, lanjutkan ke tutorial berikut untuk mempelajari cara menskalakan kluster.
Saran dan Komentar
Segera hadir: Sepanjang tahun 2024 kami akan menghentikan penggunaan GitHub Issues sebagai mekanisme umpan balik untuk konten dan menggantinya dengan sistem umpan balik baru. Untuk mengetahui informasi selengkapnya, lihat: https://aka.ms/ContentUserFeedback.
Kirim dan lihat umpan balik untuk