Nóta
Aðgangur að þessari síðu krefst heimildar. Þú getur prófað aðskrá þig inn eða breyta skráasöfnum.
Aðgangur að þessari síðu krefst heimildar. Þú getur prófað að breyta skráasöfnum.
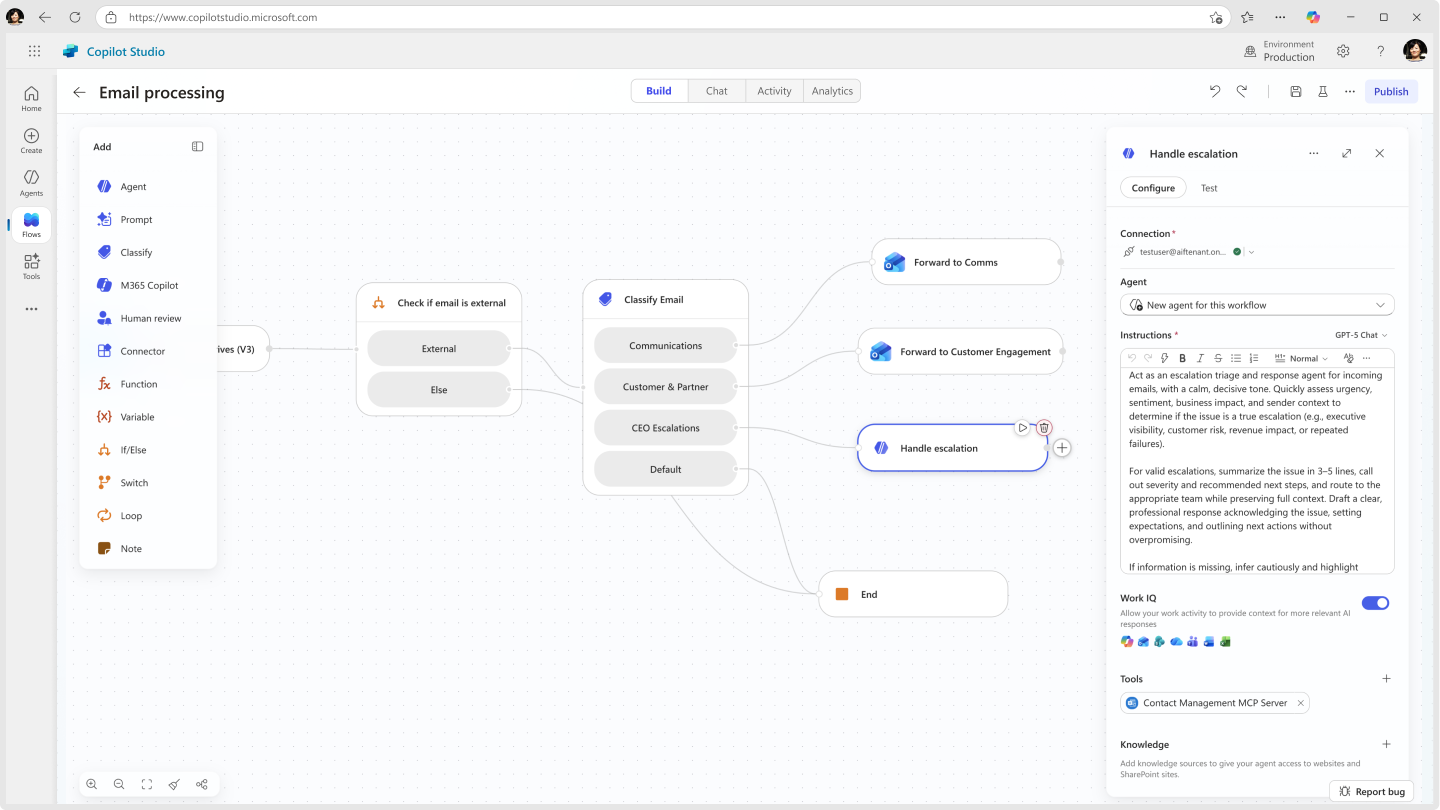
Agent flows and workflows are both created and edited in visual designers in Copilot Studio. The new workflows, now in public preview, use a redesigned visual designer, while agent flows use the original visual designer. Both visual designers provide a canvas where you can continue to build or edit an automation. Add and remove actions, check for errors, and publish your flow, all without leaving the designer. You can also adjust how your agent flow or workflow is displayed to allow you to focus on specific areas.
Important
This article contains Microsoft Copilot Studio preview documentation and is subject to change.
Preview features aren't meant for production use and may have restricted functionality. These features are available before an official release so that you can get early access and provide feedback.
If you're building a production-ready agent, see Microsoft Copilot Studio Overview.
To display an agent flow or workflow in the designer, open Copilot Studio, select Flows, select the flow, and then select the Build tab.
Change how your flow is displayed
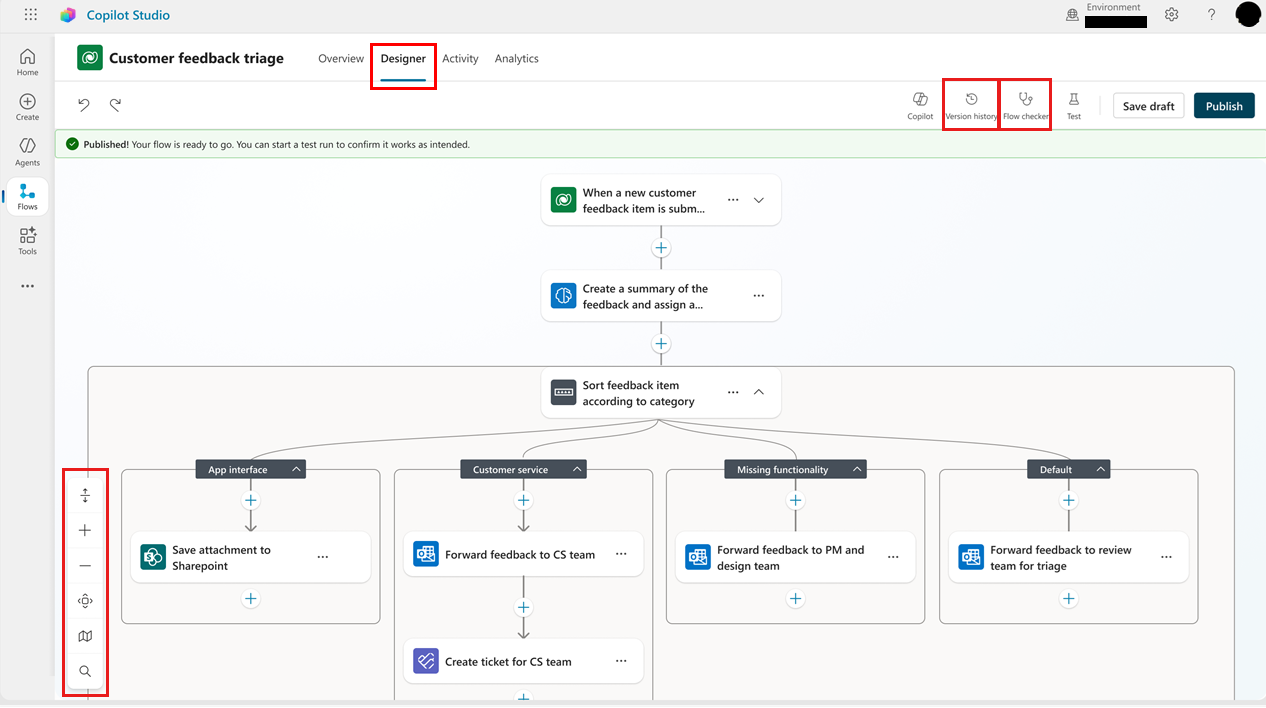
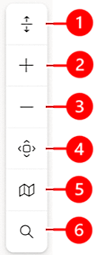
Depending on the size and complexity of your agent flow or workflow, you might want to adjust how the flow is displayed to make it easier to work with. The toolbar at the bottom-left corner of the canvas controls the view.
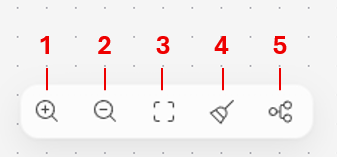
Legend:
- Zoom in: Increase the size of the workflow on the canvas.
- Zoom out: Decrease the size of the workflow on the canvas.
- Fit view: Resize the view to fit the entire workflow on the canvas.
- Tidy up: Reorganize the workflow and branches for a cleaner end-to-end view.
- Vertical layout: Switch to a vertical layout view of the workflow.
Add and remove actions
On the card after which you want to add the action, select Add a step. The Add pane opens.
Under Add, start typing the action you want your flow to perform or connector you want to add, and then select it from the list. Depending on your selection, you might need to provide additional information to complete the action.
If you determine that an action isn't needed, select the Delete icon on the top right corner of the action.
Check flow parameters
To view the parameters for a trigger or action in your workflow, select its card. The configuration panel opens on the right side. To enter a value for a parameter, select an option in the dropdown list or enter an expression to set the value dynamically.
View version history for agent flows
A version history is recorded in Microsoft Dataverse as you build or modify an agent flow. To understand how an agent flow evolved, review its version history. Flow versions are grouped by date, with indicators for latest version, published, and past published.
A flow's history is based on saved versions, so it's a good idea to save drafts before the flow is complete.
To use the version history panel, you must save your agent flow at least once.
On the menu at the top of the canvas, select Version history.
To view the recorded versions of the flow, expand an item in the list.
To display the version in the designer, select it in the list.
Check for errors
Errors in workflow actions are indicated in red. To view details of an error in one action, select the error. To list all errors in the entire flow, open the health center banner. To view the details of individual errors, select the error.
Important
You can't publish a flow if it contains errors. You must correct all the errors before you can publish your flow.
Publish your workflow
If your workflow has no errors, you can publish it. To publish your flow, on the menu at the top of the canvas, select Publish.
Test your agent flow or workflow
Test runs let you verify a step or an entire flow without leaving the designer, using either real upstream data, values you mock yourself, or outputs from a previous run.
There are two ways to run a test:
| What you want to verify | How to test | Where to find it |
|---|---|---|
| A single action or AI step in isolation | Test this node | The Test tab inside the node's side panel |
| The full flow, end-to-end | Run flow test | The Play button in the top command bar |
Both surfaces share the same idea: provide inputs (real or mock), run, then inspect the output.
Test a single node in a workflow
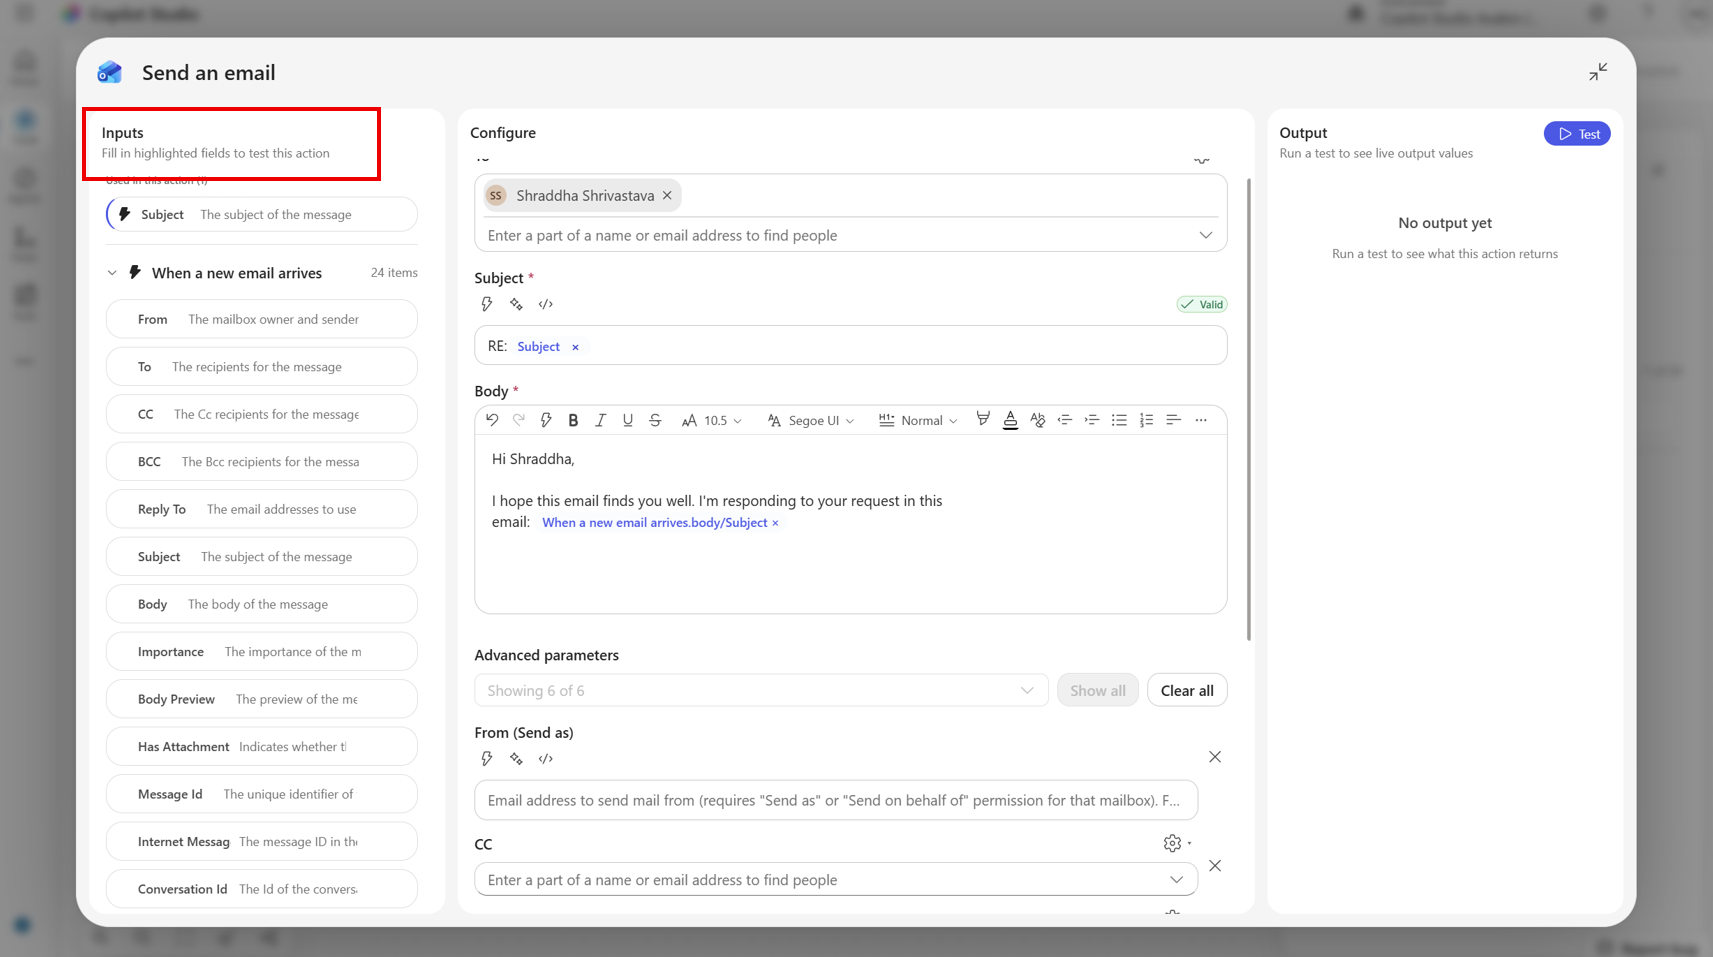
Open any action or node in your workflow and select the play or Test button. There are three sections:
Run / Reset test: Runs the step on demand, or clears the current inputs and output.
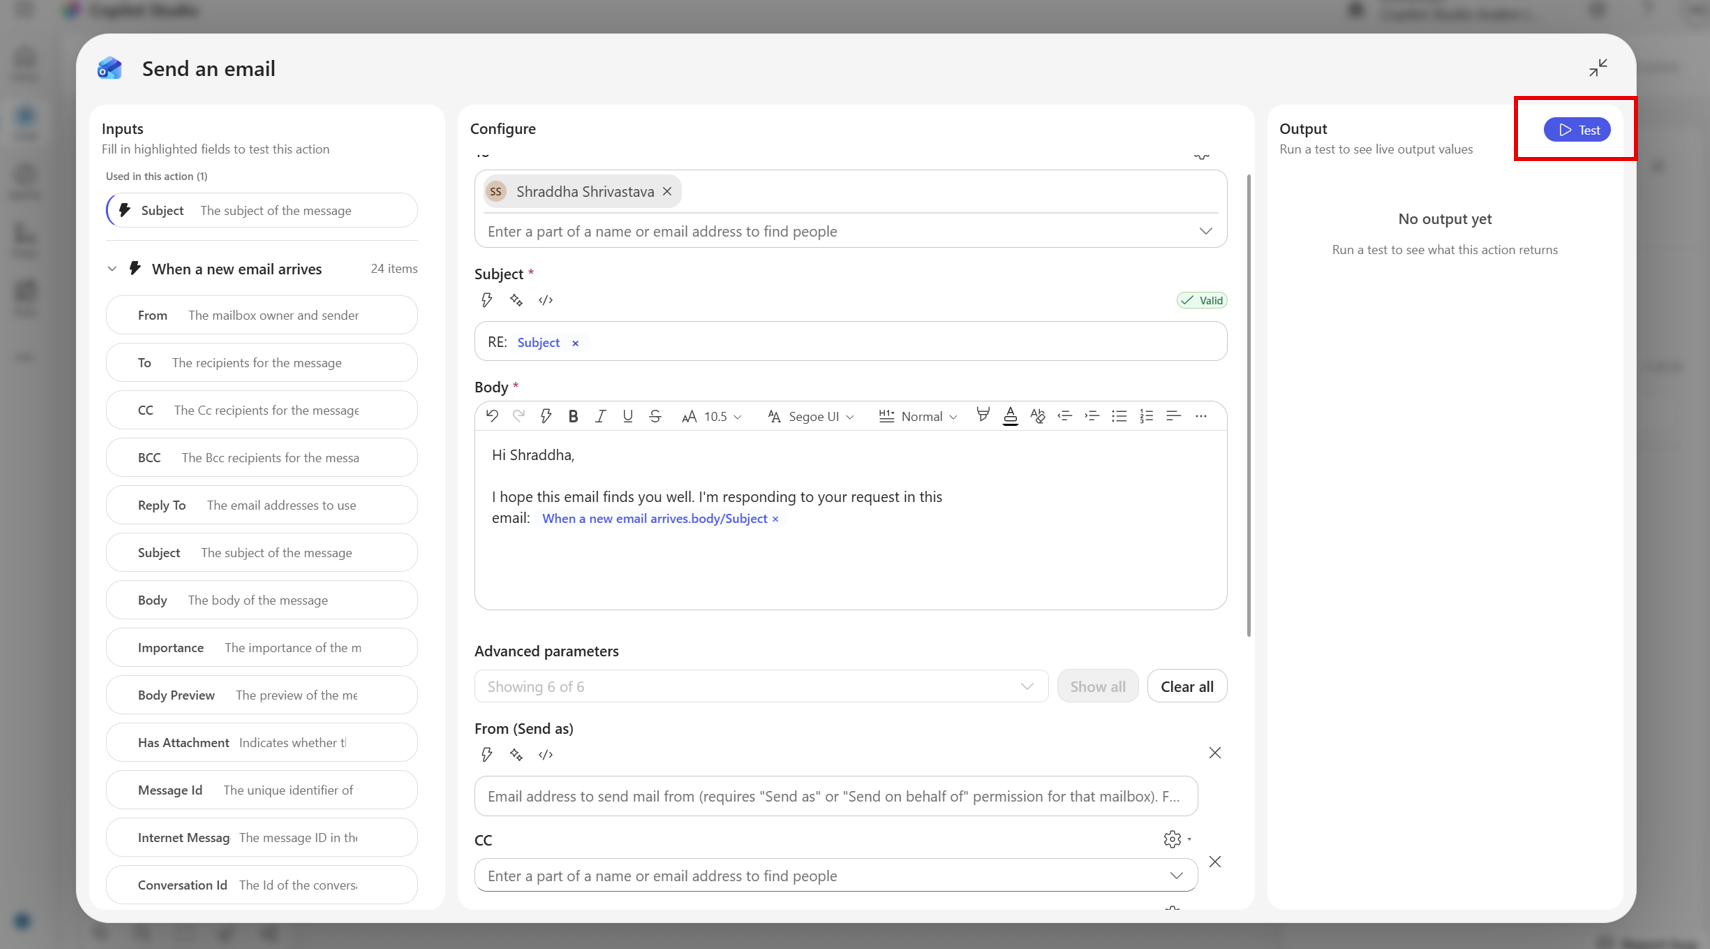
Load values from previous run: A dropdown of recent runs of this flow. Picking one pulls the upstream step outputs from that run into the input fields below.
Inputs: One editable field per upstream step output the node references. The badge on the right of each row shows the field's expected type (string, email, date-time, number, etc.).
Output: The live result of the most recent test, formatted for the node type (JSON, prompt result, connector response, etc.).
Mock inputs
By default the input fields are blank. You can:
- Type any value directly into a field. The field accepts the type shown on the right-hand badge.
- Leave a field empty if your step doesn't depend on it.
Tip
What shows up here? The Test tab automatically lists the upstream step outputs that this node's expressions reference. If you add a new token to the node, the corresponding field appears the next time you open Test.
Load values from a previous run
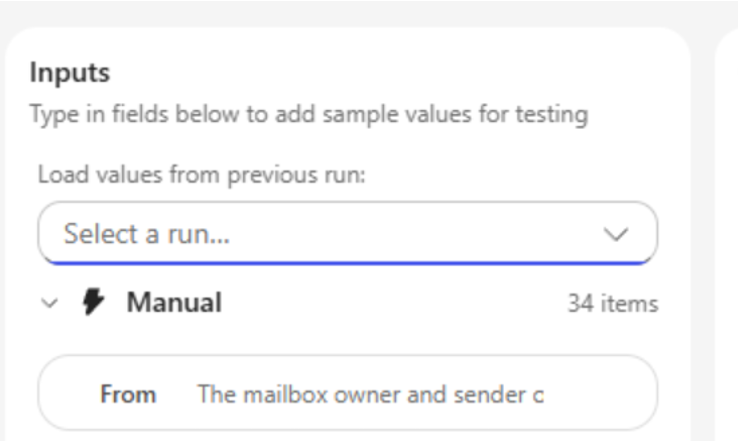
If your flow ran before, you can replay real data instead of typing it in:
In the Load values from previous run dropdown, pick a run. Each entry is labeled with the run's date/time and status (for example, Apr 24, 09:12 — Succeeded).
The designer fetches that run's step outputs and projects them through your node's input schema. Matching values are written into the input fields.
Edit any field afterwards if you want to tweak the scenario.
The dropdown shows the 10 most recent runs of any status. If a run doesn't include outputs for one of your upstream steps (because that step was skipped or the path wasn't taken), only the available fields are filled. The rest of the fields stay as they were.
If the flow didn't run before, No previous runs available is displayed and the dropdown is hidden.
Run the test
Select Run test. The button shows a busy state while the call is in flight; the Output section shows a spinner, then the result or an error.
- Reset test clears both the inputs and the last output.
- The test runs the node in isolation against the connector's API. The test doesn't trigger the rest of the flow.
Test the whole flow
In the top command bar, select the play button (Test). Test runs your flow end-to-end against the live runtime.
Before the run starts, the designer:
- Saves and publishes the flow if you have unsaved changes (or if it's the first time).
- Installs any new connections on first run.
- Triggers the run. The path depends on your trigger type.
| Trigger type | What happens when you select Test |
|---|---|
| Manual / HTTP request | A dialog opens for you to enter the trigger inputs, then the flow runs immediately. |
| Recurrence/sliding window/polling | Either the schedule starts and the first run kicks off automatically, or, if already installed, the flow runs once. |
| Connector event (for example, When an email arrives) | The flow is published and waits. You can see Waiting for trigger…. Perform the action in the source system to fire the run. |
| HTTP webhook | The flow is published; trigger it from the external system as you normally would. |
Mock inputs (manual trigger)
For Manual triggers, the Enter manual trigger inputs dialog renders one field per input you defined on the trigger:
- Text/number/email/date: Appropriate input control.
- Boolean: Toggle switch.
- Single-choice (enum): Dropdown.
- Multi-select: Multi-select dropdown.
- File: File picker (the contents are uploaded as part of the run).
- Object/array: Multi-line text area where you can paste JSON.
Select Run to start the flow with those inputs, or Cancel to dismiss without running. Required fields are marked with an asterisk. If values are missing or invalid, inline validation messages appear and the run is blocked until they're fixed.
The dialog appears every time you select Test. Values aren't saved between runs, so you can quickly try different scenarios.
Watch the run
Once a run is in flight:
- The command bar shows a Cancel button while the run is active.
- The Activity panel (right side) lists the current run at the top with a status badge: Running, Waiting, Succeeded, Failed, or Canceled. Select any run to open it on the canvas and inspect each step's inputs and outputs.
Select past runs
The Activity panel doubles as your flow's run history:
- Filter by All / Succeeded / Failed / Running using the dropdown at the top.
- Select Refresh to refetch the list.
- Select Load More at the bottom to page back further.
- Selecting a run loads it onto the canvas, where each node shows the inputs it received and the outputs it produced for that run. The data is the same as what the node-level Test tab uses when you choose a run from its dropdown.
When to use each type of test
- Iterating on a single AI step or connector action?: Test this node. It's faster, doesn't publish, and lets you mock just the upstream values that matter.
- Validating end-to-end behavior or trigger logic?: Run flow test. It exercises the whole graph against the real runtime.
- Reproducing a production issue?: Open the failing run from the Activity panel, then open the failing node and use Load values from previous run in its Test tab to replay the exact upstream data into the action.
Related content
- Parameters in the action configuration pane
- Add multiple actions and advanced options to a cloud flow
- Drafts and versioning for cloud flows
- Perform bound actions or unbound actions
- Find and fix errors with Flow Checker
- Troubleshoot common issues with triggers
- FAQ for Copilot in cloud flows
- FAQ for Copilot expression assistant
- FAQ for generative actions in cloud flows