Analyze and monitor telemetry with Power BI
Note
Azure Active Directory is now Microsoft Entra ID. Learn more
To make it simple to analyze Business Central telemetry, we've developed two Power BI apps available from Microsoft AppSource. One app is for telemetry on environments. The other one is for telemetry on apps/extensions (the telemetry defined in app.json). Both apps are free and open source but requires Power BI pro licenses to use.
About the reports in the app
The app consists of four reports:
- Usage
- Errors
- Performance
- Administration
The usage report
The usage report provides a multi-perspective view into how Business central is being used. The report can have data from in one or more environments or apps (depending on how you fill in the parameters and how you've partitioned the Azure Application Insights resource).
What do the pages in the report show?
- Sessions: See how sessions are distributed over a timeline, weekday, and time of day
- Clients: See which types of clients and browsers that users use
- Locations: See where users sign in from and which languages they use in the client
- Page views: See which pages users use and when
- Reports: See which reports users use and when
- Feature usage: See which features users use and when
- Integrations and Connectors: See the activity on system integrations (web service calls)
- Deprecated features: check if online environments are using deprecated features such as basic authentication and need to migrate to better solutions
Error report
The error report provides a multi-perspective view into errors occurring in one or more environments or apps (depending on how you fill in the parameters and how you've partitioned the Azure Application Insights resource). The report is a supplement to the Jupyter notebook trouble shooting guides (TSGs). Use the report to investigate/slice'n'dice the data and the notebook to follow a prescribed path.
What do the pages in the report show?
- User errors: When users get error dialogs, it can be a symptom of missing knowledge about the system, or that some features aren't set up the way they're supposed to
- Integrations errors: External systems communicate with Business Central using web services. Failures in this area means that some of the integrations are probably not working correctly
- System errors: Some Business Central modules or code might be misconfigured. Failures here indicate the system isn't set up correctly.
Performance report
The performance report provides a multi-perspective view into the performance of one or more environments or apps (depending on how you fill in the parameters and how you've partitioned the Azure Application Insights resource). The report is a supplement to the Jupyter notebook trouble shooting guides (TSGs). Use the report to investigate/slice'n'dice the data and the notebook to follow a prescribed path.
What do the pages in the report show?
- Sessions: Statistics on sessions that were started, client types (UI clients, background, or web service), and user types (normal, admin, or guest)
- OnCompanyOpen: Timings of the OnCompanyOpen trigger (is run every time a session is created). Can show if expensive code was added here
- Page views: Timings of pages visited by users, client type that ran them (modern client or desktop), and browsers used
- Reports: Timings of reports, client type that ran them (UI clients or background), and reporting engine used (Word, RDLC, or processing only)
- Long Running SQL Queries: Insights into SQL queries that ran longer than 750 milliseconds, the extensions and codeunits that called the database, and corresponding AL call stacks
- Database lock timeouts: Insights into SQL queries that waited for a lock longer than 15 seconds, the extensions and codeunits that called the database, and corresponding AL call stacks
- Long Running AL methods: Insights into AL methods that ran longer than 10,000 milliseconds, the extensions and codeunits they belong to, and corresponding AL call stacks
- Incoming webservice calls/Outgoing webservice calls: Timings of incoming/outgoing web service calls and their type (SOAP, OData, or API), http status codes, and the codeunit they expose
- Job Queue/Task scheduler: Timings of background jobs/tasks
- Configuration packages: Timings of configuration package operations
- App Updates: Timings of how long time updates of installed apps take
Administration report
The Administration report provides a multi-perspective view into the current state of Business central environments and any change done to them.
What do the pages in the report show?
- Inventory: See an inventory of environments and their current version
- Update Planning: See an overview of environment versions and their update schedules
- All changes: See changes to environments, companies, extensions, and indexes
- Environment Changes: See changes to environments (for example, stop/start, rename, copy, delete, update)
- Company Changes: See changes to companies (for example, create, rename, and delete)
- Extension Changes: See changes to extensions (for example, install, update, and uninstall)
- Index Changes: See changes to indexes (keys) (added, removed)
- Field Changes: See changes to fields that are tracked in the field monitoring feature. Consider monitoring Business Central configuration tables to have that data show up here
- Retention Policy: See date deleted due to retention policies set up in Business Central
Get the apps
App on Environment Telemetry
To install or update the app for environment telemetry, go to https://aka.ms/bctelemetryreport and select Get it now.
You'll first have to sign in to Microsoft AppSource using your Power BI account name and password, if you aren't already signed in. Follow the online instructions to get the app installed in Power BI.
Once installed, the Dynamics 365 Business Central Usage app appears under Apps in Power BI. A workspace with the same name is also installed for configuring the app.
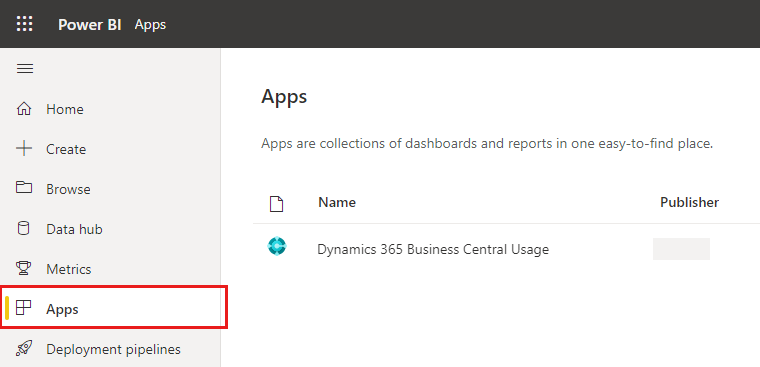
To open the app, from the navigation pane, select Apps > Dynamics 365 Business Central Usage.
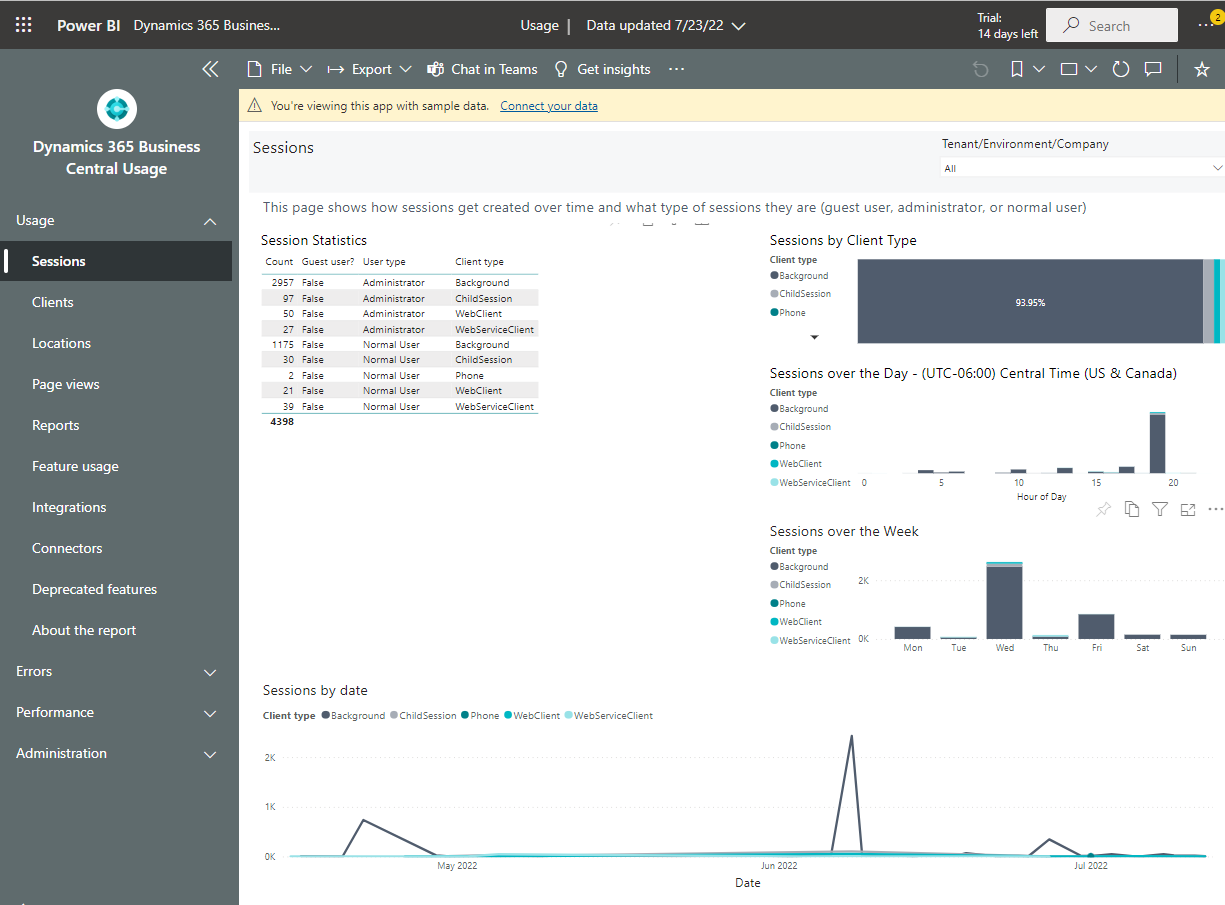
By default, the app shows sample data in the reports. This sample data enables you to demo the app to prospective customers without having to show data from existing customers.
App on App Telemetry
To install or update the app for app telemetry, go to https://aka.ms/bctelemetry-isv-app and select Get it now.
You'll first have to sign in to Microsoft AppSource using your Power BI account name and password, if you aren't already signed in. Follow the online instructions to get the app installed in Power BI.
Once installed, the Dynamics 365 Business Central App Usage app appears under Apps in Power BI. A workspace with the same name is also installed for configuring the app.
To open the app, from the navigation pane, select Apps > Dynamics 365 Business Central App Usage.
By default, the app shows sample data in the reports. This sample data enables you to demo the app to prospective customers without having to show data from existing customers.
Tip
You can install the Power BI apps more than once. Just go to the install link for the app and select Get it now again. When prompted, choose Install another copy of the app into a new workspace.
Connect to Azure Application Insights for the first time
After the app is installed, you can connect it to an Azure Application Insights resource to view actual data instead of the sample data.
Get the Application Insights resource's application ID.
To connect the app to an Azure Application Insights resource, you'll need its Application ID. You can get this ID from the Azure portal as follows:
- Sign in to Azure portal.
- Open the Application Insights resource, then select API Access.
- In the API Access page, copy Application ID to the clipboard.
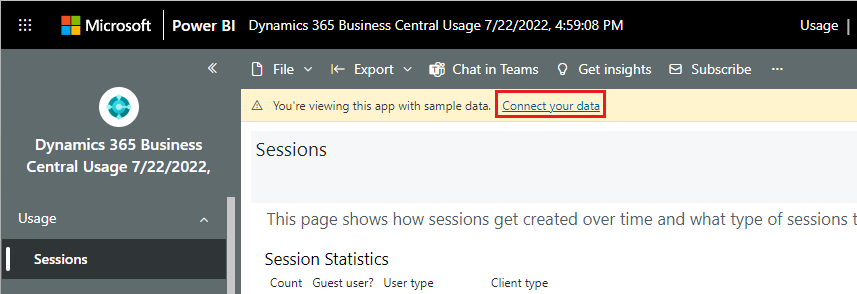
In Power BI, open the Dynamics 365 Business Central Usage app, the select Connect your data.
On the Connect to Dynamics 365 Business Central Usage page, fill in the Application Insights application id with the ID you copied from the previous step. In the Lookback period box, select the number of days back in time you want to show.
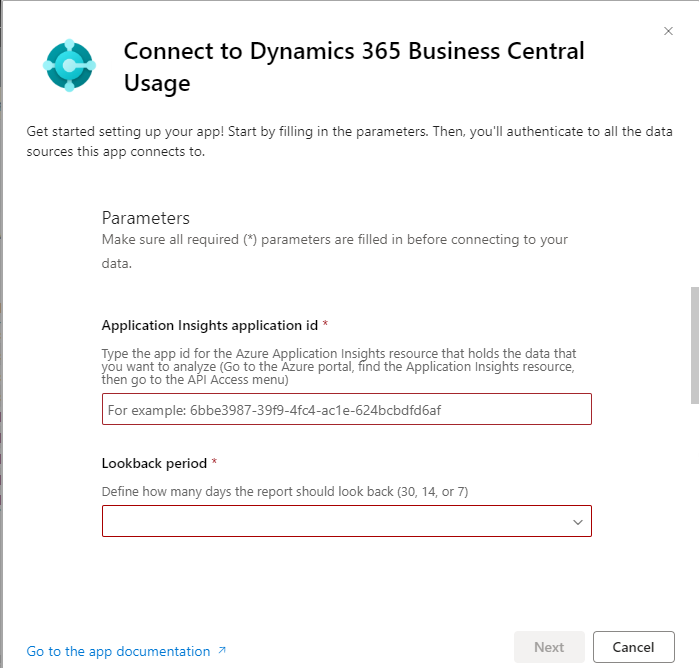
Other information on the page is optional. For more information, see Configure the app.
Select Next and wait while your credentials are checked.
Select Sign in and connect, then enter a valid name and password for accessing the Application Insights resource, if asked.
Note
Keep the Authentication method set to OAuth2. If you get the error The OAuth authentication method isn't supported for this data source, check if the application ID is correct; that's usually the root cause for that error.
Configure an app after initial setup
Once an app is installed, you can use its workspace, such as Dynamics 365 Business Central Usage to change the app configuration, for example, to connect to a different Application Insights resource or change how many days back the data goes. Follow these steps:
From the navigation pane in the Power BI, select Workspaces > Dynamics 365 Business Central Usage to open the workspace.
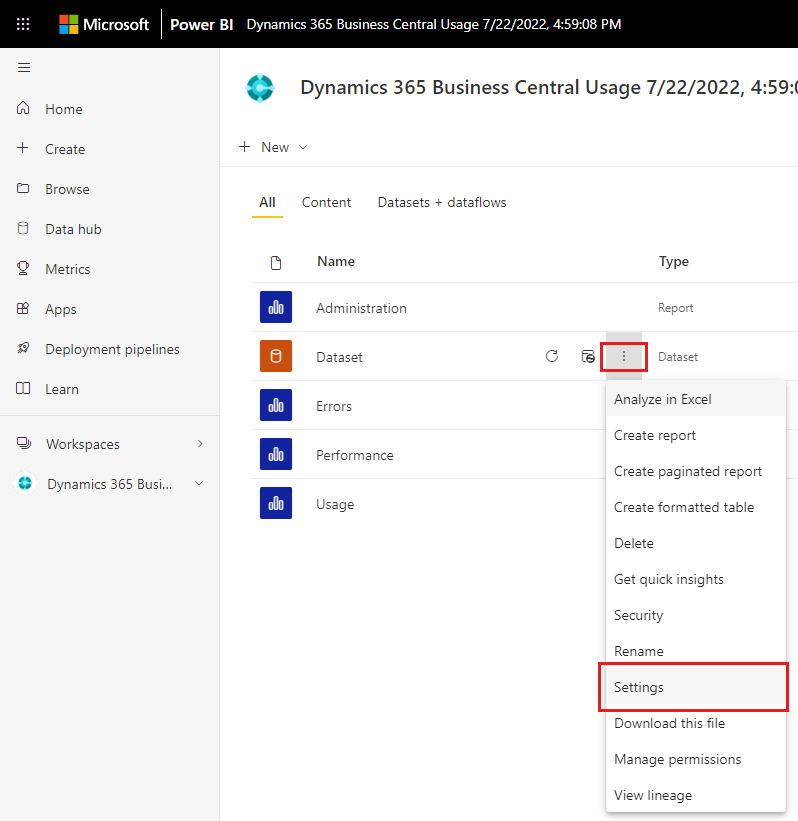
On the Dynamics 365 Business Central Usage page, next to Dataset, select More options (...) > Settings.
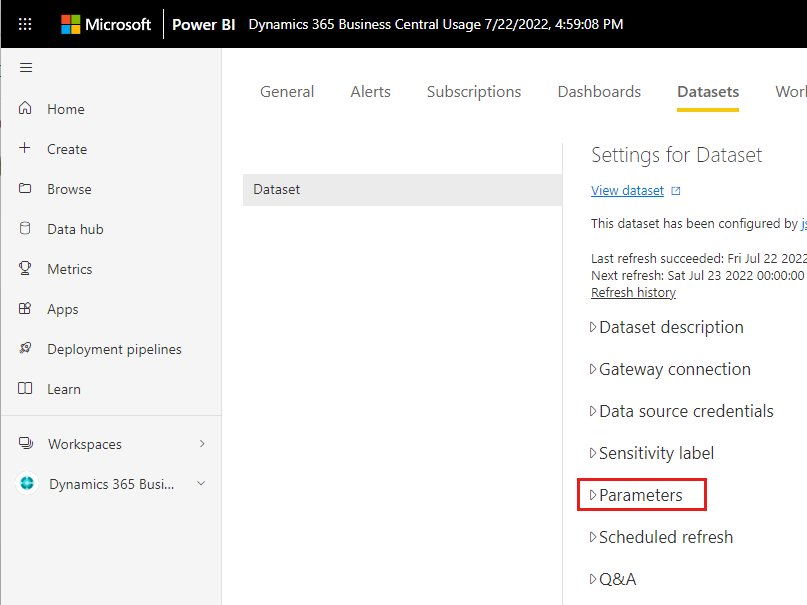
On the Dataset page, go to Parameters and make your changes.
The app only has two required parameters needed for configuration:
- Application Insights Application ID (controls where data is stored)
- Lookback period (the number of days back in time you want to show)
Apart from required parameters, you can also control the following options:
- Microsoft Entra tenant mapping (define which customer names correspond to which Microsoft Entra tenant IDs). The format for this parameter is
{"map":[{ "AAD tenant id":"005bbe22-5949-4acb-9d24-3fb396c64a52" , "Domain":"Contoso 1" },{ "AAD tenant id":"0140d8e7-ef60-4cc3-9a6b-b89042b3ea1f" , "Domain":"Contoso 2"}]} - Timezone (the Business Central platform emits telemetry in the UTC time zone. By setting a Timezone, all visuals that show telemetry by hour of day will adjust to show data in the configured time zone).
- Whether the app should refresh data (the default is every night around midnight); this option is hidden under Advanced.
For the environment usage app, you can also define:
- an include list of environments so that only data for these environments is loaded. The format for this parameter is
{"include":[{"AAD tenant id":"<aad tenant id 1>","Name":"<environment name 1>"}, {"AAD tenant id":"<aad tenant id 2>","Name":"<environment name 2>"}]}
For the app usage app, you can also define:
- an include list of apps so that only data for these apps is loaded. The format for this parameter is
{"include":[{"appId":"<app id 2>"},{"appId":"<app id 2>"}]}
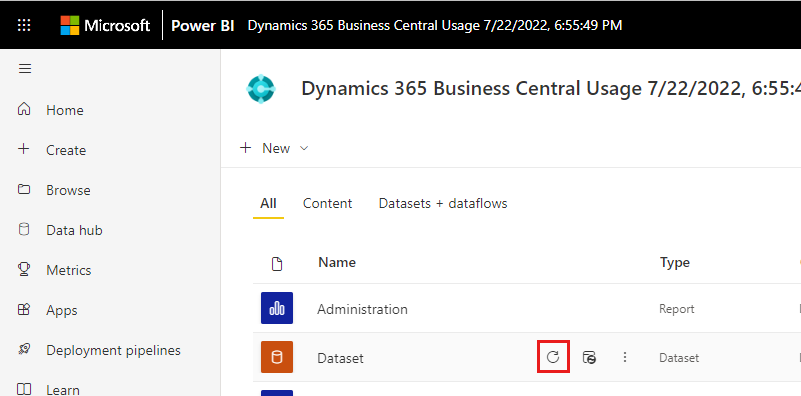
When done making changes, you have to refresh the dataset to update the data shown in the app.
A quick way is to select Refresh now for the dataset on the workspace.
Or, you can schedule the refresh from the Settings page. For more information, see Configure scheduled refresh.
Note
Once you connect to an Application Insights resource, You can't change the app back to show the sample data. If you want to see the sample data, install the app again.
Note
If you turn off scheduled refresh and go back to the app, it will remove the Application ID and you have to enter it again.
Video guidance
The following video shows how to connect Power BI telemetry apps to read your telemetry data.
Install, share, and update apps
From time to time, the app is released in a new improved version via AppSource. To learn how to deal with app updates, see Install, share, and update template apps in your organization
Video example
The following video shows how to change dataset properties for a Power BI telemetry app in Power BI.
Share the app with coworkers and others
Once installed, it's possible to share the app with coworkers and others (such as customers). You can:
- Share the Power BI workspace with the person. The app will appear under Workspaces in their Power BI portal.
- Provide the URL to the person and ask them to open it in a browser. The app will appear under Apps in their Power BI portal.
For more information, see Share Power BI reports and dashboards with coworkers and others
Use the app
Once installed and configured, how can you use the different reports in the app? We identified four different personas as described in this table:
| Persona | Description |
|---|---|
| Account Manager | Person making sales to new and existing customers. |
| Product Owner | Person responsible for an extension/app. |
| Project manager | Person responsible for the implementation of a Business Central environment for a customer. |
| Supporter | Person performing triage, investigation, and mitigation of customer issues. |
In the following table, you'll find examples of scenarios for each persona where the app might be of help.
| Persona | Scenario | How the Power BI app can help |
|---|---|---|
| Account Manager | Prospective customer has concerns that online solutions are a blackbox. | The Power BI app comes with sample data when you install it. If questions pop up, show them what kind of insights the app offers and that they can get access to the app if they find it useful. Focus on the Usage report unless the customer wants to see some of the more technical reports (that is, Errors, Performance, or Administration). If the customer has a representative from IT, then show them the Administration report. |
| Account Manager | Plan new activities with an existing customer. | Most of the pages in the Usage report can help drive conversations with the customer on how to get more value from their Business Central investment. For example, look at the Page views, Reports, and Feature Usage pages to check whether the customer is using the functionality they set out to when starting the project. Lack of data typically means lack of usage. |
| Account Manager | Get existing customers excited about reporting with Excel layouts. | Go to the Usage report and open the Reports page to check whether the customer is using the Excel layouts (you can filter on the layout type). If they are, then it's good. Maybe you can follow up with training or PoCs on Power Query and maybe also start working differently with the customer on reporting. With Excel layouts, some reports only need a developer for the AL report object, then the customer/end users can do most/all of the layout in Excel. If the customer isn't using Excel layouts yet, show them the power of Business Central reports with Excel layouts and a bit of Power Query in Excel. |
| Product Owner | Which features in our apps or per-tenant extensions are being used and how often? | Make sure that apps/extensions have enabled telemetry in the app manifest (app.json). Use the Feature Telemetry AL system module to equip your app with usage telemetry. Consider having separate Power BI apps for apps/extensions and environments. Once you have data in telemetry, then go to the Usage report and visit the pages Page views, 'Reports', and Feature Usage. This gives you an overview of the pages/reports/features that users use in your app. You can filter the results down to publisher/app. |
| Project manager | We need a way to track progress on User Acceptance Testing (UAT) efforts | Go to the Usage report and visit the Page views, Reports, and Feature Usage pages to see what users are doing in Business Central. Consider sharing the app with the customer to enable them to do the follow-ups internally based on data. |
| Project manager | We want a smooth go-live for the customer. | Use the Error dashboard in the Error report to drive errors to zero before go-live. Monitor the dashboard in the first weeks after go-live. Consider sharing the app with the customer so status meetings and follow-ups can be based on data. |
| Project manager | Business Central online only: We want to check if the customer will get broken integrations when they get updated to version 20.0 or 21.0 | Look at the Deprecated features page in the Usage report to see if the customer is still using web service keys (basic auth) for integrations. If you see any data here, work with the customer on a mitigation plan to move integrations to OAuth. |
| Supporter | Customer calls and says that "something changed since Friday of last week." | Go to the Administration report, find the All changes page and filter to a period in time that overlaps with "Friday of last week." There are various changes that a customer can report, such as data, UI, business logic, performance, stability, and so on. Depending on the reported change, you might get lucky that one of the lifecycle events for environments, extensions, companies, or indexes can explain the root cause of the changed behavior. Otherwise, you can dig further into the issue with the app using KQL queries, or simply by reaching out to the code owner. |
| Supporter | Customer complains that some users can't sign in. | Go to the Error report and investigate the Login Errors page. |
| Supporter | Customer complains that users get lots of errors when using the system. | Go to the Error report and investigate the Error Dialogs, Permission Errors, and Feature Errors pages. You can filter pages by Extension Publisher to learn which code path the error is coming from. |
| Supporter | Customer experiences many locking issues. | Use the Database Deadlocks page in the Error report to examine deadlocks. Use the Database Lock Timeouts page in the Performance report to examine lock time-outs. Use the Long running SQL queries page (filter SQL Statement to "UPDLOCK") to investigate SQL queries that take locks. |
Tip
Get started with understanding busines processes here, and learn about roles in Dynamics 365 here.
No-code alerting with Power BI Metrics
If you use the Power BI app on telemetry data, it's very easy to track the metrics that are important to you.
With metrics in Power BI, you can curate your own metrics and track them against key business objectives, in a single pane. This feature enhances data culture by promoting accountability, alignment, and visibility for teams and initiatives within organizations.
Follow this simple four-step process to setup alerting with Power BI Metrics:
- First, you need to create a scorecard in the Power BI service. See Create scorecards in Power BI.
- Then simply add the metrics you want to track by connecting to your Power BI report on telemetry. See Create connected metrics.
- To add alerting, define status rules for your metrics. This will automate status updates based on rules that govern that metric. Rules trigger changes based on value, percentage of target met, date conditions, or a combination of the three, making the rules as versatile as possible. For connected metrics, these status rules are refreshed every time the data in your scorecard is refreshed. For more information, see Create automated status rules for metrics.
- Finally, follow metrics to get alerts in Teams or by email. See Follow your metrics.
For more information about Power BI Metrics, see Get started with metrics in Power BI.
Troubleshoot the Power BI apps on telemetry data
I have no data in one page in the report (but I see data in other pages)
If you don't see any data on a page in a report in one of the Power BI apps on telemetry data, but you do see data in other pages, you can get the KQL query that's used to load data for the page in the Analyze further with KQL visual on the bottom of the page. Then use any KQL client of your choice to run the KQL query. For more information, see Analyze and Monitor Telemetry with KQL. If the query returns an empty result, then you don't have such data in your Azure Application Insights resource, which means there's nothing wrong with the report.
I have no data in any pages in the report (but the dataset refreshes without errors)
If you don't see any data in any pages in the report (but the dataset refreshes without errors), consider checking these steps:
- Have you set global filters in the report? If so, try clearing them and see if you see data now.
- Have you set filters in the app definition? For more information, see Configure an app after initial setup.
- Are you running Business Central? The Power BI app only works on telemetry data from Business Central.
The OAuth authentication method isn't supported for this data source
When configuring the app, please keep the Authentication method set to OAuth2. If you get the error The OAuth authentication method isn't supported for this data source, check if the application ID is correct; that's usually the root cause for that error.
See also
Telemetry overview
Enabling telemetry
Available telemetry
Analyze Telemetry with KQL
Telemetry FAQ
Commenti e suggerimenti
Presto disponibile: Nel corso del 2024 verranno gradualmente disattivati i problemi di GitHub come meccanismo di feedback per il contenuto e ciò verrà sostituito con un nuovo sistema di feedback. Per altre informazioni, vedere https://aka.ms/ContentUserFeedback.
Invia e visualizza il feedback per