このチュートリアルでは、単純な横棒グラフの形式でデータを表示する Power BI ビジュアルの作成方法について説明します。 この視覚化では、最小限のカスタマイズがサポートされています。 このドキュメントの他のページでは、コンテキスト メニュー、ツールヒントなど、さらにカスタマイズを追加する方法について説明します。
このチュートリアルでは、以下の内容を学習します。
- ビジュアルの capabilities を定義する
- ビジュアルのビルドに使用されるソース コードについて理解する
- ビジュアルをレンダリングする
- [プロパティ] ウィンドウにオブジェクトを追加する
- ビジュアルをパッケージ化する
環境を設定する
Power BI の独自の視覚化の開発を始める前に、このセクションに記載されているすべてのものがあることを確認してください。
Power BI Pro または Premium Per User (PPU) のアカウント。 ない場合は、無料試用版にサインアップしてください。
Visual Studio Code (VS Code)。 VS Code は、JavaScript と TypeScript のアプリケーションを開発するための理想的な統合開発環境 (IDE) です。
Windows PowerShell バージョン 4 以降 (Windows の場合)。 または Terminal (Mac の場合)。
Power BI の視覚化を開発できる状態の環境。 Power BI の視覚化の開発用に環境をセットアップします。
このチュートリアルでは、US Sales Analysis レポートを使用します。 このレポートをダウンロードして Power BI サービスにアップロードしても、独自のレポートを使用してもかまいません。 Power BI サービスおよびファイルのアップロードの詳細については、Power BI サービスでの作成の概要に関するチュートリアルを参照してください。
注意
設定時に D3 JavaScript ライブラリをインストールしなかった場合は、ここでインストールします。 PowerShell で npm i d3@latest --save を実行します
横棒グラフ ビジュアルの作成には、次のステップが含まれます。
- 新しいプロジェクトを作成する
-
capabilities ファイル -
capabilities.jsonを定義する - ビジュアル API を作成する
- ビジュアル - pbiviz.json をパッケージ化する
新しいプロジェクトを作成する
このチュートリアルの目的は、ビジュアルがどのように構造化され記述されるのかを理解しやすくすることです。 次の手順に従って、最初からバー コード ビジュアルを作成するか、ソース コード リポジトリを複製し、独自のビジュアルを作成せずにそれを使用して操作します。
PowerShell を開き、プロジェクトを作成するフォルダーに移動します。
次のコマンドを入力します。
pbiviz new BarChartこれで、ビジュアルのファイルを含む BarChart という名前のフォルダーが作成されます。
VS Code で、[tsconfig.json] (visual-project-structure.md#tsconfigjson) ファイルを開き、"ファイル" の名前を "src/barChart.ts" に変更します。
"files": [
"src/barChart.ts"
]
tsconfig.json "ファイル" オブジェクトは、ビジュアルのメイン クラスがあるファイルをポイントします。
最後の tsconfig.json ファイルは、次のように表示されます。
package.json ファイルには、プロジェクトの依存関係の一覧が含まれています。 package.json ファイルをこちらに置き換えます。
これで、次のファイルとフォルダーを含むビジュアル用の新しいフォルダーが作成されます。
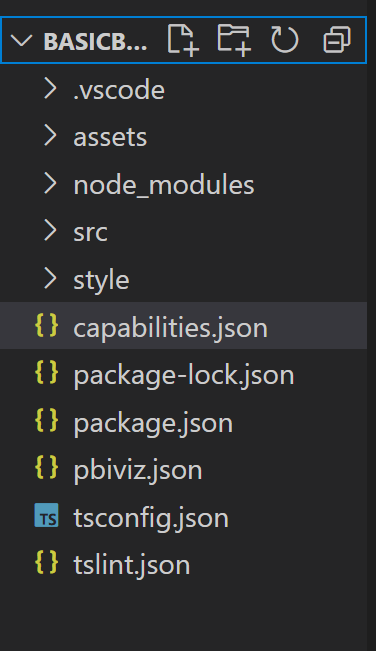
これらの各ファイルの機能の詳細については、「Power BI 視覚化プロジェクトの構造」を参照してください。
このチュートリアルで注目する 2 つのファイルは、ホストへのビジュアルを記述する capabilities.json ファイルと、ビジュアルの API を含む src/barchart.ts ファイルです。
capabilities を定義する
capabilities.json ファイルは、ホストにデータをバインドする場所です。 受け入れられるデータ フィールドの種類と、ビジュアルに必要な機能について説明します。
データ ロールを定義する
変数は、capabilities ファイルの dataRoles セクションで定義およびバインドされます。 横棒グラフで次の 2 種類の変数を受け入れる必要があります。
- グラフ上でさまざまな棒で表されるカテゴリ別データ
- 各バーの高さで表される数値、または測定データ
Visual Studio Code の capabilities.json ファイルで、"dataRoles" というラベルのオブジェクトに次の JSON フラグメントが表示されていることを確認します。
    "dataRoles": [
        {
            "displayName": "Category Data",
            "name": "category",
            "kind": "Grouping"
        },
        {
            "displayName": "Measure Data",
            "name": "measure",
            "kind": "Measure"
        }
    ],
データのマップ
次に、データ マッピングを追加して、これらの変数を使用する操作をホストに伝えます。
"dataViewMappings" オブジェクトの内容を次のコードに置き換えます。
"dataViewMappings": [
        {
            "conditions": [
                {
                    "category": {
                        "max": 1
                    },
                    "measure": {
                        "max": 1
                    }
                }
            ],
            "categorical": {
                "categories": {
                    "for": {
                        "in": "category"
                    }
                },
                "values": {
                    "select": [
                        {
                            "bind": {
                                "to": "measure"
                            }
                        }
                    ]
                }
            }
        }
    ],
上記のコードによって、各データロール オブジェクトが一度に 1 つのフィールドのみを保持できる "条件" が作成されます。 各フィールドを参照するには、データロールの内部 name を使用してください。
また、各フィールドが正しい変数にマップされるように、カテゴリ別のデータ マッピングも設定されます。
[プロパティ] ウィンドウのオブジェクトを定義する
capabilities ファイルの "objects" セクションでは、[書式] ウィンドウに表示するカスタマイズ可能な機能を定義できます。 これらの機能はグラフの内容には影響しませんが、外観を変更できます。
オブジェクトとオブジェクトの動作の詳細については、オブジェクトに関する記事を参照してください。
次のオブジェクトは省略可能です。 このチュートリアルの省略可能なセクションを参照して色を追加し、X 軸をレンダリングする場合は、それらを追加してください。
"objects" セクションの内容を次のコードに置き換えます。
     "objects": {
        "enableAxis": {
            "properties": {
                "show": {
                    "type": {
                        "bool": true
                    }
                },
                "fill": {
                    "type": {
                        "fill": {
                            "solid": {
                                "color": true
                            }
                        }
                    }
                }
            }
        },
        "colorSelector": {
            "properties": {
                "fill": {
                    "type": {
                        "fill": {
                            "solid": {
                                "color": true
                            }
                        }
                    }
                }
            }
        }
     },
capabilities.json ファイルを保存します。
最終的な capabilities ファイルは、こちらの例のようになります。
ビジュアル API
すべてのビジュアルは、IVisual インターフェイスを実装するクラスから開始されます。
src/visual.ts ファイルは、このクラスを含む既定のファイルです。
このチュートリアルでは、IVisual ファイルを barChart.ts と呼びます。
ファイルをダウンロードし、それを /src フォルダーに保存します (まだ保存していない場合)。 このセクションでは、このファイルについて詳しく掘り下げ、さまざまなセクションについて説明します。
インポートする
ファイルの最初のセクションでは、このビジュアルに必要なモジュールをインポートします。 Power BI ビジュアル モジュールに加えて、D3 ライブラリもインポートします。
次のモジュールが barChart.ts ファイルにインポートされます。
import {
    BaseType,
    select as d3Select,
    Selection as d3Selection
} from "d3-selection";
import {
    ScaleBand,
    ScaleLinear,
    scaleBand,
    scaleLinear
} from "d3-scale";
import "./../style/visual.less";

import { Axis, axisBottom } from "d3-axis";

import powerbi from "powerbi-visuals-api";

type Selection<T extends BaseType> = d3Selection<T, any, any, any>;

// powerbi.visuals
import DataViewCategoryColumn = powerbi.DataViewCategoryColumn;
import Fill = powerbi.Fill;
import ISandboxExtendedColorPalette = powerbi.extensibility.ISandboxExtendedColorPalette;
import ISelectionId = powerbi.visuals.ISelectionId;
import IVisual = powerbi.extensibility.IVisual;
import IVisualHost = powerbi.extensibility.visual.IVisualHost;
import PrimitiveValue = powerbi.PrimitiveValue;
import VisualUpdateOptions = powerbi.extensibility.visual.VisualUpdateOptions;
import VisualConstructorOptions = powerbi.extensibility.visual.VisualConstructorOptions;
import DataViewObjectPropertyIdentifier = powerbi.DataViewObjectPropertyIdentifier;

import { textMeasurementService } from "powerbi-visuals-utils-formattingutils";
import { FormattingSettingsService } from "powerbi-visuals-utils-formattingmodel";

import { BarChartSettingsModel } from "./barChartSettingsModel";
import { dataViewObjects} from "powerbi-visuals-utils-dataviewutils";
インターフェイス
次に、ビジュアル インターフェイスを定義します。 次のインターフェイスを使用して、横棒グラフ ビジュアルを記述します。
- BarChartDataPoint
このインターフェイスは次のように定義されます。
/**
 * Interface for BarChart data points.
 *
 * @interface
 * @property {PrimitiveValue} value     - Data value for point.
 * @property {string} category          - Corresponding category of data value.
 * @property {string} color             - Color corresponding to data point.
 * @property {string} strokeColor       - Stroke color for data point column.
 * @property {number} strokeWidth       - Stroke width for data point column.
 * @property {ISelectionId} selectionId - Id assigned to data point for cross filtering
 *                                        and visual interaction.
 */
interface BarChartDataPoint {
    value: PrimitiveValue;
    category: string;
    color: string;
    strokeColor: string;
    strokeWidth: number;
    selectionId: ISelectionId;
}
ビジュアル変換
データ構造が定義されたので、createSelectorDataPoints 関数を使用してそれにデータをマップする必要があります。 この関数は、データ ビューからデータを受け取り、ビジュアルで使用できる形式に変換します。 この場合、前のセクションで説明した BarChartDataPoint[] インターフェイスが返されます。
DataView には、視覚化するデータが含まれています。 このデータは、カテゴリ別や表形式など、さまざまな形式にできます。 横棒グラフのようなカテゴリ別のビジュアルを作成するには、 で DataView プロパティを使用します。
この関数は、ビジュアルが更新されるたびに呼び出されます。
/**
 * Function that converts queried data into a viewmodel that will be used by the visual.
 *
 * @function
 * @param {VisualUpdateOptions} options - Contains references to the size of the container
 *                                        and the dataView which contains all the data
 *                                        the visual had queried.
 * @param {IVisualHost} host            - Contains references to the host which contains services
 */
function createSelectorDataPoints(options: VisualUpdateOptions, host: IVisualHost): BarChartDataPoint[] {
    const barChartDataPoints: BarChartDataPoint[] = []
    const dataViews = options.dataViews;

    if (!dataViews
        || !dataViews[0]
        || !dataViews[0].categorical
        || !dataViews[0].categorical.categories
        || !dataViews[0].categorical.categories[0].source
        || !dataViews[0].categorical.values
    ) {
        return barChartDataPoints;
    }

    const categorical = dataViews[0].categorical;
    const category = categorical.categories[0];
    const dataValue = categorical.values[0];

    const colorPalette: ISandboxExtendedColorPalette = host.colorPalette;

    const strokeColor: string = getColumnStrokeColor(colorPalette);

    const strokeWidth: number = getColumnStrokeWidth(colorPalette.isHighContrast);

    for (let i = 0, len = Math.max(category.values.length, dataValue.values.length); i < len; i++) {
        const color: string = getColumnColorByIndex(category, i, colorPalette);

        const selectionId: ISelectionId = host.createSelectionIdBuilder()
            .withCategory(category, i)
            .createSelectionId();

        barChartDataPoints.push({
            color,
            strokeColor,
            strokeWidth,
            selectionId,
            value: dataValue.values[i],
            category: `${category.values[i]}`,
        });
    }

    return barChartDataPoints;
}
注意
barChart.ts ファイルの次のいくつかの関数では、色と X 軸の作成が処理されます。 これらは省略可能であり、このチュートリアルで後ほど詳しく説明します。 このチュートリアルは、IVisual 関数からの続きです。
ビジュアルをレンダリングする
データが定義されたら、IVisual インターフェイスを実装する BarChart クラスを使用してビジュアルをレンダリングします。
IVisual インターフェイスはビジュアル API のページで説明されています。 ビジュアルを作成する constructor メソッドと、ビジュアルが再読み込みされるごとに呼び出される update メソッドが含まれています。
ビジュアルをレンダリングする前に、クラスのメンバーを宣言する必要があります。
export class BarChart implements IVisual {
    private svg: Selection<SVGSVGElement>;
    private host: IVisualHost;
    private barContainer: Selection<SVGElement>;
    private xAxis: Selection<SVGGElement>;
    private barDataPoints: BarChartDataPoint[];
    private formattingSettings: BarChartSettingsModel;
    private formattingSettingsService: FormattingSettingsService;

    private barSelection: Selection<BaseType>;

    static Config = {
        xScalePadding: 0.1,
        solidOpacity: 1,
        transparentOpacity: 1,
        margins: {
            top: 0,
            right: 0,
            bottom: 25,
            left: 30,
        },
        xAxisFontMultiplier: 0.04,
    };
}
ビジュアルを構築する
コンストラクター関数は、ビジュアルが初めてレンダリングされるときに 1 回だけ呼び出されます。 横棒グラフと X 軸用の空の SVG コンテナーが作成されます。 D3 ライブラリを使用して SVG がレンダリングされている点に注意してください。
/**
     * Creates instance of BarChart. This method is only called once.
     *
     * @constructor
     * @param {VisualConstructorOptions} options - Contains references to the element that will
     *                                             contain the visual and a reference to the host
     *                                             which contains services.
     */
    constructor(options: VisualConstructorOptions) {
        this.host = options.host;
        //Creating the formatting settings service.
        const localizationManager = this.host.createLocalizationManager();
        this.formattingSettingsService = new FormattingSettingsService(localizationManager);

        this.svg = d3Select(options.element)
            .append('svg')
            .classed('barChart', true);

        this.barContainer = this.svg
            .append('g')
            .classed('barContainer', true);

        this.xAxis = this.svg
            .append('g')
            .classed('xAxis', true);
    }
ビジュアルを更新する
update メソッドは、ビジュアルのサイズまたはその値の 1 つが変更されるたび呼び出されます。
スケーリング
バーの数と現在の値が、定義されたビジュアルの幅と高さの制限に収まるまで、ビジュアルをスケーリングする必要があります。 これは、円形カード チュートリアルの update メソッドに似ています。
スケールを計算するには、scaleLinear ライブラリから以前にインポートした scaleBand と d3-scale のメソッドを使用します。
値 options.dataViews[0].categorical.values[0].maxLocal は、現在のすべてのデータ ポイントの最大値を保持します。 この値は、Y 軸の高さを決定するために使用されます。 X 軸の幅のスケーリングは、barchartdatapoint インターフェイス内のビジュアルにバインドされているカテゴリの数によって決まります。
X 軸がレンダリングされるケースでは、X 軸に名前全体を書き出すのに十分な領域がない場合に備え、この視覚化で単語区切りも処理されます。
その他の更新機能
update メソッドでは、スケーリングに加えて、選択と色も処理されます。 これらの機能は省略可能であり、後で説明します。
   /**
     * Updates the state of the visual. Every sequential databinding and resize will call update.
     *
     * @function
     * @param {VisualUpdateOptions} options - Contains references to the size of the container
     *                                        and the dataView which contains all the data
     *                                        the visual had queried.
     */
    public update(options: VisualUpdateOptions) {
        this.formattingSettings = this.formattingSettingsService.populateFormattingSettingsModel(BarChartSettingsModel, options.dataViews?.[0]);
        this.barDataPoints = createSelectorDataPoints(options, this.host);
        this.formattingSettings.populateColorSelector(this.barDataPoints);

        const width = options.viewport.width;
        let height = options.viewport.height;

        this.svg
            .attr("width", width)
            .attr("height", height);

        if (this.formattingSettings.enableAxis.show.value) {
            const margins = BarChart.Config.margins;
            height -= margins.bottom;
        }

        this.xAxis
            .style("font-size", Math.min(height, width) * BarChart.Config.xAxisFontMultiplier)
            .style("fill", this.formattingSettings.enableAxis.fill.value.value);

        const yScale: ScaleLinear<number, number> = scaleLinear()
            .domain([0, <number>options.dataViews[0].categorical.values[0].maxLocal])
            .range([height, 0]);

        const xScale: ScaleBand<string> = scaleBand()
            .domain(this.barDataPoints.map(d => d.category))
            .rangeRound([0, width])
            .padding(0.2);

        const xAxis: Axis<string> = axisBottom(xScale);

        this.xAxis.attr('transform', 'translate(0, ' + height + ')')
            .call(xAxis)
            .attr("color", this.formattingSettings.enableAxis.fill.value.value);

        const textNodes: Selection<SVGElement> = this.xAxis.selectAll("text");
        BarChart.wordBreak(textNodes, xScale.bandwidth(), height);

        this.barSelection = this.barContainer
            .selectAll('.bar')
            .data(this.barDataPoints);

        const barSelectionMerged = this.barSelection
            .enter()
            .append('rect')
            .merge(<any>this.barSelection);

        barSelectionMerged.classed('bar', true);

        barSelectionMerged
            .attr("width", xScale.bandwidth())
            .attr("height", (dataPoint: BarChartDataPoint) => height - yScale(<number>dataPoint.value))
            .attr("y", (dataPoint: BarChartDataPoint) => yScale(<number>dataPoint.value))
            .attr("x", (dataPoint: BarChartDataPoint) => xScale(dataPoint.category))
            .style("fill", (dataPoint: BarChartDataPoint) => dataPoint.color)
            .style("stroke", (dataPoint: BarChartDataPoint) => dataPoint.strokeColor)
            .style("stroke-width", (dataPoint: BarChartDataPoint) => `${dataPoint.strokeWidth}px`);

        this.barSelection
            .exit()
            .remove();
    }

    private static wordBreak(
        textNodes: Selection<SVGElement>,
        allowedWidth: number,
        maxHeight: number
    ) {
        textNodes.each(function () {
            textMeasurementService.wordBreak(
                this,
                allowedWidth,
                maxHeight);
        });
    }
書式設定モデル ユーティリティを使ってプロパティ ペインを設定する
IVisual 関数の最後のメソッドは getFormattingModel です。 このメソッドでは、すべての書式ペイン コンポーネントとプロパティを含む、最新の "書式ペイン書式設定モデル" オブジェクトを構築して返します。 次に、そのオブジェクトを [書式] ペイン内に配置します。 この例では、enableAxis ファイルの colorSelector に従って、show と fill の書式設定プロパティを含む と の書式カードを作成します。
[プロパティ] ペインで各カテゴリのカラー ピッカーを追加するには、barDataPoints で for ループを追加し、それぞれについて書式設定モデルに新しいカラー ピッカー形式プロパティを追加します。
書式設定モデルを構築するには、開発者はすべてのコンポーネントについて理解している必要があります。
Format Pane の [書式] ペインのコンポーネントを確認します。
getFormattingModel の FormattingModel utilsの API を確認してください。
ファイルをダウンロードし、それを /src フォルダーに保存します (まだ保存していない場合)。 書式設定の設定クラスで、書式設定プロパティとその値を宣言します。
import { formattingSettings } from "powerbi-visuals-utils-formattingmodel";
import { BarChartDataPoint } from "./barChart";

import Card = formattingSettings.SimpleCard;
import Model = formattingSettings.Model;
import Slice = formattingSettings.Slice;
import ColorPicker = formattingSettings.ColorPicker;
import ToggleSwitch = formattingSettings.ToggleSwitch;

/**
 * Enable Axis Formatting Card
 */
class EnableAxisCardSettings extends Card {
    show = new ToggleSwitch({
        name: "show",
        displayName: undefined,
        value: false,
    });

    fill = new ColorPicker({
        name: "fill",
        displayName: "Color",
        value: { value: "#000000" }
    });
    topLevelSlice: ToggleSwitch = this.show;
    name: string = "enableAxis";
    displayName: string = "Enable Axis";
    slices: Slice[] = [this.fill];
}

/**
 * Color Selector Formatting Card
 */
class ColorSelectorCardSettings extends Card {
    name: string = "colorSelector";
    displayName: string = "Data Colors";

    // slices will be populated in barChart settings model `populateColorSelector` method
    slices: Slice[] = [];
}

/**
* BarChart formatting settings model class
*/
export class BarChartSettingsModel extends Model {
    // Create formatting settings model formatting cards
    enableAxis = new EnableAxisCardSettings();
    colorSelector = new ColorSelectorCardSettings();
    cards: Card[] = [this.enableAxis, this.colorSelector];

    /**
     * populate colorSelector object categories formatting properties
     * @param dataPoints
     */
    populateColorSelector(dataPoints: BarChartDataPoint[]) {
        const slices: Slice[] = this.colorSelector.slices;
        if (dataPoints) {
            dataPoints.forEach(dataPoint => {
                slices.push(new ColorPicker({
                    name: "fill",
                    displayName: dataPoint.category,
                    value: { value: dataPoint.color },
                    selector: dataPoint.selectionId.getSelector(),
                }));
            });
        }
    }
}
視覚化の constructor メソッドで、formatting settings service モデルを構築して作成します。
formatting settings service は barChart の書式設定を受け取り、getFormattingModel API で返される FormattingModel オブジェクトに変換します。
ローカライズ機能を使用するには、formatting settings service にローカライズ マネージャーを追加します。
    import { FormattingSettingsService } from "powerbi-visuals-utils-formattingmodel";

    // ...
    // declare utils formatting settings service
    private formattingSettingsService: FormattingSettingsService;
    //...

    constructor(options: VisualConstructorOptions) {
        this.host = options.host;
        const localizationManager = this.host.createLocalizationManager();
        this.formattingSettingsService = new FormattingSettingsService(localizationManager);

        // Add here rest of your custom visual constructor code
    }
update API を使って書式設定モデルを更新します。 プロパティ ペインの書式設定プロパティが変更されるたびに Update API を呼び出します。 横棒グラフ セレクターのデータ ポイントを作成し、書式設定モデルで設定します。
    // declare formatting settings model for bar chart
    private formattingSettings: BarChartSettingsModel;

    // ...

    public update(options: VisualUpdateOptions) {
        this.formattingSettings = this.formattingSettingsService.populateFormattingSettingsModel(BarChartSettingsModel, options.dataViews[0]);
        this.barDataPoints = createSelectorDataPoints(options, this.host);
        this.formattingSettings.populateColorSelector(this.barDataPoints);

        // Add the rest of your custom visual update API code here

    }
最後に、新しい API getFormattingModel は、formatting settings service と上記の update API で作成された最新の書式設定モデルを使うシンプルなコード行です。
    public getFormattingModel(): powerbi.visuals.FormattingModel {
        return this.formattingSettingsService.buildFormattingModel(this.formattingSettings);
    }
(省略可能) X 軸のレンダリング (静的オブジェクト)
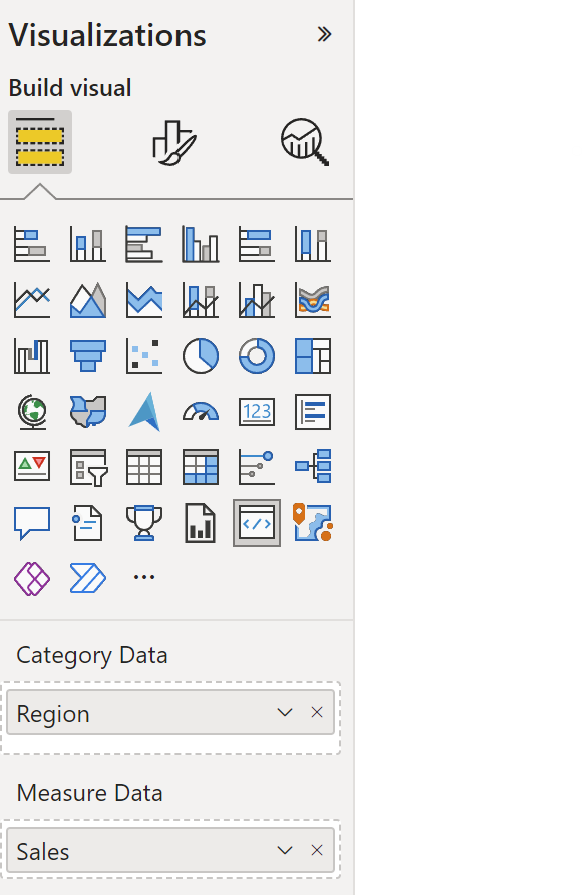
オブジェクトをプロパティ ウィンドウに追加して、ビジュアルをさらにカスタマイズすることができます。 これらのカスタマイズは、ユーザー インターフェイスの変更、またはクエリされたデータに関連する変更になります。
[プロパティ] ウィンドウでは、これらのオブジェクトのオンとオフを切り替えることができます。
![[プロパティ] ペインのオブジェクトのスクリーンショット。](media/create-bar-chart/property-pane.png)
この例では、横棒グラフに静的オブジェクトとして X 軸がレンダリングされます。
enableAxis ファイルと barChartSettings インターフェイスには既に を追加しました。
(省略可能) 色を追加する (データバインド オブジェクト)
データバインド オブジェクトは静的オブジェクトに似ていますが、通常はデータの選択を処理します。 たとえば、データバインド オブジェクトを使用して、各データ ポイントに関連付けられている色を対話形式で選択できます。
colorSelector ファイルで オブジェクトを既に定義しています。
各データ ポイントは、異なる色で表されます。
BarChartDataPoint インターフェイスに色を含め、IVisualHost で定義されている各データ ポイントに既定の色を割り当てます。
function getColumnColorByIndex(
    category: DataViewCategoryColumn,
    index: number,
    colorPalette: ISandboxExtendedColorPalette,
): string {
    if (colorPalette.isHighContrast) {
        return colorPalette.background.value;
    }

    const defaultColor: Fill = {
        solid: {
            color: colorPalette.getColor(`${category.values[index]}`).value,
        }
    };

    const prop: DataViewObjectPropertyIdentifier = {
        objectName: "colorSelector",
        propertyName: "fill"
    };

    let colorFromObjects: Fill;
    if(category.objects?.[index]){
        colorFromObjects = dataViewObjects.getValue(category?.objects[index], prop);
    }

    return colorFromObjects?.solid.color ?? defaultColor.solid.color;
}

function getColumnStrokeColor(colorPalette: ISandboxExtendedColorPalette): string {
    return colorPalette.isHighContrast
        ? colorPalette.foreground.value
        : null;
}

function getColumnStrokeWidth(isHighContrast: boolean): number {
    return isHighContrast
        ? 2
        : 0;
}
colorPalette サービスは、createSelectorDataPoints 関数でこれらの色を管理します。
createSelectorDataPoints は各データ ポイントを反復処理するため、ここは色などのカテゴリ別オブジェクトを割り当てるのに最適な場所です。
横棒グラフに色を追加する方法の詳細については、「Power BI ビジュアルへの色の追加」を参照してください。
注意
最終的な barChart.ts ファイルがこの barChart.ts ソース コードのように見えるかを確認するか、barChart.ts ソース コードをダウンロードしてファイルの置き換えに使用します。
ビジュアルをテストする
Power BI サーバーでビジュアルを実行し、表示を確認します。
PowerShell で、プロジェクトのフォルダーに移動し、開発アプリを起動します。
pbiviz startこれで、お使いのコンピューターでホストされている間、視覚化が実行されるようになりました。
重要
チュートリアルを終えるまで、PowerShell ウィンドウを閉じないでください。 視覚化の実行を停止するには、Ctrl+C キーを押し、バッチ ジョブを終了するように求められたら、「Y」と入力して Enter キーを押します。
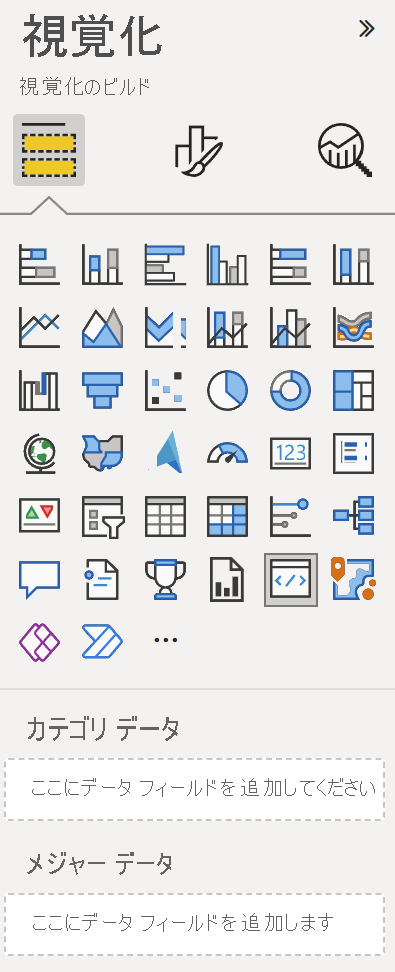
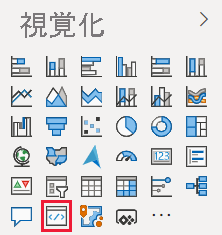
[視覚化] ウィンドウから開発者向けビジュアルを選択することで、Power BI サービスのビジュアルを表示します。
ビジュアルにデータを追加します
ビジュアルの端をドラッグしてサイズを変更し、スケールがどのように調整されるのかを確認します。
X 軸のオンとオフを切り替えます。
![[プロパティ] ウィンドウの X 軸のスクリーンショット。](media/create-bar-chart/object-show-property.png)
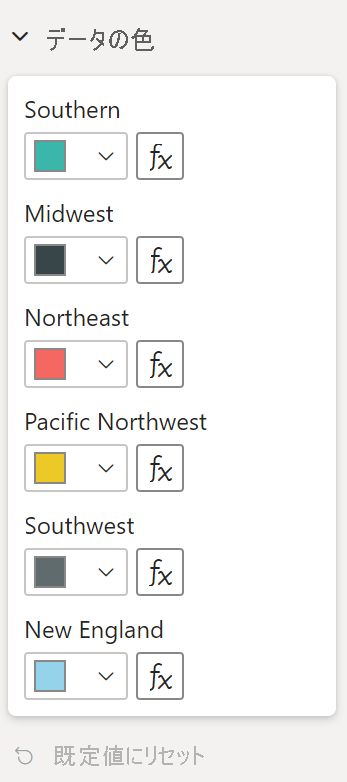
さまざまなカテゴリの色を変更します。
その他の機能を追加する
さらに機能を追加することで、ビジュアルをさらにカスタマイズできます。 ビジュアルの機能を向上させる機能を追加したり、外観を向上したり、ユーザーが外観をさらに制御できるようにすることができます。 たとえば、次のように操作できます。
ビジュアルをパッケージ化する
ビジュアルを Power BI Desktop に読み込む場合、または Power BI ビジュアル ギャラリーでコミュニティと共有する場合は、あらかじめパッケージ化する必要があります。
共有用のビジュアルを準備するには、「Power BI の視覚化をパッケージ化する」の指示に従います。
注意
ヒントやコンテキスト メニューなど、より多くの機能を備える横棒グラフの完全なソース コードについては、Power BI ビジュアルのサンプル横棒グラフに関する記事を参照してください。