หมายเหตุ
การเข้าถึงหน้านี้ต้องได้รับการอนุญาต คุณสามารถลอง ลงชื่อเข้าใช้หรือเปลี่ยนไดเรกทอรีได้
การเข้าถึงหน้านี้ต้องได้รับการอนุญาต คุณสามารถลองเปลี่ยนไดเรกทอรีได้
Important
This feature is in Beta. Account admins can control access to this feature from the Previews page.
This page describes how to monitor usage for AI Gateway (Beta) endpoints using the usage tracking system table.
The usage tracking table automatically captures request and response details for an endpoint, logging essential metrics like token usage and latency. You can use the data in this table to monitor usage, track costs, and gain insights into endpoint performance and consumption.
Requirements
- AI Gateway (Beta) preview enabled for your account.
- A Azure Databricks workspace in a AI Gateway (Beta) supported region.
- Unity Catalog enabled for your workspace. See Enable a workspace for Unity Catalog.
Query the usage table
AI Gateway logs usage data to the system.ai_gateway.usage system table. You can view the table in the UI, or query the table from Databricks SQL or a notebook.
Note
Only account admins have permission to view or query the system.ai_gateway.usage table.
To view the table in the UI, click the usage tracking table link on the endpoint page to open the table in Catalog Explorer.
To query the table from Databricks SQL or a notebook:
SELECT * FROM system.ai_gateway.usage;
Built-in usage dashboard
Import built-in usage dashboard
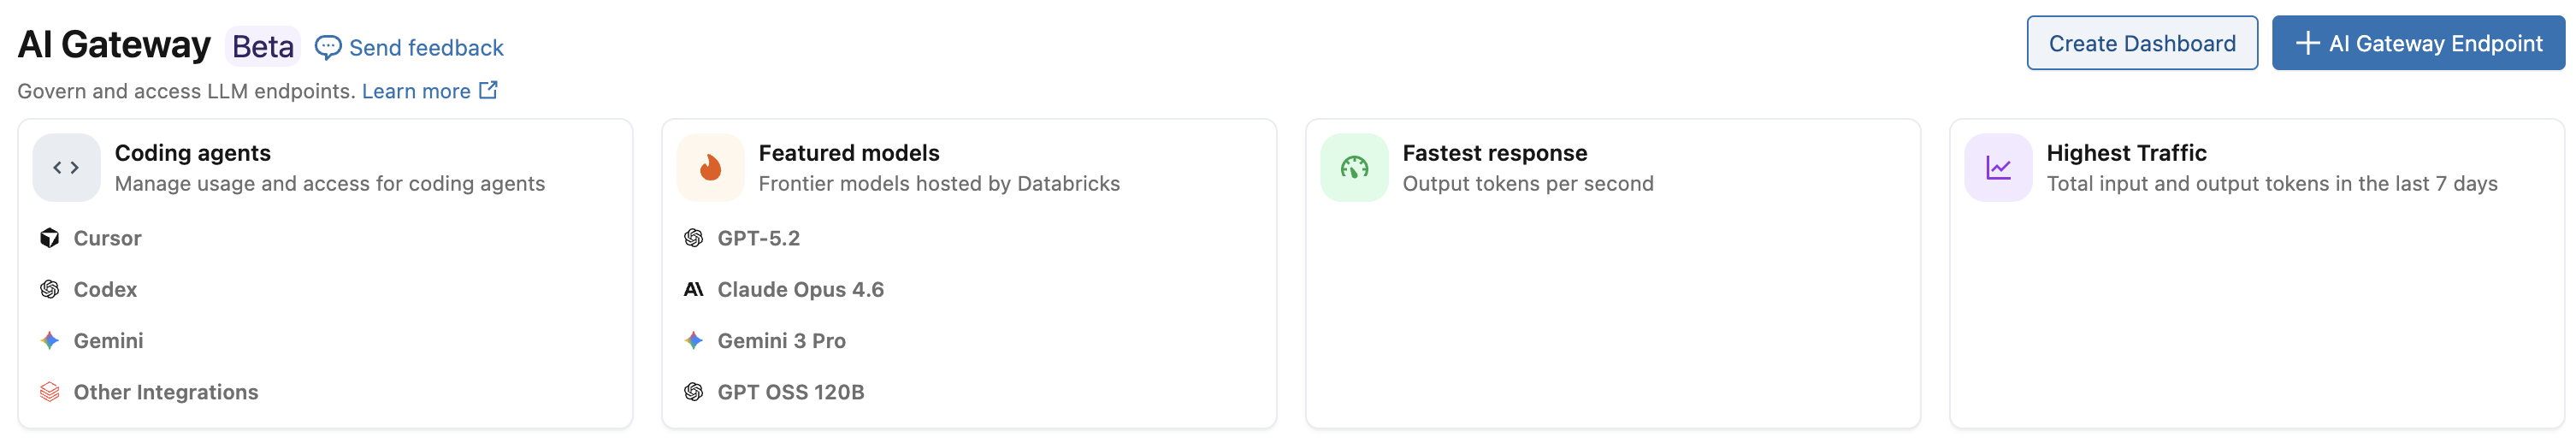
Account admins can import a built-in AI Gateway usage dashboard by clicking Create Dashboard on the AI Gateway page to monitor usage, track costs, and gain insights into endpoint performance and consumption. The dashboard is published with the account admin's permissions, allowing viewers to run queries using the publisher's permissions. See Publish a dashboard for more details. Account admins can also update the warehouse used to run dashboard queries, which applies to all subsequent queries.
Note
Dashboard import is restricted to account admins because it requires SELECT permissions on the system.ai_gateway.usage table. The dashboard's data is subject to the usage table's retention policies. See Which system tables are available?.
To reload the dashboard from the latest template, account admins can click Re-import Dashboard on the AI Gateway page. This updates the dashboard with any new visualizations or improvements from the template while preserving your warehouse configuration.
View usage dashboard
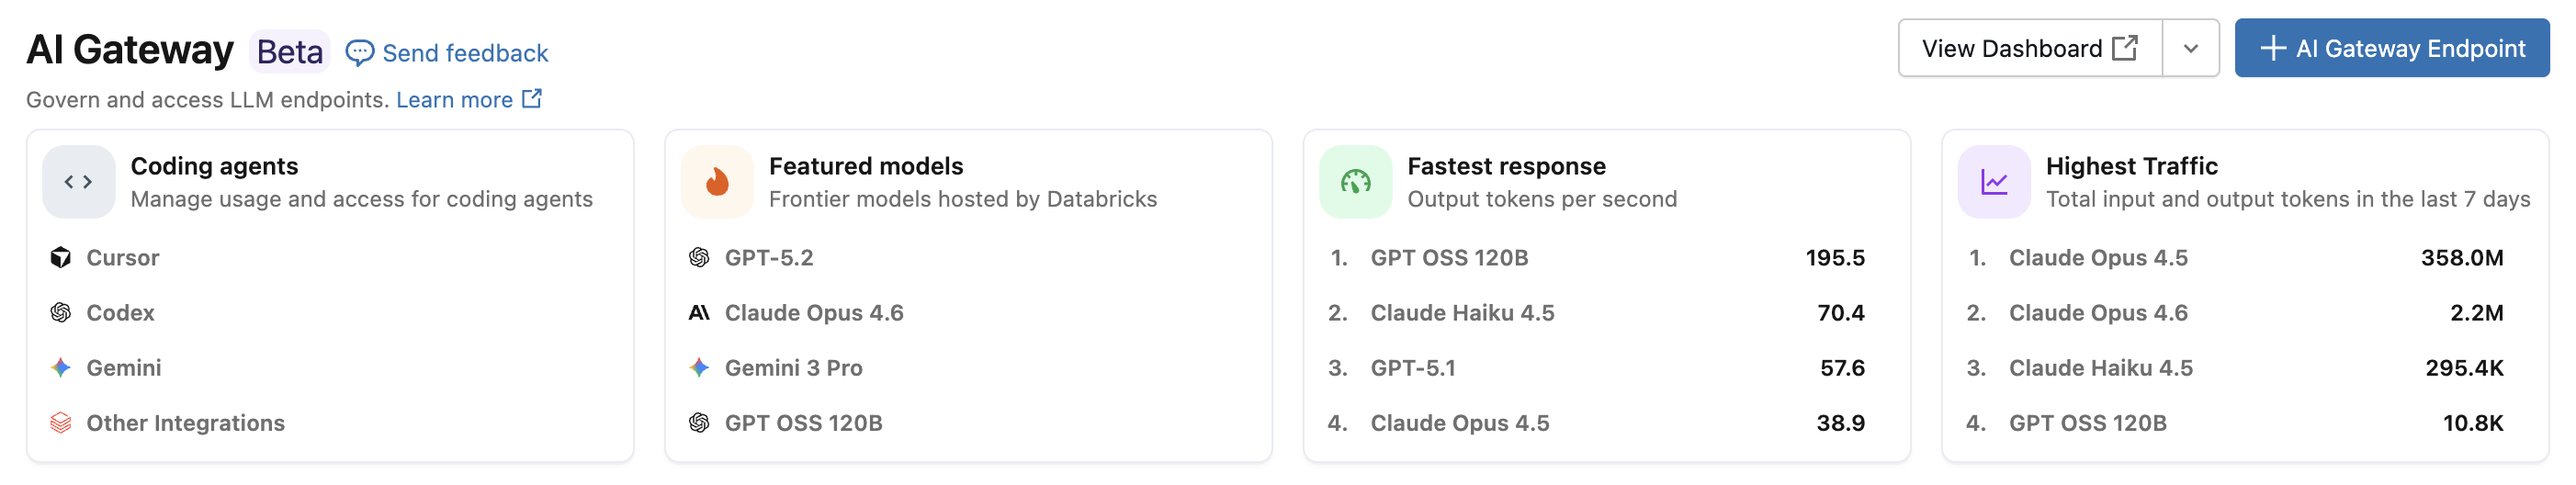
To view the dashboard, click View Dashboard from the AI Gateway page. The built-in dashboard provides comprehensive visibility into AI Gateway endpoint usage and performance. It includes multiple pages tracking requests, token consumption, latency metrics, error rates, and coding agent activity.
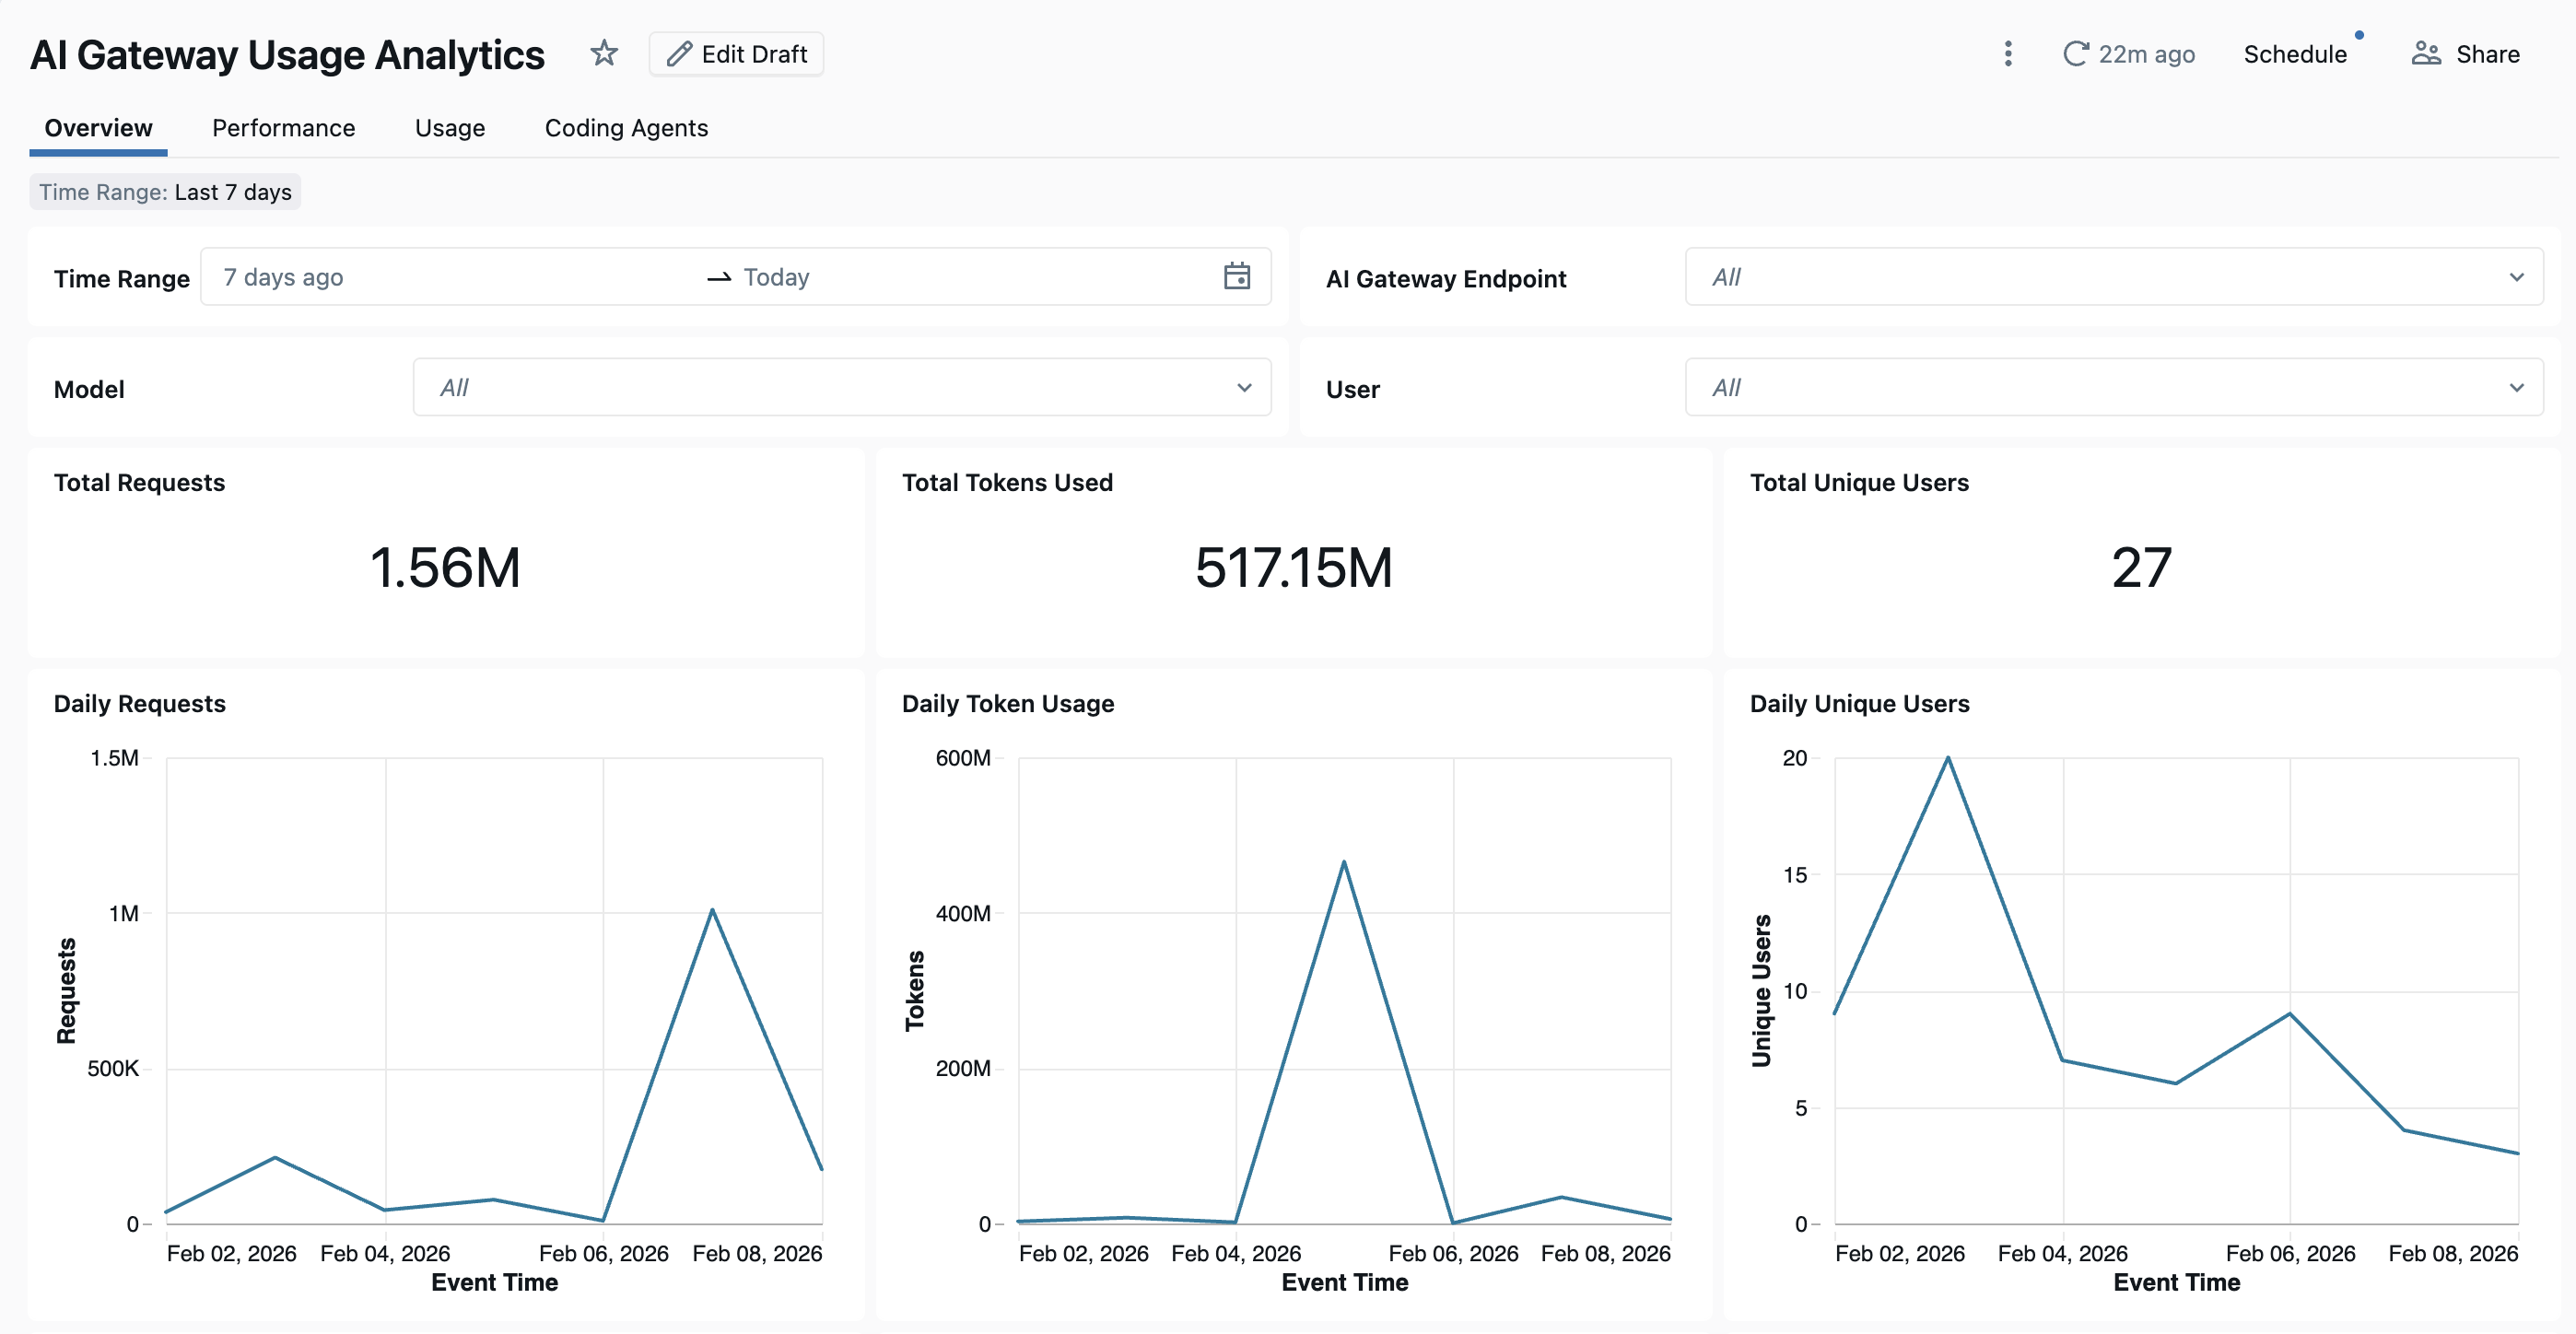
The dashboard provides cross-workspace analytics by default. All dashboard pages can be filtered by date range and workspace ID.
- Overview tab: Shows high-level usage metrics including daily request volume, token usage trends over time, top users by token consumption, and total unique user counts. Use this tab to get a quick snapshot of overall AI Gateway activity and identify the most active users and models.
- Performance tab: Tracks key performance metrics including latency percentiles (P50, P90, P95, P99), time to first byte, error rates, and HTTP status code distributions. Use this tab to monitor endpoint health and identify performance bottlenecks or reliability issues.
- Usage tab: Shows detailed consumption breakdowns by endpoint, workspace, and requester. This tab shows token usage patterns, request distributions, and cache hit ratios to help analyze and optimize costs.
- Coding Agents tab: Tracks activity from integrated coding agents including Cursor, Claude Code, Gemini CLI, and Codex CLI. This tab shows metrics like active days, coding sessions, commits, and lines of code added or removed to monitor developer tool usage. See Coding agent dashboard for more details.
Usage table schema
The system.ai_gateway.usage table has the following schema:
| Column name | Type | Description | Example |
|---|---|---|---|
account_id |
STRING | The account ID. | 11d77e21-5e05-4196-af72-423257f74974 |
workspace_id |
STRING | The workspace ID. | 1653573648247579 |
request_id |
STRING | A unique identifier for the request. | b4a47a30-0e18-4ae3-9a7f-29bcb07e0f00 |
schema_version |
INTEGER | The schema version of the usage record. | 1 |
endpoint_id |
STRING | The unique ID of the AI Gateway endpoint. | 43addf89-d802-3ca2-bd54-fe4d2a60d58a |
endpoint_name |
STRING | The name of the AI Gateway endpoint. | databricks-gpt-5-2 |
endpoint_tags |
MAP | Tags associated with the endpoint. | {"team": "engineering"} |
endpoint_metadata |
STRUCT | Endpoint metadata including creator, creation_time, last_updated_time, destinations, inference_table, and fallbacks. |
{"creator": "user.name@email.com", "creation_time": "2026-01-06T12:00:00.000Z", ...} |
event_time |
TIMESTAMP | The timestamp when the request was received. | 2026-01-20T19:48:08.000+00:00 |
latency_ms |
LONG | The total latency in milliseconds. | 300 |
time_to_first_byte_ms |
LONG | The time to first byte in milliseconds. | 300 |
destination_type |
STRING | The type of destination (for example, external model or foundation model). | PAY_PER_TOKEN_FOUNDATION_MODEL |
destination_name |
STRING | The name of the destination model or provider. | databricks-gpt-5-2 |
destination_id |
STRING | The unique ID of the destination. | 507e7456151b3cc89e05ff48161efb87 |
destination_model |
STRING | The specific model used for the request. | GPT-5.2 |
requester |
STRING | The ID of the user or service principal that made the request. | user.name@email.com |
requester_type |
STRING | The type of requester (user, service principal, or user group). | USER |
ip_address |
STRING | The IP address of the requester. | 1.2.3.4 |
url |
STRING | The URL of the request. | https://<ai-gateway-url>/mlflow/v1/chat/completions |
user_agent |
STRING | The user agent of the requester. | OpenAI/Python 2.13.0 |
api_type |
STRING | The type of API call (for example, chat, completions, or embeddings). | mlflow/v1/chat/completions |
request_tags |
MAP | Tags associated with the request. | {"team": "engineering"} |
input_tokens |
LONG | The number of input tokens. | 100 |
output_tokens |
LONG | The number of output tokens. | 100 |
total_tokens |
LONG | The total number of tokens (input + output). | 200 |
token_details |
STRUCT | Detailed token breakdown including cache_read_input_tokens, cache_creation_input_tokens, and output_reasoning_tokens. |
{"cache_read_input_tokens": 100, ...} |
response_content_type |
STRING | The content type of the response. | application/json |
status_code |
INT | The HTTP status code of the response. | 200 |
routing_information |
STRUCT | Routing details for fallback attempts. Contains an attempts array with priority, action, destination, destination_id, status_code, error_code, latency_ms, start_time, and end_time for each model tried during the request. |
{"attempts": [{"priority": "1", ...}]} |