บทช่วยสอน: ใช้ R เพื่อคาดการณ์ราคาอะโวคาโด
บทช่วยสอนนี้แสดงตัวอย่างแบบ end-to-end ของเวิร์กโฟลว์ Synapse Data Science ใน Microsoft Fabric ซึ่งใช้ R ในการวิเคราะห์และแสดงภาพราคาอะโวคาโดในสหรัฐอเมริกา เพื่อสร้างแบบจําลองการเรียนรู้ของเครื่องที่คาดการณ์ราคาอะโวคาโดในอนาคต
บทช่วยสอนนี้ครอบคลุมขั้นตอนเหล่านี้:
- โหลดไลบรารีเริ่มต้น
- โหลดข้อมูล
- กําหนดข้อมูลเอง
- เพิ่มแพคเกจใหม่ลงในเซสชัน
- วิเคราะห์และแสดงภาพข้อมูล
- ฝึกแบบจำลอง

ข้อกำหนดเบื้องต้น
รับการสมัครใช้งาน Microsoft Fabric หรือลงทะเบียนเพื่อทดลองใช้งาน Microsoft Fabric ฟรี
ลงชื่อเข้าใช้ Microsoft Fabric
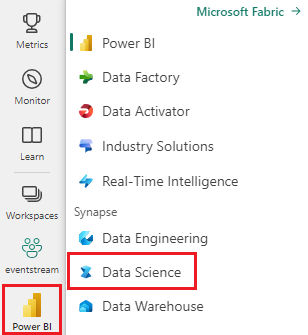
ใช้ตัวสลับประสบการณ์การใช้งานที่ด้านล่างซ้ายของหน้าหลักของคุณเพื่อเปลี่ยนเป็น Fabric

เปิดหรือสร้างสมุดบันทึก หากต้องการเรียนรู้วิธีการ ดู วิธีใช้สมุดบันทึก Microsoft Fabric
ตั้งค่าตัวเลือกภาษาเป็น SparkR (R) เพื่อเปลี่ยนภาษาหลัก
แนบสมุดบันทึกของคุณเข้ากับเลคเฮ้าส์ ทางด้านซ้าย เลือก เพิ่ม เพื่อเพิ่มเลคเฮาส์ที่มีอยู่ หรือเพื่อสร้างเลคเฮ้าส์
โหลดไลบรารี
ใช้ไลบรารีจากรันไทม์ R เริ่มต้น:
library(tidyverse)
library(lubridate)
library(hms)
โหลดข้อมูล
อ่านราคาอะโวคาโดจาก ไฟล์ CSV ดาวน์โหลดจากอินเทอร์เน็ต:
df <- read.csv('https://synapseaisolutionsa.blob.core.windows.net/public/AvocadoPrice/avocado.csv', header = TRUE)
head(df,5)
จัดการข้อมูล
ก่อนอื่น ตั้งชื่อให้คอลัมน์ที่เป็นมิตร
# To use lowercase
names(df) <- tolower(names(df))

# To use snake case
avocado <- df %>%
  rename("av_index" = "x",
         "average_price" = "averageprice",
         "total_volume" = "total.volume",
         "total_bags" = "total.bags",
         "amount_from_small_bags" = "small.bags",
         "amount_from_large_bags" = "large.bags",
         "amount_from_xlarge_bags" = "xlarge.bags")

# Rename codes
avocado2 <- avocado %>%
  rename("PLU4046" = "x4046",
         "PLU4225" = "x4225",
         "PLU4770" = "x4770")

head(avocado2,5)
เปลี่ยนชนิดข้อมูล ลบคอลัมน์ที่ไม่ต้องการ และเพิ่มปริมาณการใช้ทั้งหมด:
# Convert data
avocado2$year = as.factor(avocado2$year)
avocado2$date = as.Date(avocado2$date)
avocado2$month  = factor(months(avocado2$date), levels = month.name)
avocado2$average_price =as.numeric(avocado2$average_price)
avocado2$PLU4046 = as.double(avocado2$PLU4046)
avocado2$PLU4225 = as.double(avocado2$PLU4225)
avocado2$PLU4770 = as.double(avocado2$PLU4770)
avocado2$amount_from_small_bags = as.numeric(avocado2$amount_from_small_bags)
avocado2$amount_from_large_bags = as.numeric(avocado2$amount_from_large_bags)
avocado2$amount_from_xlarge_bags = as.numeric(avocado2$amount_from_xlarge_bags)


# Remove unwanted columns
avocado2 <- avocado2 %>%
  select(-av_index,-total_volume, -total_bags)

# Calculate total consumption
avocado2 <- avocado2 %>%
  mutate(total_consumption = PLU4046 + PLU4225 + PLU4770 + amount_from_small_bags + amount_from_large_bags + amount_from_xlarge_bags)
ติดตั้งแพคเกจใหม่
ใช้การติดตั้งแพคเกจแบบอินไลน์เพื่อเพิ่มแพคเกจใหม่ไปยังเซสชัน:
install.packages(c("repr","gridExtra","fpp2"))
โหลดไลบรารีที่จําเป็น
library(tidyverse)
library(knitr)
library(repr)
library(gridExtra)
library(data.table)
วิเคราะห์และแสดงภาพข้อมูล
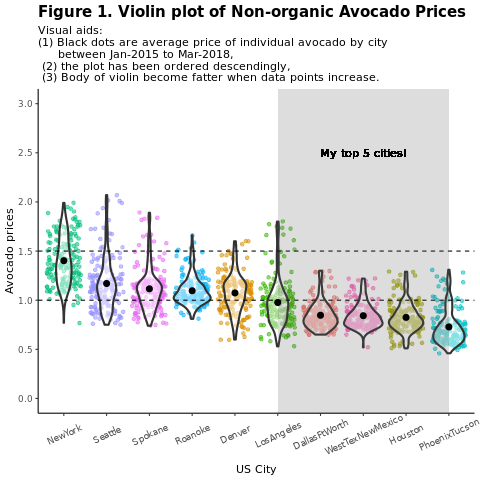
เปรียบเทียบราคาอะโวคาโดแบบทั่วไป (nonorganic) ตามภูมิภาค:
options(repr.plot.width = 10, repr.plot.height =10)
# filter(mydata, gear %in% c(4,5))
avocado2 %>%
  filter(region %in% c("PhoenixTucson","Houston","WestTexNewMexico","DallasFtWorth","LosAngeles","Denver","Roanoke","Seattle","Spokane","NewYork")) %>%
  filter(type == "conventional") %>%
  select(date, region, average_price) %>%
  ggplot(aes(x = reorder(region, -average_price, na.rm = T), y = average_price)) +
  geom_jitter(aes(colour = region, alpha = 0.5)) +
  geom_violin(outlier.shape = NA, alpha = 0.5, size = 1) +
  geom_hline(yintercept = 1.5, linetype = 2) +
  geom_hline(yintercept = 1, linetype = 2) +
  annotate("rect", xmin = "LosAngeles", xmax = "PhoenixTucson", ymin = -Inf, ymax = Inf, alpha = 0.2) +
  geom_text(x = "WestTexNewMexico", y = 2.5, label = "My top 5 cities!", hjust = 0.5) +
  stat_summary(fun = "mean") +
  labs(x = "US city",
       y = "Avocado prices",
       title = "Figure 1. Violin plot of nonorganic avocado prices",
       subtitle = "Visual aids: \n(1) Black dots are average prices of individual avocados by city \n     between January 2015 and March 2018. \n(2) The plot is ordered descendingly.\n(3) The body of the violin becomes fatter when data points increase.") +
  theme_classic() +
  theme(legend.position = "none",
        axis.text.x = element_text(angle = 25, vjust = 0.65),
        plot.title = element_text(face = "bold", size = 15)) +
  scale_y_continuous(lim = c(0, 3), breaks = seq(0, 3, 0.5))

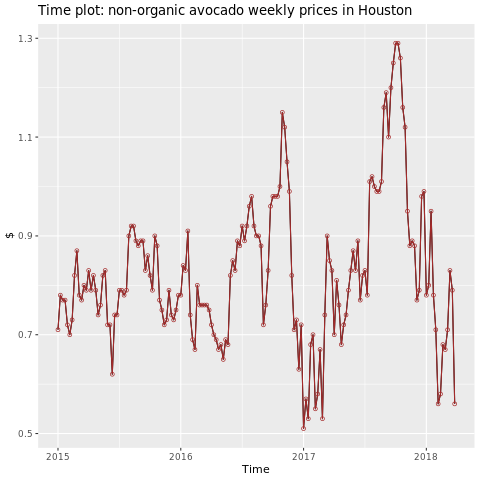
มุ่งเน้นไปที่ภูมิภาคฮุสตัน
library(fpp2)
conv_houston <- avocado2 %>%
  filter(region == "Houston",
         type == "conventional") %>%
  group_by(date) %>%
  summarise(average_price = mean(average_price))

# Set up ts

conv_houston_ts <- ts(conv_houston$average_price,
                 start = c(2015, 1),
                 frequency = 52)
# Plot

autoplot(conv_houston_ts) +
  labs(title = "Time plot: nonorganic avocado weekly prices in Houston",
       y = "$") +
  geom_point(colour = "brown", shape = 21) +
  geom_path(colour = "brown")

ฝึกแบบจําลองการเรียนรู้ของเครื่อง
สร้างแบบจําลองการคาดการณ์ราคาสําหรับพื้นที่ Houston โดยอิง AutoRegressive Integrated Moving Average (ARIMA):
conv_houston_ts_arima <- auto.arima(conv_houston_ts,
                                    d = 1,
                                    approximation = F,
                                    stepwise = F,
                                    trace = T)
checkresiduals(conv_houston_ts_arima)

แสดงกราฟของการพยากรณ์จากแบบจําลอง Houston ARIMA:
conv_houston_ts_arima_fc <- forecast(conv_houston_ts_arima, h = 208)

autoplot(conv_houston_ts_arima_fc) + labs(subtitle = "Prediction of weekly prices of nonorganic avocados in Houston",
       y = "$") +
  geom_hline(yintercept = 2.5, linetype = 2, colour = "blue")
