你当前正在访问 Microsoft Azure Global Edition 技术文档网站。 如果需要访问由世纪互联运营的 Microsoft Azure 中国技术文档网站,请访问 https://docs.azure.cn。
向地图添加气泡层 (Android SDK)
本文介绍如何将数据源中的点数据呈现为地图上的气泡层。 气泡层将点呈现为地图上具有固定像素半径的圆。
注意
Azure Maps Android SDK 停用
适用于 Android 的 Azure Maps 本机 SDK 现已弃用,将于 2025 年 3 月 31 日停用。 为了避免服务中断,请在 2025 年 3 月 31 日之前迁移到 Azure Maps Web SDK。 有关详细信息,请参阅 Azure Maps Android SDK 迁移指南。
提示
默认情况下,气泡层将呈现数据源中所有几何图形的坐标。 若要限制层以便仅呈现点几何图形功能,请将层的 filter 选项设置为 eq(geometryType(), "Point")。 如果还需要包含 MultiPoint 特征,请将层的 filter 选项设置为 any(eq(geometryType(), "Point"), eq(geometryType(), "MultiPoint"))。
先决条件
请完成快速入门:创建 Android 应用一文中的步骤。 可以将本文中的代码块插入到地图的 onReady 事件处理程序中。
添加气泡层
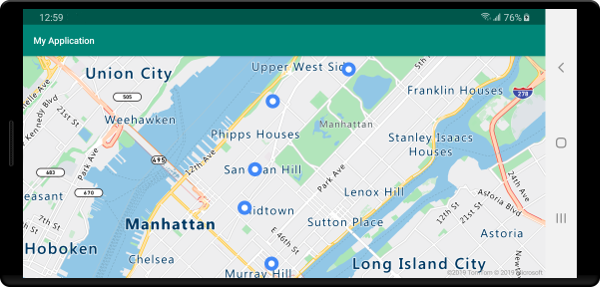
下面的代码将一个点数组加载到数据源中。 然后会将数据点连接到气泡层。 气泡层用五像素呈现每个气泡的半径,并使用白色为填充色。 描边色为蓝色,描边宽度为六像素。
//Create a data source and add it to the map.
DataSource source = new DataSource();
map.sources.add(source);

//Create point locations.
Point[] points = new Point[] {
    Point.fromLngLat(-73.985708, 40.75773),
    Point.fromLngLat(-73.985600, 40.76542),
    Point.fromLngLat(-73.985550, 40.77900),
    Point.fromLngLat(-73.975550, 40.74859),
    Point.fromLngLat(-73.968900, 40.78859)
};

//Add multiple points to the data source.
source.add(points);

//Create a bubble layer to render the filled in area of the circle, and add it to the map.
BubbleLayer layer = new BubbleLayer(source,
    bubbleRadius(5f),
    bubbleColor("white"),
    bubbleStrokeColor("#4288f7"),
    bubbleStrokeWidth(6f)
);

map.layers.add(layer);
//Create a data source and add it to the map.
val source = DataSource()
map.sources.add(source)

//Create point locations.
val points: Array<Point> = arrayOf<Point>(
    Point.fromLngLat(-73.985708, 40.75773),
    Point.fromLngLat(-73.985600, 40.76542),
    Point.fromLngLat(-73.985550, 40.77900),
    Point.fromLngLat(-73.975550, 40.74859),
    Point.fromLngLat(-73.968900, 40.78859)
)

//Add multiple points to the data source.
source.add(points)

//Create a bubble layer to render the filled in area of the circle, and add it to the map.
val layer = BubbleLayer(
    source,
    bubbleRadius(5f),
    bubbleColor("white"),
    bubbleStrokeColor("#4288f7"),
    bubbleStrokeWidth(6f)
)

map.layers.add(layer)
下面的屏幕截图展示上述代码在气泡层中呈现的点。
显示具有气泡层的标签
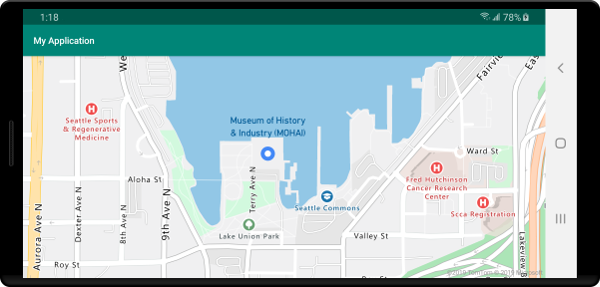
此代码演示如何使用气泡图层呈现地图上的点。 以及如何使用符号层呈现标签。 若要隐藏符号层的图标,请将 iconImage 选项设置为 "none"。
//Create a data source and add it to the map.
DataSource source = new DataSource();
map.sources.add(source);

//Add a data point to the map.
source.add(Point.fromLngLat(-122.336641,47.627631));

//Add a bubble layer.
map.layers.add(new BubbleLayer(source,
    bubbleRadius(5f),
    bubbleColor("white"),
    bubbleStrokeColor("#4288f7"),
    bubbleStrokeWidth(6f)
));

//Add a symbol layer to display text, hide the icon image.
map.layers.add(new SymbolLayer(source,
    //Hide the icon image.
    iconImage("none"),
    textField("Museum of History & Industry (MOHAI)"),
    textColor("#005995"),
    textOffset(new Float[]{0f, -2.2f})
));
//Create a data source and add it to the map.
val source = DataSource()
map.sources.add(source)

//Add a data point to the map.
source.add(Point.fromLngLat(-122.336641, 47.627631))

//Add a bubble layer.
map.layers.add(
    BubbleLayer(
        source,
        bubbleRadius(5f),
        bubbleColor("white"),
        bubbleStrokeColor("#4288f7"),
        bubbleStrokeWidth(6f)
    )
)

//Add a symbol layer to display text, hide the icon image.
map.layers.add(
    SymbolLayer(
        source,  //Hide the icon image.
        iconImage("none"),
        textField("Museum of History & Industry (MOHAI)"),
        textColor("#005995"),
        textOffset(arrayOf(0f, -2.2f))
    )
)
下面的屏幕截图展示上述代码在气泡层中呈现了一个点,以及使用符号层的点文本标签。
后续步骤
有关可向地图添加的更多代码示例,请参阅以下文章: