將多邊形圖層新增至地圖 (Android SDK)
本文說明如何使用多邊形圖層,在地圖上呈現 Polygon 和 MultiPolygon 特徵幾何的區域。
注意
Azure 地圖服務 Android SDK 淘汰
適用於 Android 的 Azure 地圖服務原生 SDK 現已被取代,將於 3/31/25 淘汰。 若要避免服務中斷,請在 3/31/25 之前遷移至 Azure 地圖服務 Web SDK。 如需詳細資訊,請參閱 Azure 地圖服務 Android SDK 移轉指南 (部分機器翻譯)。
必要條件
務必完成快速入門:建立 Android 應用程式文件中的步驟。 本文中的程式碼區塊可以插入地圖 onReady 事件處理常式中。
使用多邊形圖層
當多邊形圖層連線至資料來源並載入至地圖時,將會呈現具有 Polygon 和 MultiPolygon 特徵的區域。 若要建立多邊形,請將其新增至資料來源,並使用 PolygonLayer 類別和多邊形圖層加以呈現。
//Create a data source and add it to the map.
DataSource source = new DataSource();
map.sources.add(source);

//Create a rectangular polygon.
source.add(Polygon.fromLngLats(
    Arrays.asList(
        Arrays.asList(
            Point.fromLngLat(-73.98235, 40.76799),
            Point.fromLngLat(-73.95785, 40.80044),
            Point.fromLngLat(-73.94928, 40.79680),
            Point.fromLngLat(-73.97317, 40.76437),
            Point.fromLngLat(-73.98235, 40.76799)
        )
    )
));

//Create and add a polygon layer to render the polygon on the map, below the label layer.
map.layers.add(new PolygonLayer(source,
    fillColor("red"),
    fillOpacity(0.7f)
), "labels");
//Create a data source and add it to the map.
val source = DataSource()
map.sources.add(source)

//Create a rectangular polygon.
source.add(
    Polygon.fromLngLats(
        Arrays.asList(
            Arrays.asList(
                Point.fromLngLat(-73.98235, 40.76799),
                Point.fromLngLat(-73.95785, 40.80044),
                Point.fromLngLat(-73.94928, 40.79680),
                Point.fromLngLat(-73.97317, 40.76437),
                Point.fromLngLat(-73.98235, 40.76799)
            )
        )
    )
)

//Create and add a polygon layer to render the polygon on the map, below the label layer.
map.layers.add(
    PolygonLayer(
        source,
        fillColor("red"),
        fillOpacity(0.7f)
    ), "labels"
)
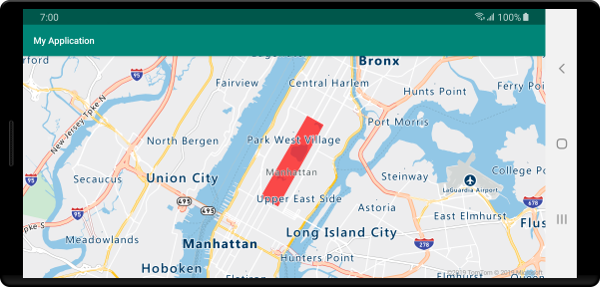
下列螢幕擷取畫面顯示上述程式碼,而此程式碼使用多邊形圖層來轉譯多邊形的區域。
同時使用多邊形和線條圖層
線條圖層可用來呈現多邊形的外框。 下列程式碼範例會呈現如同上述範例的多邊形,但現在會新增線條圖層。 此條線圖層是連線至資料來源的第二個圖層。
//Create a data source and add it to the map.
DataSource source = new DataSource();
map.sources.add(source);

//Create a rectangular polygon.
source.add(Polygon.fromLngLats(
    Arrays.asList(
        Arrays.asList(
            Point.fromLngLat(-73.98235, 40.76799),
            Point.fromLngLat(-73.95785, 40.80044),
            Point.fromLngLat(-73.94928, 40.79680),
            Point.fromLngLat(-73.97317, 40.76437),
            Point.fromLngLat(-73.98235, 40.76799)
        )
    )
));

//Create and add a polygon layer to render the polygon on the map, below the label layer.
map.layers.add(new PolygonLayer(source,
    fillColor("rgba(0, 200, 200, 0.5)")
), "labels");

//Create and add a line layer to render the outline of the polygon.
map.layers.add(new LineLayer(source,
    strokeColor("red"),
    strokeWidth(2f)
));
//Create a data source and add it to the map.
val source = DataSource()
map.sources.add(source)

//Create a rectangular polygon.
source.add(
    Polygon.fromLngLats(
        Arrays.asList(
            Arrays.asList(
                Point.fromLngLat(-73.98235, 40.76799),
                Point.fromLngLat(-73.95785, 40.80044),
                Point.fromLngLat(-73.94928, 40.79680),
                Point.fromLngLat(-73.97317, 40.76437),
                Point.fromLngLat(-73.98235, 40.76799)
            )
        )
    )
)

//Create and add a polygon layer to render the polygon on the map, below the label layer.
map.layers.add(
    PolygonLayer(
        source,
        fillColor("rgba(0, 200, 200, 0.5)")
    ), "labels"
)

//Create and add a line layer to render the outline of the polygon.
map.layers.add(
    LineLayer(
        source,
        strokeColor("red"),
        strokeWidth(2f)
    )
)
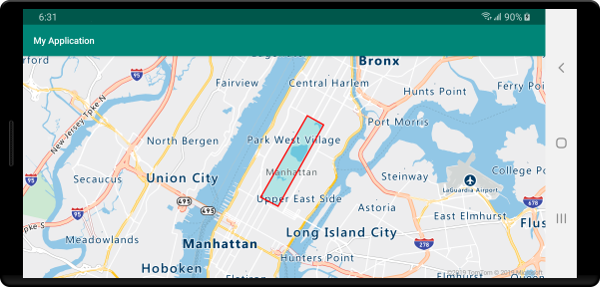
下列螢幕擷取畫面顯示上述程式碼,而此程式碼所轉譯的多邊形使用線條圖層來轉譯其外框。
提示
使用線條圖層來呈現多邊形外框時,請務必關閉多邊形中的所有環形,讓每個點陣列都有相同的起點和終點。 如果未這麼做,則線條圖層可能不會將多邊形的最後一個點連接至第一個點。
使用圖樣填滿多邊形
除了以色彩填滿多邊形以外,您還可以使用影像圖樣來填滿多邊形。 請將影像圖樣載入至地圖影像原件資源,然後使用多邊形圖層的 fillPattern 選項來參考此影像。
//Load an image pattern into the map image sprite.
map.images.add("fill-checker-red", R.drawable.fill_checker_red);

//Create a data source and add it to the map.
DataSource source = new DataSource();
map.sources.add(source);

//Create a polygon.
source.add(Polygon.fromLngLats(
    Arrays.asList(
        Arrays.asList(
            Point.fromLngLat(-50, -20),
            Point.fromLngLat(0, 40),
            Point.fromLngLat(50, -20),
            Point.fromLngLat(-50, -20)
        )
    )
));

//Create and add a polygon layer to render the polygon on the map, below the label layer.
map.layers.add(new PolygonLayer(source,
        fillPattern("fill-checker-red"),
        fillOpacity(0.5f)
), "labels");
//Load an image pattern into the map image sprite.
map.images.add("fill-checker-red", R.drawable.fill_checker_red)

//Create a data source and add it to the map.
val source = DataSource()
map.sources.add(source)

//Create a polygon.
source.add(
    Polygon.fromLngLats(
        Arrays.asList(
            Arrays.asList(
                Point.fromLngLat(-50, -20),
                Point.fromLngLat(0, 40),
                Point.fromLngLat(50, -20),
                Point.fromLngLat(-50, -20)
            )
        )
    )
)

//Create and add a polygon layer to render the polygon on the map, below the label layer.
map.layers.add(
    PolygonLayer(
        source,
        fillPattern("fill-checker-red"),
        fillOpacity(0.5f)
    ), "labels"
)
在此範例中,下列影像會載入至應用程式的可繪製資源資料夾。
 |
|---|
| fill-checker-red.png |
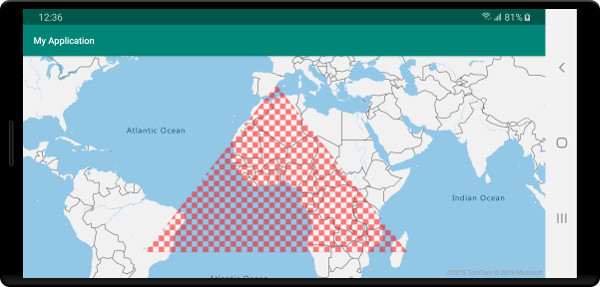
下圖是上述程式碼的螢幕擷取畫面,而此程式碼轉譯地圖上具有填滿圖樣的多邊形。
下一步
請參閱下列文章,以取得更多可新增至地圖的程式碼範例: