新增多邊形立體化圖層至地圖 (Android SDK)
本文說明如何使用多邊形立體化圖層,轉譯幾何圖形 Polygon 和 MultiPolygon 的區域為立體圖形。
注意
Azure 地圖服務 Android SDK 淘汰
適用於 Android 的 Azure 地圖服務 原生 SDK 現在已被取代,將於 3/31/25 淘汰。 若要避免服務中斷,請透過 3/31/25 移轉至 Azure 地圖服務 Web SDK。 如需詳細資訊,請參閱 Azure 地圖服務 Android SDK 移轉指南。
使用多邊形立體化圖層
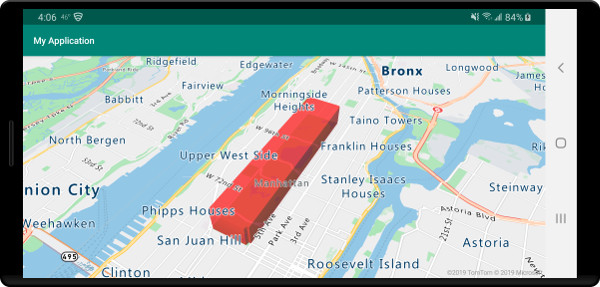
將多邊形立體化圖層連線至資料來源。 然後,在地圖上載入。 多邊形立體化圖層會轉譯圖形 Polygon 和 MultiPolygon 的區域為立體圖形。 多邊形立體化圖層的 height 和 base 屬性會以公尺為單位,定義與立體圖形底和高的基面距。 下列程式碼示範如何建立多邊形、新增多邊形至資料來源,及使用多邊形立體化圖層類別轉譯。
注意
多邊形立體化圖層中定義的 base 值應該小於或等於 height 的值。
//Create a data source and add it to the map.
DataSource source = new DataSource();
map.sources.add(source);

//Create a polygon.
source.add(Polygon.fromLngLats(
    Arrays.asList(
        Arrays.asList(
            Point.fromLngLat(-73.958383, 40.800279),
            Point.fromLngLat(-73.981547, 40.768459),
            Point.fromLngLat(-73.981246, 40.767761),
            Point.fromLngLat(-73.973618, 40.764616),
            Point.fromLngLat(-73.973060, 40.765128),
            Point.fromLngLat(-73.972599, 40.764908),
            Point.fromLngLat(-73.949446, 40.796584),
            Point.fromLngLat(-73.949661, 40.797088),
            Point.fromLngLat(-73.957815, 40.800523),
            Point.fromLngLat(-73.958383, 40.800279)
        )
    )
));

//Create and add a polygon extrusion layer to the map below the labels so that they are still readable.
PolygonExtrusionLayer layer = new PolygonExtrusionLayer(source,
    fillColor("#fc0303"),
    fillOpacity(0.7f),
    height(500f)
);

//Create and add a polygon extrusion layer to the map below the labels so that they are still readable.
map.layers.add(layer, "labels");
//Create a data source and add it to the map.
val source = DataSource()
map.sources.add(source)

//Create a polygon.
source.add(
    Polygon.fromLngLats(
        Arrays.asList(
            Arrays.asList(
                Point.fromLngLat(-73.958383, 40.800279),
                Point.fromLngLat(-73.981547, 40.768459),
                Point.fromLngLat(-73.981246, 40.767761),
                Point.fromLngLat(-73.973618, 40.764616),
                Point.fromLngLat(-73.973060, 40.765128),
                Point.fromLngLat(-73.972599, 40.764908),
                Point.fromLngLat(-73.949446, 40.796584),
                Point.fromLngLat(-73.949661, 40.797088),
                Point.fromLngLat(-73.957815, 40.800523),
                Point.fromLngLat(-73.958383, 40.800279)
            )
        )
    )
)

//Create and add a polygon extrusion layer to the map below the labels so that they are still readable.
val layer = PolygonExtrusionLayer(
    source,
    fillColor("#fc0303"),
    fillOpacity(0.7f),
    height(500f)
)

//Create and add a polygon extrusion layer to the map below the labels so that they are still readable.
map.layers.add(layer, "labels")
下列螢幕擷取畫面顯示上述程式碼,即使用多邊形立體化圖層轉譯垂直縮放的多邊形。
新增資料驅動多邊形
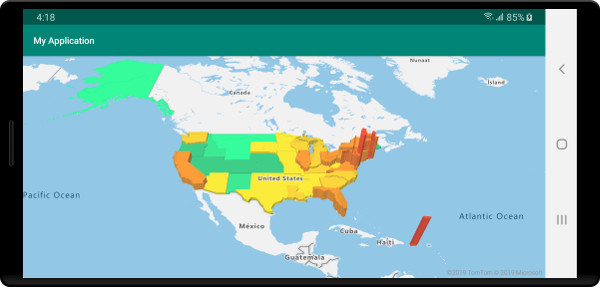
您可以使用多邊形立體化圖層轉譯分區著色圖。 將立體化圖層的 height 和 fillColor 屬性設為幾何圖形 Polygon 和 MultiPolygon 的統計變數量測。 下列程式碼範例示範根據州別人口密度量測的美國立體分區著色圖。
//Create a data source and add it to the map.
DataSource source = new DataSource();

//Import the geojson data and add it to the data source.
source.importDataFromUrl("https://samples.azuremaps.com/data/geojson/US_States_Population_Density.json");

//Add data source to the map.
map.sources.add(source);

//Create and add a polygon extrusion layer to the map below the labels so that they are still readable.
PolygonExtrusionLayer layer = new PolygonExtrusionLayer(source,
    fillOpacity(0.7f),
    fillColor(
        step(
            get("density"),
            literal("rgba(0, 255, 128, 1)"),
            stop(10, "rgba(9, 224, 118, 1)"),
            stop(20, "rgba(11, 191, 103, 1)"),
            stop(50, "rgba(247, 227, 5, 1)"),
            stop(100, "rgba(247, 199, 7, 1)"),
            stop(200, "rgba(247, 130, 5, 1)"),
            stop(500, "rgba(247, 94, 5, 1)"),
            stop(1000, "rgba(247, 37, 5, 1)")
        )
    ),
    height(
        interpolate(
            linear(),
            get("density"),
            stop(0, 100),
            stop(1200, 960000)
        )
    )
);

//Create and add a polygon extrusion layer to the map below the labels so that they are still readable.
map.layers.add(layer, "labels");
//Create a data source and add it to the map.
val source = DataSource()

//Import the geojson data and add it to the data source.
source.importDataFromUrl("https://samples.azuremaps.com/data/geojson/US_States_Population_Density.json")

//Add data source to the map.
map.sources.add(source)

//Create and add a polygon extrusion layer to the map below the labels so that they are still readable.
val layer = PolygonExtrusionLayer(
    source,
    fillOpacity(0.7f),
    fillColor(
        step(
            get("density"),
            literal("rgba(0, 255, 128, 1)"),
            stop(10, "rgba(9, 224, 118, 1)"),
            stop(20, "rgba(11, 191, 103, 1)"),
            stop(50, "rgba(247, 227, 5, 1)"),
            stop(100, "rgba(247, 199, 7, 1)"),
            stop(200, "rgba(247, 130, 5, 1)"),
            stop(500, "rgba(247, 94, 5, 1)"),
            stop(1000, "rgba(247, 37, 5, 1)")
        )
    ),
    height(
        interpolate(
            linear(),
            get("density"),
            stop(0, 100),
            stop(1200, 960000)
        )
    )
)

//Create and add a polygon extrusion layer to the map below the labels so that they are still readable.
map.layers.add(layer, "labels")
下列螢幕擷取畫面顯示根據人口密度,以立體多邊形垂直縮放的美國各州分區著色圖。
下一步
請參閱下列文章,以取得更多可新增至地圖的程式碼範例: