將時間序列深入解析 Gen2 遷移至 Microsoft Fabric 中的即時智慧
注意
時間序列深入解析服務將於 2024 年 7 月 7 日淘汰。 請考慮儘快將現有的環境移轉至替代解決方案。 如需淘汰和移轉的詳細資訊,請造訪我們的文件。
概觀
Eventhouse 是即時智慧中的時間序列資料庫。 其可作為從時間序列深入解析移轉數據的目標。
高階移轉建議。
| 功能 | 建議移轉 |
|---|---|
| 使用扁平化和逸出從中樞擷取 JSON | 從 Azure 事件中樞 取得數據 |
| 開啟冷存放區 | Eventhouse OneLake 可用性 |
| Power BI 連接器 | 使用 Eventhouse Power BI 連接器。 手動重寫 TSQ to KQL。 |
| Spark 連接器 | 將數據遷移至 Eventhouse。 搭配 Apache Spark 使用筆記本來查詢 Eventhouse ,或使用 筆記本探索 Lakehouse 中的數據 |
| 大量上傳 | 從 Azure 記憶體取得數據 |
| 時間序列模型 | 可以匯出為 JSON 檔案。 可以 匯入 Eventhouse。 Kusto Graph 語意 允許模型、周遊和分析時間序列模型階層做為圖形 |
| 時間序列總管 | 使用 KustoTrender 即時儀錶板、Power BI 報表或撰寫自定義儀錶板 |
| 查詢語言 | 在 KQL 中重寫查詢。 |
移轉遙測
若要擷取環境中所有數據的複本,請使用 PT=Time 記憶體帳戶中的資料夾。 如需詳細資訊,請參閱 數據記憶體。
移轉步驟 1 – 取得遙測數據的統計數據
資料
- Env 概觀
- 來自數據存取 FQDN 第一部分的記錄環境標識碼(例如 d390b0-1445-4c0c-8365-68d6382c1c2a From .env.crystal-dev.windows-int.net)
- Env 概觀 -> 記憶體組態 -> 記憶體帳戶
- 使用 儲存體總管 來取得資料夾統計數據
- 記錄大小和資料夾的
PT=TimeBlob 數目。
- 記錄大小和資料夾的
移轉步驟 2 – 將數據遷移至 Eventhouse
建立 Eventhouse
若要為您的移轉程式設定 Eventhouse,請遵循建立 Eventhouse 中的步驟。
資料擷取
若要擷取對應至時間序列深入解析實例之記憶體帳戶的數據,請遵循從 Azure 儲存體 取得數據的步驟。
請確定您:
將檔案篩選資料夾路徑設定為
V=1/PT=Time篩選相關的 Blob。確認推斷的架構,並移除任何不常查詢的數據行,同時保留至少時間戳、TSID 數據行和值。 為了確保所有數據都複製到 Eventhouse,請新增另一個數據行,並使用 DropMappedFields 對應轉換。
完成擷取程式。
查詢資料
既然您已成功擷取數據,您可以使用 KQL 查詢集開始探索數據。 如果您需要從自定義用戶端應用程式存取數據,Eventhouse 會為主要程式設計語言提供 SDK,例如 C# (link)、Java(link)和Node.js (link)。
將時間序列模型遷移至 Azure 數據總管
此模型可以使用 TSI Explorer UX 或 TSM Batch API,從 TSI 環境下載 JSON 格式。 然後可以將模型匯入 Eventhouse。
從 TSI UX 下載 TSM。
使用 Visual Studio Code 或其他編輯器刪除前三行。
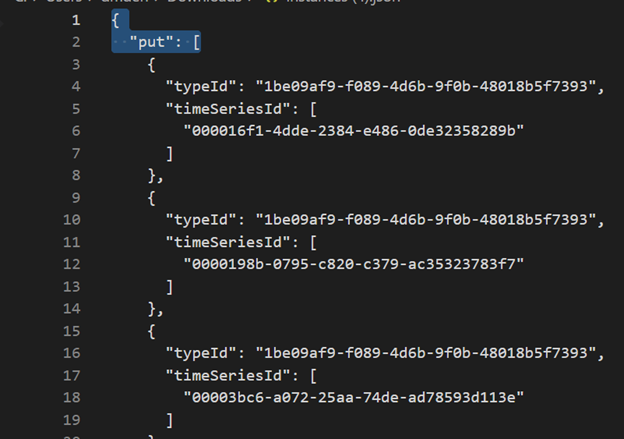
使用 Visual Studio Code 或其他編輯器,搜尋並取代為 regex
\},\n \{}{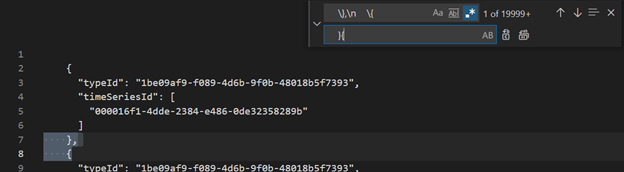
使用 從單一檔案取得數據,將 JSON 擷取為 ADX 作為個別數據表。


將時間序列數據遷移至 Fabric 即時智慧中的 Eventhouse 之後,您就可以使用 Kusto Graph 語意的強大功能來將您的數據內容化和分析。 Kusto Graph 語意可讓您將時間序列模型階層模型、周遊及分析為圖形。 藉由使用 Kusto Graph 語意,您可以深入瞭解時間序列數據中不同實體之間的關聯性,例如資產、網站和數據點。 這些深入解析可協助您了解系統各種元件之間的相依性和互動。
將時間序列查詢 (TSQ) 轉譯為 KQL
GetEvents
{
  "getEvents": {
    "timeSeriesId": [
      "assest1",
      "siteId1",
      "dataId1"
    ],
    "searchSpan": {
      "from": "2021-11-01T00:00:0.0000000Z",
      "to": "2021-11-05T00:00:00.000000Z"
    },
    "inlineVariables": {},
  }
}
events
| where timestamp >= datetime(2021-11-01T00:00:0.0000000Z) and timestamp < datetime(2021-11-05T00:00:00.000000Z)
| where assetId_string == "assest1" and siteId_string == "siteId1" and dataid_string == "dataId1"
| take 10000
使用篩選的 GetEvents
{
  "getEvents": {
    "timeSeriesId": [
      "deviceId1",
      "siteId1",
      "dataId1"
    ],
    "searchSpan": {
      "from": "2021-11-01T00:00:0.0000000Z",
      "to": "2021-11-05T00:00:00.000000Z"
    },
    "filter": {
      "tsx": "$event.sensors.sensor.String = 'status' AND $event.sensors.unit.String = 'ONLINE"
    }
  }
}
events
| where timestamp >= datetime(2021-11-01T00:00:0.0000000Z) and timestamp < datetime(2021-11-05T00:00:00.000000Z)
| where deviceId_string== "deviceId1" and siteId_string == "siteId1" and dataId_string == "dataId1"
| where ['sensors.sensor_string'] == "status" and ['sensors.unit_string'] == "ONLINE"
| take 10000
具有投影變數的 GetEvents
{
  "getEvents": {
    "timeSeriesId": [
      "deviceId1",
      "siteId1",
      "dataId1"
    ],
    "searchSpan": {
      "from": "2021-11-01T00:00:0.0000000Z",
      "to": "2021-11-05T00:00:00.000000Z"
    },
    "inlineVariables": {},
    "projectedVariables": [],
    "projectedProperties": [
      {
        "name": "sensors.value",
        "type": "String"
      },
      {
        "name": "sensors.value",
        "type": "bool"
      },
      {
        "name": "sensors.value",
        "type": "Double"
      }
    ]
  }
}
events
| where timestamp >= datetime(2021-11-01T00:00:0.0000000Z) and timestamp < datetime(2021-11-05T00:00:00.000000Z)
| where deviceId_string== "deviceId1" and siteId_string == "siteId1" and dataId_string == "dataId1"
| take 10000
| project timestamp, sensorStringValue= ['sensors.value_string'], sensorBoolValue= ['sensors.value_bool'], sensorDoublelValue= ['sensors.value_double']
AggregateSeries
{
  "aggregateSeries": {
    "timeSeriesId": [
      "deviceId1"
    ],
    "searchSpan": {
      "from": "2021-11-01T00:00:00.0000000Z",
      "to": "2021-11-05T00:00:00.0000000Z"
    },
    "interval": "PT1M",
    "inlineVariables": {
      "sensor": {
        "kind": "numeric",
        "value": {
          "tsx": "coalesce($event.sensors.value.Double, todouble($event.sensors.value.Long))"
        },
        "aggregation": {
          "tsx": "avg($value)"
        }
      }
    },
    "projectedVariables": [
      "sensor"
    ]
  }
events
| where timestamp >= datetime(2021-11-01T00:00:00.0000000Z) and timestamp < datetime(2021-11-05T00:00:00.0000000Z)
| where  deviceId_string == "deviceId1"
| summarize avgSensorValue= avg(coalesce(['sensors.value_double'], todouble(['sensors.value_long']))) by bin(IntervalTs = timestamp, 1m)
| project IntervalTs, avgSensorValue
具有篩選的 AggregateSeries
{
  "aggregateSeries": {
    "timeSeriesId": [
      "deviceId1"
    ],
    "searchSpan": {
      "from": "2021-11-01T00:00:00.0000000Z",
      "to": "2021-11-05T00:00:00.0000000Z"
    },
    "filter": {
      "tsx": "$event.sensors.sensor.String = 'heater' AND $event.sensors.location.String = 'floor1room12'"
    },
    "interval": "PT1M",
    "inlineVariables": {
      "sensor": {
        "kind": "numeric",
        "value": {
          "tsx": "coalesce($event.sensors.value.Double, todouble($event.sensors.value.Long))"
        },
        "aggregation": {
          "tsx": "avg($value)"
        }
      }
    },
    "projectedVariables": [
      "sensor"
    ]
  }
}
events
| where timestamp >= datetime(2021-11-01T00:00:00.0000000Z) and timestamp < datetime(2021-11-05T00:00:00.0000000Z)
| where  deviceId_string == "deviceId1"
| where ['sensors.sensor_string'] == "heater" and ['sensors.location_string'] == "floor1room12"
| summarize avgSensorValue= avg(coalesce(['sensors.value_double'], todouble(['sensors.value_long']))) by bin(IntervalTs = timestamp, 1m)
| project IntervalTs, avgSensorValue
Power BI
移轉以時間序列深入解析為基礎的Power BI報表沒有自動化程式。 所有依賴時間序列深入解析中所儲存數據的查詢都必須遷移至 Eventhouse。
若要在Power BI 中建立有效率的時間序列報表,建議您參閱下列資訊豐富的部落格文章:
- Power BI 中的 Eventhouse 時間序列功能
- 如何使用 M 動態參數,但沒有任何限制
- KQL、Power Query 和 Power BI 中的 Timespan/duration 值
- Power BI 中的 KQL 查詢設定
- 在當地時間篩選和可視化 Kusto 數據
- PBI + Kusto 中的近乎實時報告
- 使用 ADX 建立 Power BI 模型 - 速查表
如需在Power BI 中建立有效時間序列報表的指引,請參閱這些資源。
即時儀錶板
Fabric 中的即時儀錶板是磚集合,可選擇性地組織在頁面中,其中每個磚都有基礎查詢和可視化表示。 您可以將 Kusto 查詢語言 (KQL) 查詢原生匯出至儀錶板作為視覺效果,稍後視需要修改其基礎查詢和視覺效果格式。 除了輕鬆探索數據之外,這個完全整合的儀錶板體驗也提供改善的查詢和視覺效果效能。
首先,在網狀架構即時智慧中建立新的儀錶板。 這項功能強大的功能可讓您探索數據、自定義視覺效果、套用條件式格式設定,以及利用參數。 此外,您可以直接從即時儀錶板建立警示,以增強監視功能。 如需如何建立儀錶板的詳細指示,請參閱 官方檔。
意見反應
即將登場:在 2024 年,我們將逐步淘汰 GitHub 問題作為內容的意見反應機制,並將它取代為新的意見反應系統。 如需詳細資訊,請參閱:https://aka.ms/ContentUserFeedback。
提交並檢視相關的意見反應