Tutorial: Analyze functional dependencies in a semantic model
In this tutorial, you build upon prior work done by a Power BI analyst and stored in the form of semantic models (Power BI datasets). By using SemPy (preview) in the Synapse Data Science experience within Microsoft Fabric, you analyze functional dependencies that exist in columns of a DataFrame. This analysis helps to discover nontrivial data quality issues in order to gain more accurate insights.
In this tutorial, you learn how to:
- Apply domain knowledge to formulate hypotheses about functional dependencies in a semantic model.
- Get familiarized with components of semantic link's Python library (SemPy) that support integration with Power BI and help to automate data quality analysis. These components include:
- FabricDataFrame - a pandas-like structure enhanced with additional semantic information.
- Useful functions for pulling semantic models from a Fabric workspace into your notebook.
- Useful functions that automate the evaluation of hypotheses about functional dependencies and that identify violations of relationships in your semantic models.
Prerequisites
Get a Microsoft Fabric subscription. Or, sign up for a free Microsoft Fabric trial.
Sign in to Microsoft Fabric.
Use the experience switcher on the left side of your home page to switch to the Synapse Data Science experience.
Select Workspaces from the left navigation pane to find and select your workspace. This workspace becomes your current workspace.
Download the Customer Profitability Sample.pbix semantic model from the fabric-samples GitHub repository and upload it to your workspace.
Follow along in the notebook
The powerbi_dependencies_tutorial.ipynb notebook accompanies this tutorial.
To open the accompanying notebook for this tutorial, follow the instructions in Prepare your system for data science tutorials, to import the notebook to your workspace.
If you'd rather copy and paste the code from this page, you can create a new notebook.
Be sure to attach a lakehouse to the notebook before you start running code.
Set up the notebook
In this section, you set up a notebook environment with the necessary modules and data.
Install
SemPyfrom PyPI using the%pipin-line installation capability within the notebook:%pip install semantic-linkPerform necessary imports of modules that you'll need later:
import sempy.fabric as fabric
from sempy.dependencies import plot_dependency_metadata
Load and preprocess the data
This tutorial uses a standard sample semantic model Customer Profitability Sample.pbix. For a description of the semantic model, see Customer Profitability sample for Power BI.
Load the Power BI data into FabricDataFrames, using SemPy's
read_tablefunction:dataset = "Customer Profitability Sample" customer = fabric.read_table(dataset, "Customer") customer.head()Load the
Statetable into a FabricDataFrame:state = fabric.read_table(dataset, "State") state.head()While the output of this code looks like a pandas DataFrame, you've actually initialized a data structure called a
FabricDataFramethat supports some useful operations on top of pandas.Check the data type of
customer:type(customer)The output confirms that
customeris of typesempy.fabric._dataframe._fabric_dataframe.FabricDataFrame.`Join the
customerandstateDataFrames:customer_state_df = customer.merge(state, left_on="State", right_on="StateCode", how='left') customer_state_df.head()
Identify functional dependencies
A functional dependency manifests itself as a one-to-many relationship between the values in two (or more) columns within a DataFrame. These relationships can be used to automatically detect data quality problems.
Run SemPy's
find_dependenciesfunction on the merged DataFrame to identify any existing functional dependencies between values in the columns:dependencies = customer_state_df.find_dependencies() dependenciesVisualize the identified dependencies by using SemPy's
plot_dependency_metadatafunction:plot_dependency_metadata(dependencies)
As expected, the functional dependencies graph shows that the
Customercolumn determines some columns likeCity,Postal Code, andName.Surprisingly, the graph doesn't show a functional dependency between
CityandPostal Code, probably because there are many violations in the relationships between the columns. You can use SemPy'splot_dependency_violationsfunction to visualize violations of dependencies between specific columns.

Explore the data for quality issues
Draw a graph with SemPy's
plot_dependency_violationsvisualization function.customer_state_df.plot_dependency_violations('Postal Code', 'City')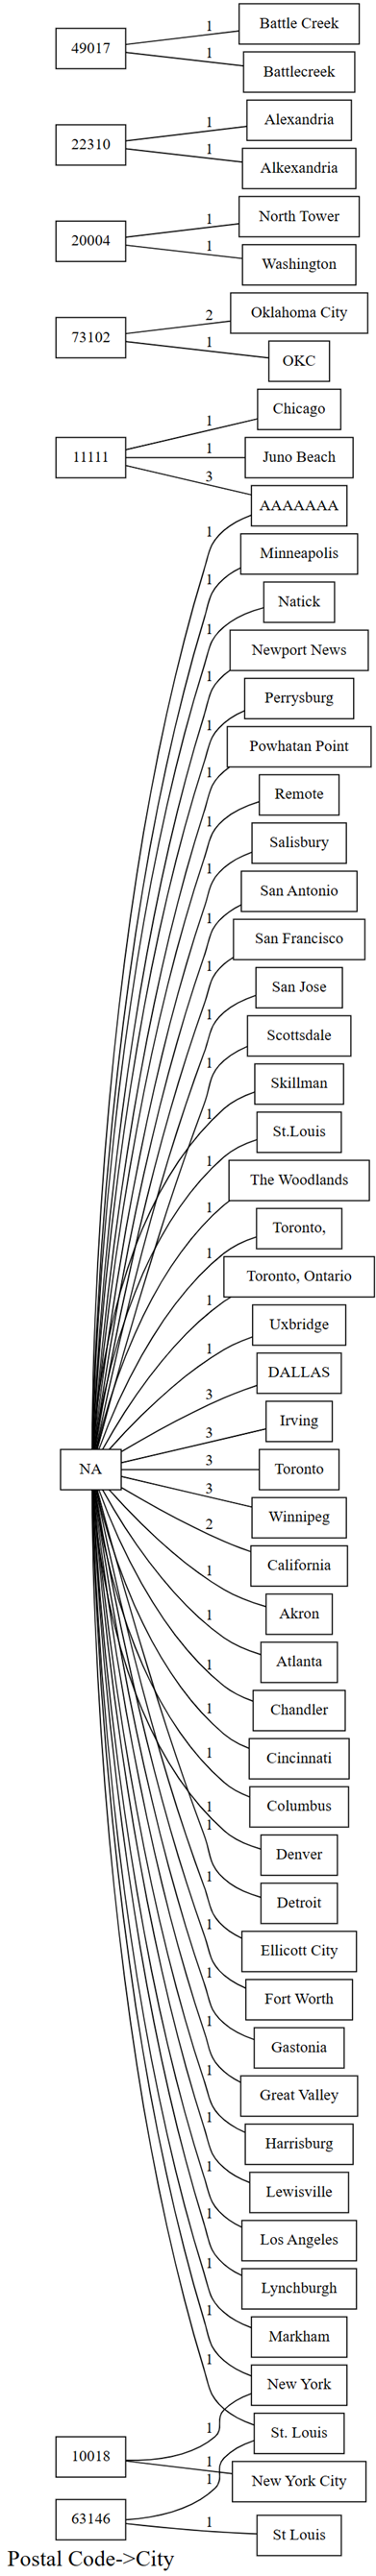
The plot of dependency violations shows values for
Postal Codeon the left hand side, and values forCityon the right hand side. An edge connects aPostal Codeon the left hand side with aCityon the right hand side if there's a row that contains these two values. The edges are annotated with the count of such rows. For example, there are two rows with postal code 20004, one with city "North Tower" and the other with city "Washington".Moreover, the plot shows a few violations and many empty values.
Confirm the number of empty values for
Postal Code:customer_state_df['Postal Code'].isna().sum()50 rows have NA for postal code.
Drop rows with empty values. Then, find dependencies using the
find_dependenciesfunction. Notice the extra parameterverbose=1that offers a glimpse into the internal workings of SemPy:customer_state_df2=customer_state_df.dropna() customer_state_df2.find_dependencies(verbose=1)The conditional entropy for
Postal CodeandCityis 0.049. This value indicates that there are functional dependency violations. Before you fix the violations, raise the threshold on conditional entropy from the default value of0.01to0.05, just to see the dependencies. Lower thresholds result in fewer dependencies (or higher selectivity).Raise the threshold on conditional entropy from the default value of
0.01to0.05:plot_dependency_metadata(customer_state_df2.find_dependencies(threshold=0.05))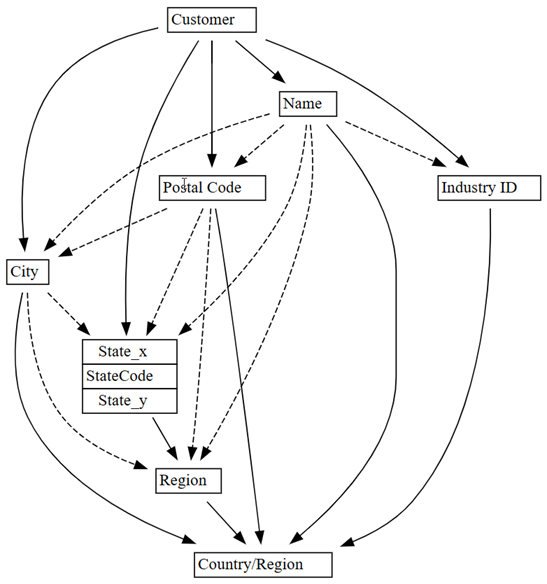
If you apply domain knowledge of which entity determines values of other entities, this dependencies graph seems accurate.
Explore more data quality issues that were detected. For example, a dashed arrow joins
CityandRegion, which indicates that the dependency is only approximate. This approximate relationship could imply that there's a partial functional dependency.customer_state_df.list_dependency_violations('City', 'Region')Take a closer look at each of the cases where a nonempty
Regionvalue causes a violation:customer_state_df[customer_state_df.City=='Downers Grove']The result shows Downers Grove city occurring in Illinois and Nebraska. However, Downer's Grove is a city in Illinois, not Nebraska.
Take a look at the city of Fremont:
customer_state_df[customer_state_df.City=='Fremont']There's a city called Fremont in California. However, for Texas, the search engine returns Premont, not Fremont.
It's also suspicious to see violations of the dependency between
NameandCountry/Region, as signified by the dotted line in the original graph of dependency violations (before dropping the rows with empty values).customer_state_df.list_dependency_violations('Name', 'Country/Region')It appears that one customer, SDI Design is present in two regions - United States and Canada. This occurrence may not be a semantic violation, but may just be an uncommon case. Still, it's worth taking a close look:
Take a closer look at the customer SDI Design:
customer_state_df[customer_state_df.Name=='SDI Design']Further inspection shows that it's actually two different customers (from different industries) with the same name.

Exploratory data analysis is an exciting process, and so is data cleaning. There's always something that the data is hiding, depending on how you look at it, what you want to ask, and so on. Semantic link provides you with new tools that you can use to achieve more with your data.
Related content
Check out other tutorials for semantic link / SemPy:
- Tutorial: Clean data with functional dependencies
- Tutorial: Extract and calculate Power BI measures from a Jupyter notebook
- Tutorial: Discover relationships in a semantic model, using semantic link
- Tutorial: Discover relationships in the Synthea dataset, using semantic link
- Tutorial: Validate data using SemPy and Great Expectations (GX) (preview)
الملاحظات
قريبًا: خلال عام 2024، سنتخلص تدريجيًا من GitHub Issues بوصفها آلية إرسال ملاحظات للمحتوى ونستبدلها بنظام ملاحظات جديد. لمزيد من المعلومات، راجع https://aka.ms/ContentUserFeedback.
إرسال الملاحظات وعرضها المتعلقة بـ