Tutorial: Extract and calculate Power BI measures from a Jupyter notebook
This tutorial illustrates how to use SemPy (preview) to calculate measures in semantic models (Power BI datasets).
In this tutorial, you learn how to:
- Evaluate Power BI measures programmatically via a Python interface of semantic link's Python library (SemPy).
- Get familiarized with components of SemPy that help to bridge the gap between AI and BI. These components include:
- FabricDataFrame - a pandas-like structure enhanced with additional semantic information.
- Useful functions that allow you to fetch semantic models, including raw data, configurations, and measures.
Prerequisites
Get a Microsoft Fabric subscription. Or, sign up for a free Microsoft Fabric trial.
Sign in to Microsoft Fabric.
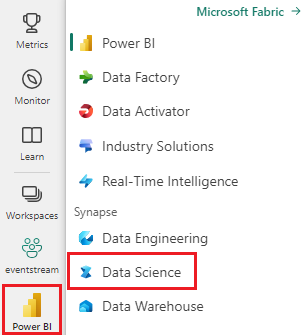
Use the experience switcher on the left side of your home page to switch to the Synapse Data Science experience.
Select Workspaces from the left navigation pane to find and select your workspace. This workspace becomes your current workspace.
Download the Retail Analysis Sample PBIX.pbix semantic model and upload it to your workspace.
Follow along in the notebook
The powerbi_measures_tutorial.ipynb notebook accompanies this tutorial.
To open the accompanying notebook for this tutorial, follow the instructions in Prepare your system for data science tutorials, to import the notebook to your workspace.
If you'd rather copy and paste the code from this page, you can create a new notebook.
Be sure to attach a lakehouse to the notebook before you start running code.
Set up the notebook
In this section, you set up a notebook environment with the necessary modules and data.
Install
SemPyfrom PyPI using the%pipin-line installation capability within the notebook:%pip install semantic-linkPerform necessary imports of modules that you'll need later:
import sempy.fabric as fabricYou can connect to the Power BI workspace. List the semantic models in the workspace:
fabric.list_datasets()Load the semantic model. In this tutorial, you use the Retail Analysis Sample PBIX semantic model:
dataset = "Retail Analysis Sample PBIX"
List workspace measures
List measures in the semantic model, using SemPy's list_measures function as follows:
fabric.list_measures(dataset)
Evaluate measures
In this section, you evaluate measures in various ways, using SemPy's evaluate_measure function.
Evaluate a raw measure
In the following code, use SemPy's evaluate_measure function to calculate a preconfigured measure that is called "Average Selling Area Size". You can see the underlying formula for this measure in the output of the previous cell.
fabric.evaluate_measure(dataset, measure="Average Selling Area Size")
Evaluate a measure with groupby_columns
You can group the measure output by certain columns by supplying the extra parameter groupby_columns:
fabric.evaluate_measure(dataset, measure="Average Selling Area Size", groupby_columns=["Store[Chain]", "Store[DistrictName]"])
In the previous code, you grouped by the columns Chain and DistrictName of the Store table in the semantic model.
Evaluate a measure with filters
You can also use the filters parameter to specify specific values that the result can contain for particular columns:
fabric.evaluate_measure(dataset, \
                        measure="Total Units Last Year", \
                        groupby_columns=["Store[Territory]"], \
                        filters={"Store[Territory]": ["PA", "TN", "VA"], "Store[Chain]": ["Lindseys"]})
In the previous code, Store is the name of the table, Territory is the name of the column, and PA is one of the values that the filter allows.
Evaluate a measure across multiple tables
You can group the measure by columns that span across multiple tables in the semantic model.
fabric.evaluate_measure(dataset, measure="Total Units Last Year", groupby_columns=["Store[Territory]", "Sales[ItemID]"])
Evaluate multiple measures
The function evaluate_measure allows you to supply identifiers of multiple measures and output the calculated values in the same DataFrame:
fabric.evaluate_measure(dataset, measure=["Average Selling Area Size", "Total Stores"], groupby_columns=["Store[Chain]", "Store[DistrictName]"])
Use Power BI XMLA connector
The default semantic model client is backed by Power BI's REST APIs. If there are any issues running queries with this client, it's possible to switch the back end to Power BI's XMLA interface using use_xmla=True. The SemPy parameters remain the same for measure calculation with XMLA.
fabric.evaluate_measure(dataset, \
                        measure=["Average Selling Area Size", "Total Stores"], \
                        groupby_columns=["Store[Chain]", "Store[DistrictName]"], \
                        filters={"Store[Territory]": ["PA", "TN", "VA"], "Store[Chain]": ["Lindseys"]}, \
                        use_xmla=True)
Related content
Check out other tutorials for semantic link / SemPy:
- Tutorial: Clean data with functional dependencies
- Tutorial: Analyze functional dependencies in a sample semantic model
- Tutorial: Discover relationships in a semantic model, using semantic link
- Tutorial: Discover relationships in the Synthea dataset, using semantic link (preview)
- Tutorial: Validate data using SemPy and Great Expectations (GX) (preview)
الملاحظات
قريبًا: خلال عام 2024، سنتخلص تدريجيًا من GitHub Issues بوصفها آلية إرسال ملاحظات للمحتوى ونستبدلها بنظام ملاحظات جديد. لمزيد من المعلومات، راجع https://aka.ms/ContentUserFeedback.
إرسال الملاحظات وعرضها المتعلقة بـ