Tutorial: Discover relationships in a semantic model, using semantic link
This tutorial illustrates how to interact with Power BI from a Jupyter notebook and detect relationships between tables with the help of the SemPy library.
In this tutorial, you learn how to:
- Discover relationships in a semantic model (Power BI dataset), using semantic link's Python library (SemPy).
- Use components of SemPy that support integration with Power BI and help to automate data quality analysis. These components include:
- FabricDataFrame - a pandas-like structure enhanced with additional semantic information.
- Functions for pulling semantic models from a Fabric workspace into your notebook.
- Functions that automate the evaluation of hypotheses about functional dependencies and that identify violations of relationships in your semantic models.
Prerequisites
Get a Microsoft Fabric subscription. Or, sign up for a free Microsoft Fabric trial.
Sign in to Microsoft Fabric.
Use the experience switcher on the bottom left side of your home page to switch to Fabric.
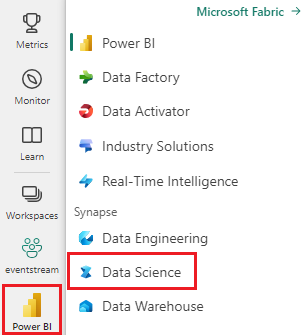
Select Workspaces from the left navigation pane to find and select your workspace. This workspace becomes your current workspace.
Download the Customer Profitability Sample.pbix and Customer Profitability Sample (auto).pbix semantic models from the fabric-samples GitHub repository and upload them to your workspace.
Follow along in the notebook
The powerbi_relationships_tutorial.ipynb notebook accompanies this tutorial.
To open the accompanying notebook for this tutorial, follow the instructions in Prepare your system for data science tutorials to import the notebook to your workspace.
If you'd rather copy and paste the code from this page, you can create a new notebook.
Be sure to attach a lakehouse to the notebook before you start running code.
Set up the notebook
In this section, you set up a notebook environment with the necessary modules and data.
Install
SemPyfrom PyPI using the%pipin-line installation capability within the notebook:%pip install semantic-linkPerform necessary imports of SemPy modules that you'll need later:
import sempy.fabric as fabric

from sempy.relationships import plot_relationship_metadata
from sempy.relationships import find_relationships
from sempy.fabric import list_relationship_violations
Import pandas for enforcing a configuration option that helps with output formatting:
import pandas as pd
pd.set_option('display.max_colwidth', None)
Explore semantic models
This tutorial uses a standard sample semantic model Customer Profitability Sample.pbix. For a description of the semantic model, see Customer Profitability sample for Power BI.
Use SemPy's
list_datasetsfunction to explore semantic models in your current workspace:fabric.list_datasets()
For the rest of this notebook you use two versions of the Customer Profitability Sample semantic model:
- Customer Profitability Sample: the semantic model as it comes from Power BI samples with predefined table relationships
- Customer Profitability Sample (auto): the same data, but relationships are limited to those ones that Power BI would autodetect.
Extract a sample semantic model with its predefined semantic model
Load relationships that are predefined and stored within the Customer Profitability Sample semantic model, using SemPy's
list_relationshipsfunction. This function lists from the Tabular Object Model:dataset = "Customer Profitability Sample" relationships = fabric.list_relationships(dataset) relationshipsVisualize the
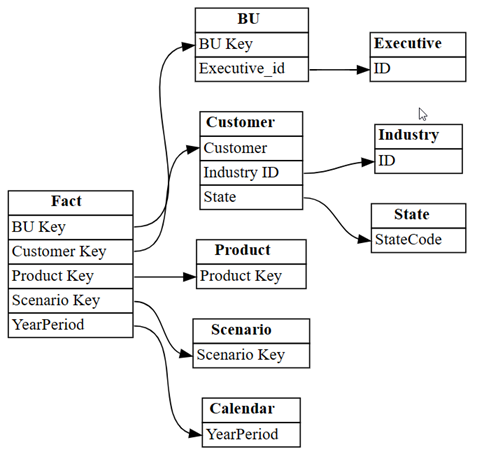
relationshipsDataFrame as a graph, using SemPy'splot_relationship_metadatafunction:plot_relationship_metadata(relationships)
This graph shows the "ground truth" for relationships between tables in this semantic model, as it reflects how they were defined in Power BI by a subject matter expert.
Complement relationships discovery
If you started with relationships that Power BI autodetected, you'd have a smaller set.
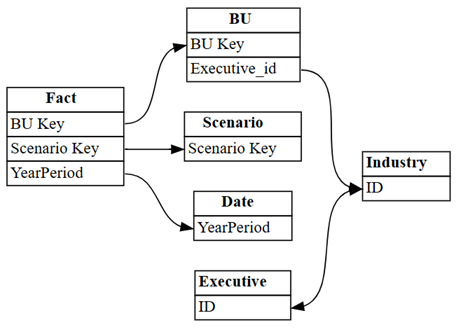
Visualize the relationships that Power BI autodetected in the semantic model:
dataset = "Customer Profitability Sample (auto)"
autodetected = fabric.list_relationships(dataset)
plot_relationship_metadata(autodetected)
Power BI's autodetection missed many relationships. Moreover, two of the autodetected relationships are semantically incorrect:
Executive[ID]->Industry[ID]BU[Executive_id]->Industry[ID]
Print the relationships as a table:
autodetectedIncorrect relationships to the
Industrytable appear in rows with index 3 and 4. Use this information to remove these rows.Discard the incorrectly identified relationships.
autodetected.drop(index=[3,4], inplace=True)
autodetected
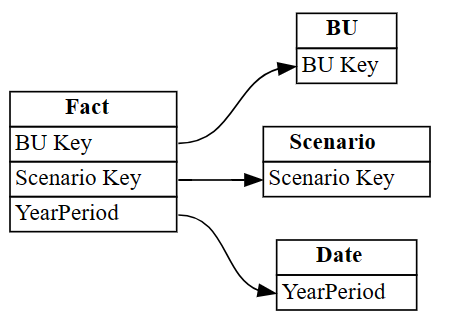
Now you have correct, but incomplete relationships.
Visualize these incomplete relationships, using
plot_relationship_metadata:plot_relationship_metadata(autodetected)Load all the tables from the semantic model, using SemPy's
list_tablesandread_tablefunctions:tables = {table: fabric.read_table(dataset, table) for table in fabric.list_tables(dataset)['Name']} tables.keys()Find relationships between tables, using
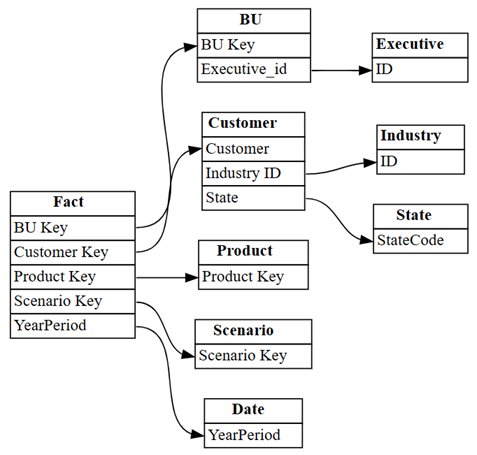
find_relationships, and review the log output to get some insights into how this function works:suggested_relationships_all = find_relationships( tables, name_similarity_threshold=0.7, coverage_threshold=0.7, verbose=2 )Visualize newly discovered relationships:
plot_relationship_metadata(suggested_relationships_all)SemPy was able to detect all relationships.
Use the
excludeparameter to limit the search to additional relationships that weren't identified previously:additional_relationships = find_relationships( tables, exclude=autodetected, name_similarity_threshold=0.7, coverage_threshold=0.7 ) additional_relationships
Validate the relationships
First, load the data from the Customer Profitability Sample semantic model:
dataset = "Customer Profitability Sample"
tables = {table: fabric.read_table(dataset, table) for table in fabric.list_tables(dataset)['Name']}

tables.keys()
Check for overlap of primary and foreign key values by using the
list_relationship_violationsfunction. Supply the output of thelist_relationshipsfunction as input tolist_relationship_violations:list_relationship_violations(tables, fabric.list_relationships(dataset))The relationship violations provide some interesting insights. For example, one out of seven values in
Fact[Product Key]isn't present inProduct[Product Key], and this missing key is50.
Exploratory data analysis is an exciting process, and so is data cleaning. There's always something that the data is hiding, depending on how you look at it, what you want to ask, and so on. Semantic link provides you with new tools that you can use to achieve more with your data.
Related content
Check out other tutorials for semantic link / SemPy:
- Tutorial: Clean data with functional dependencies
- Tutorial: Analyze functional dependencies in a sample semantic model
- Tutorial: Extract and calculate Power BI measures from a Jupyter notebook
- Tutorial: Discover relationships in the Synthea dataset, using semantic link
- Tutorial: Validate data using SemPy and Great Expectations (GX)
